Last quarter, a product director at a 400-bed health system in Pennsylvania pitched an AI prior authorization agent to their CFO. The presentation included a vendor demo, a competitor case study, and a slide that said "significant cost savings." The CFO asked three questions: What is the total cost of ownership in year one? When exactly do we break even? What happens to the numbers if our volume is 20% lower than projected? The product director did not have answers. The project was tabled for "further analysis."
This happens constantly. 73% of healthcare AI projects deliver positive ROI within the first year, but the projects that get funded are the ones with CFO-grade financial models: specific inputs, defensible assumptions, sensitivity analysis, and a clear payback timeline. Enthusiasm does not get budget approval. Numbers do.
This guide gives you the exact framework for building an AI agent business case that survives CFO scrutiny. We walk through every input, every calculation, and a complete worked example for prior authorization automation, the use case with the most documented ROI data in healthcare.
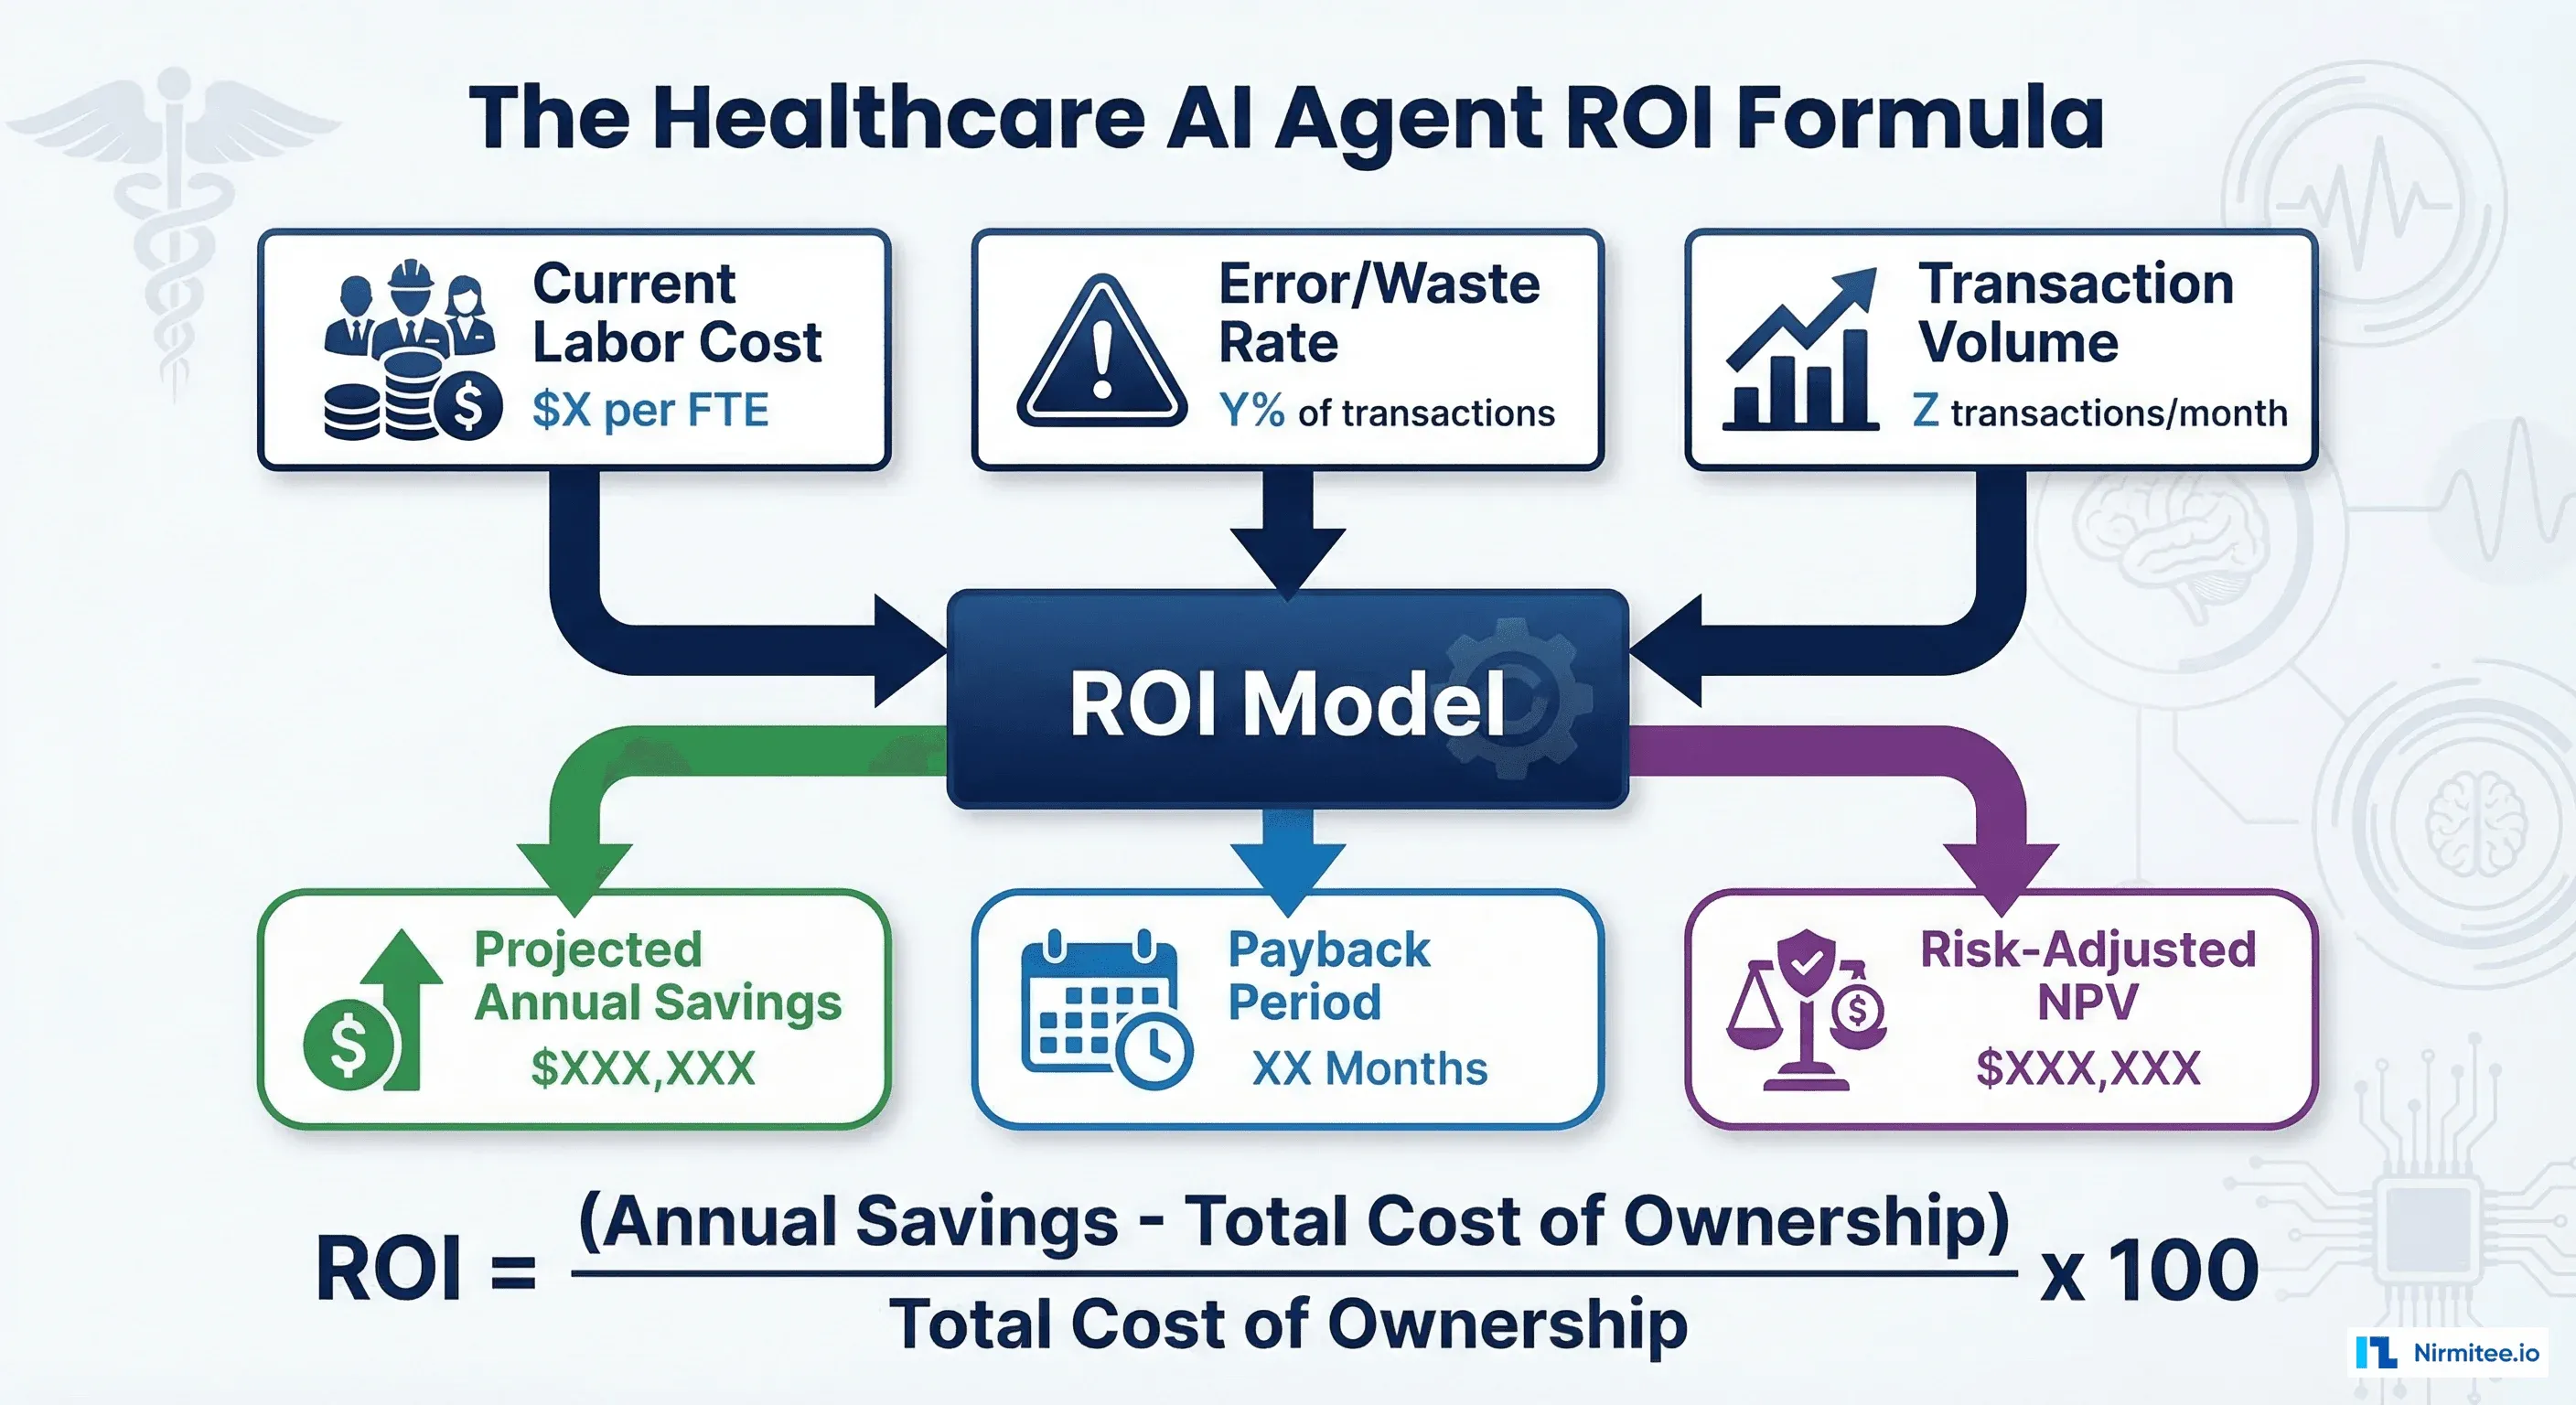
Step 1: Calculate Your Current-State Costs (The Baseline)
Before projecting savings, you need an accurate picture of what the current process costs. CFOs will reject any business case that compares AI costs to vague estimates of current spending. Get the real numbers.
Labor Cost Per Process
For each administrative process the AI agent will automate, calculate the fully-loaded labor cost:
Labor Cost Per Transaction = (Fully Loaded FTE Cost / Annual Working Hours) x Minutes Per Transaction / 60

Example: Prior Authorization
- Fully loaded cost per FTE (salary + benefits + overhead): $72,000/year
- Annual working hours: 1,920 (40 hrs/week x 48 weeks)
- Average minutes per prior auth: 14 minutes (CAQH Index)
- Labor cost per transaction: ($72,000 / 1,920) x (14/60) = $8.75

Annual volume: 45,000 prior authorizations
Total annual labor cost: $8.75 x 45,000 = $393,750
Error and Rework Costs
Manual processes have error rates. Errors cause rework, denials, and revenue leakage. Quantify these:
| Cost Category | How to Calculate | Prior Auth Example |
|---|---|---|
| Denial rework cost | Denial rate x volume x cost per rework | 22% x 45,000 x $25 = $247,500 |
| Revenue lost to denials | Denied procedures x avg revenue x non-recovery rate | 9,900 denials x $850 avg x 18% unrecovered = $1,513,800 |
| Treatment delay cost | Avg delay days x downstream cost per day | 3.5 days x $45/day patient cost = difficult to quantify |
| Staff overtime | OT hours per month x OT rate | 120 hrs/month x $28/hr = $40,320/year |
Total current-state annual cost (prior auth example): $2,195,370
Most business cases undercount current costs by 40-60% because they only include direct labor. The error costs, revenue leakage, and overtime are where the real money is hiding.
Step 2: Estimate the Future-State Costs (AI Agent TCO)
CFOs think in Total Cost of Ownership (TCO), not license fees. A CFO-grade model separates one-time costs from recurring costs and includes every line item, especially the hidden ones.
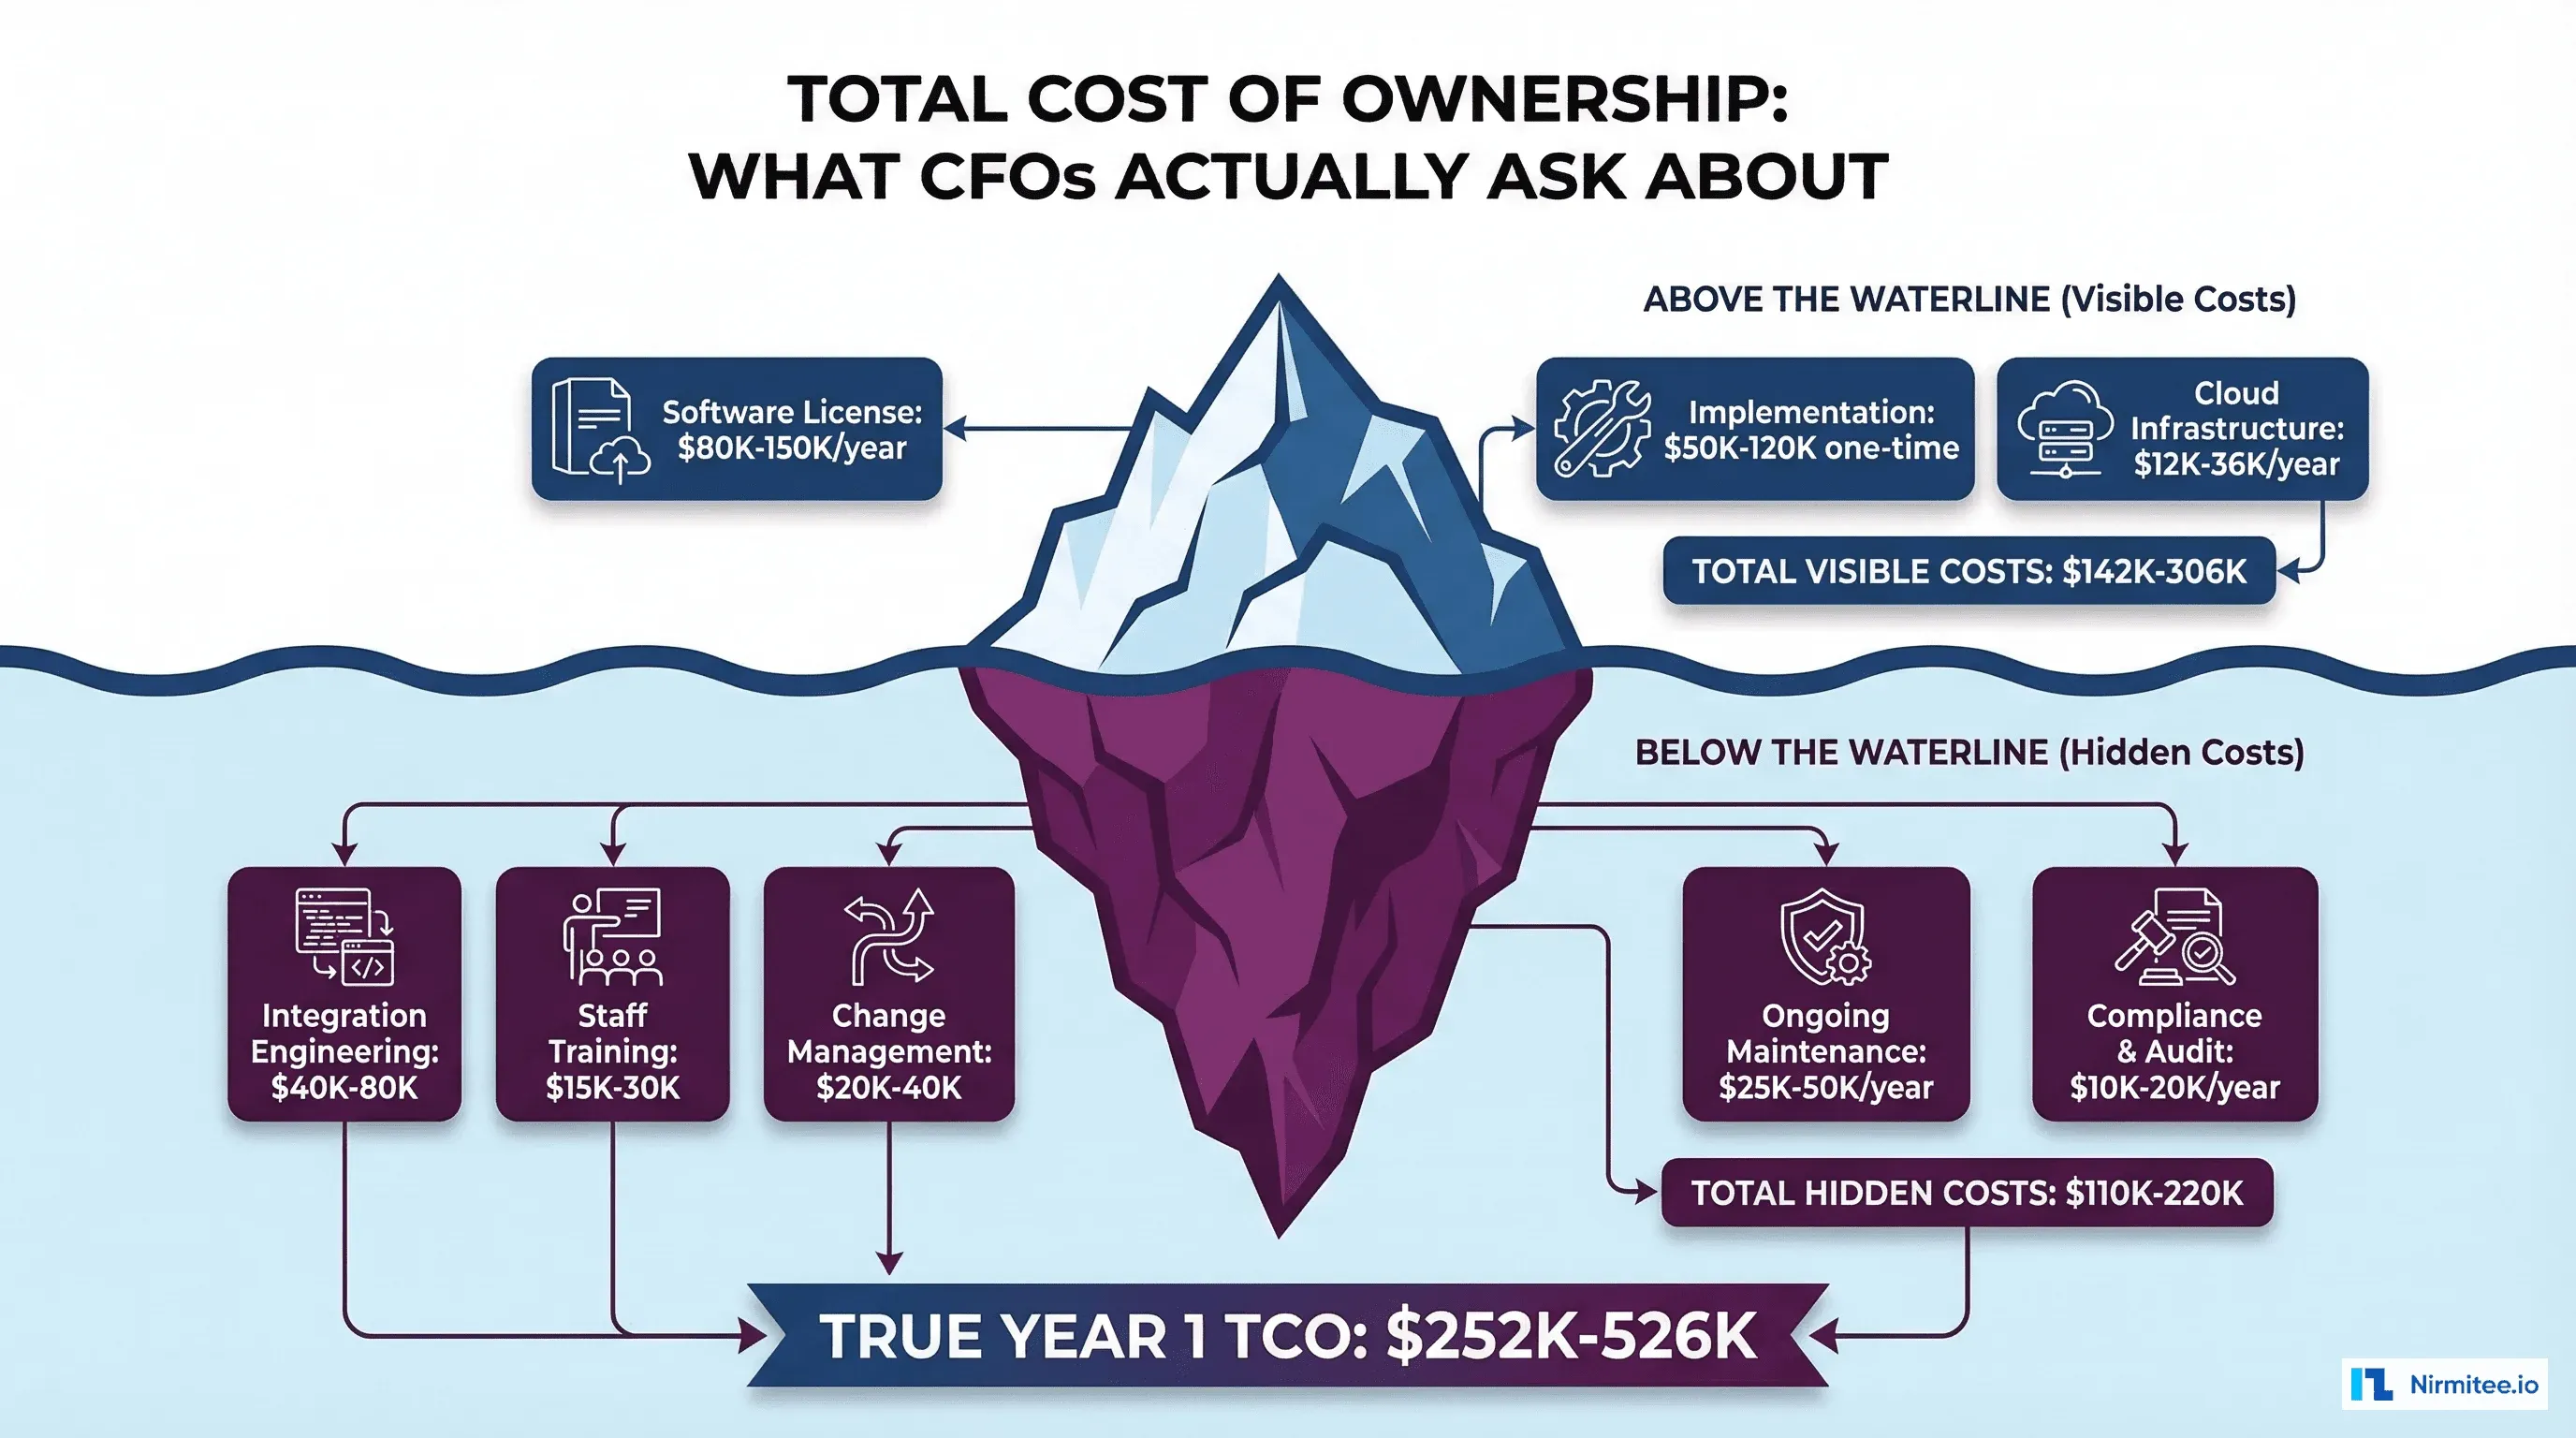
Year 1 TCO Breakdown
| Category | One-Time | Annual Recurring |
|---|---|---|
| Software licensing | - | $80,000-$150,000 |
| Implementation and integration | $50,000-$120,000 | - |
| Cloud infrastructure | - | $12,000-$36,000 |
| EHR integration engineering | $40,000-$80,000 | - |
| Staff training | $15,000-$30,000 | - |
| Change management | $20,000-$40,000 | - |
| Ongoing maintenance and support | - | $25,000-$50,000 |
| Compliance and audit | - | $10,000-$20,000 |
| Year 1 Total TCO | $125,000-$270,000 | $127,000-$256,000 |
| Combined Year 1 | $252,000-$526,000 | |
Year 2+ costs drop significantly because one-time implementation costs are gone. Typical Year 2 TCO is $127,000-$256,000 (recurring only).
Step 3: Calculate the Savings (Future-State Benefits)
Map every benefit to a dollar amount. CFOs respect three categories of savings: hard savings (reduced headcount or eliminated vendor costs), soft savings (time redirected to higher-value work), and revenue impact (reduced denials, increased throughput).
Worked Example: Prior Authorization AI Agent
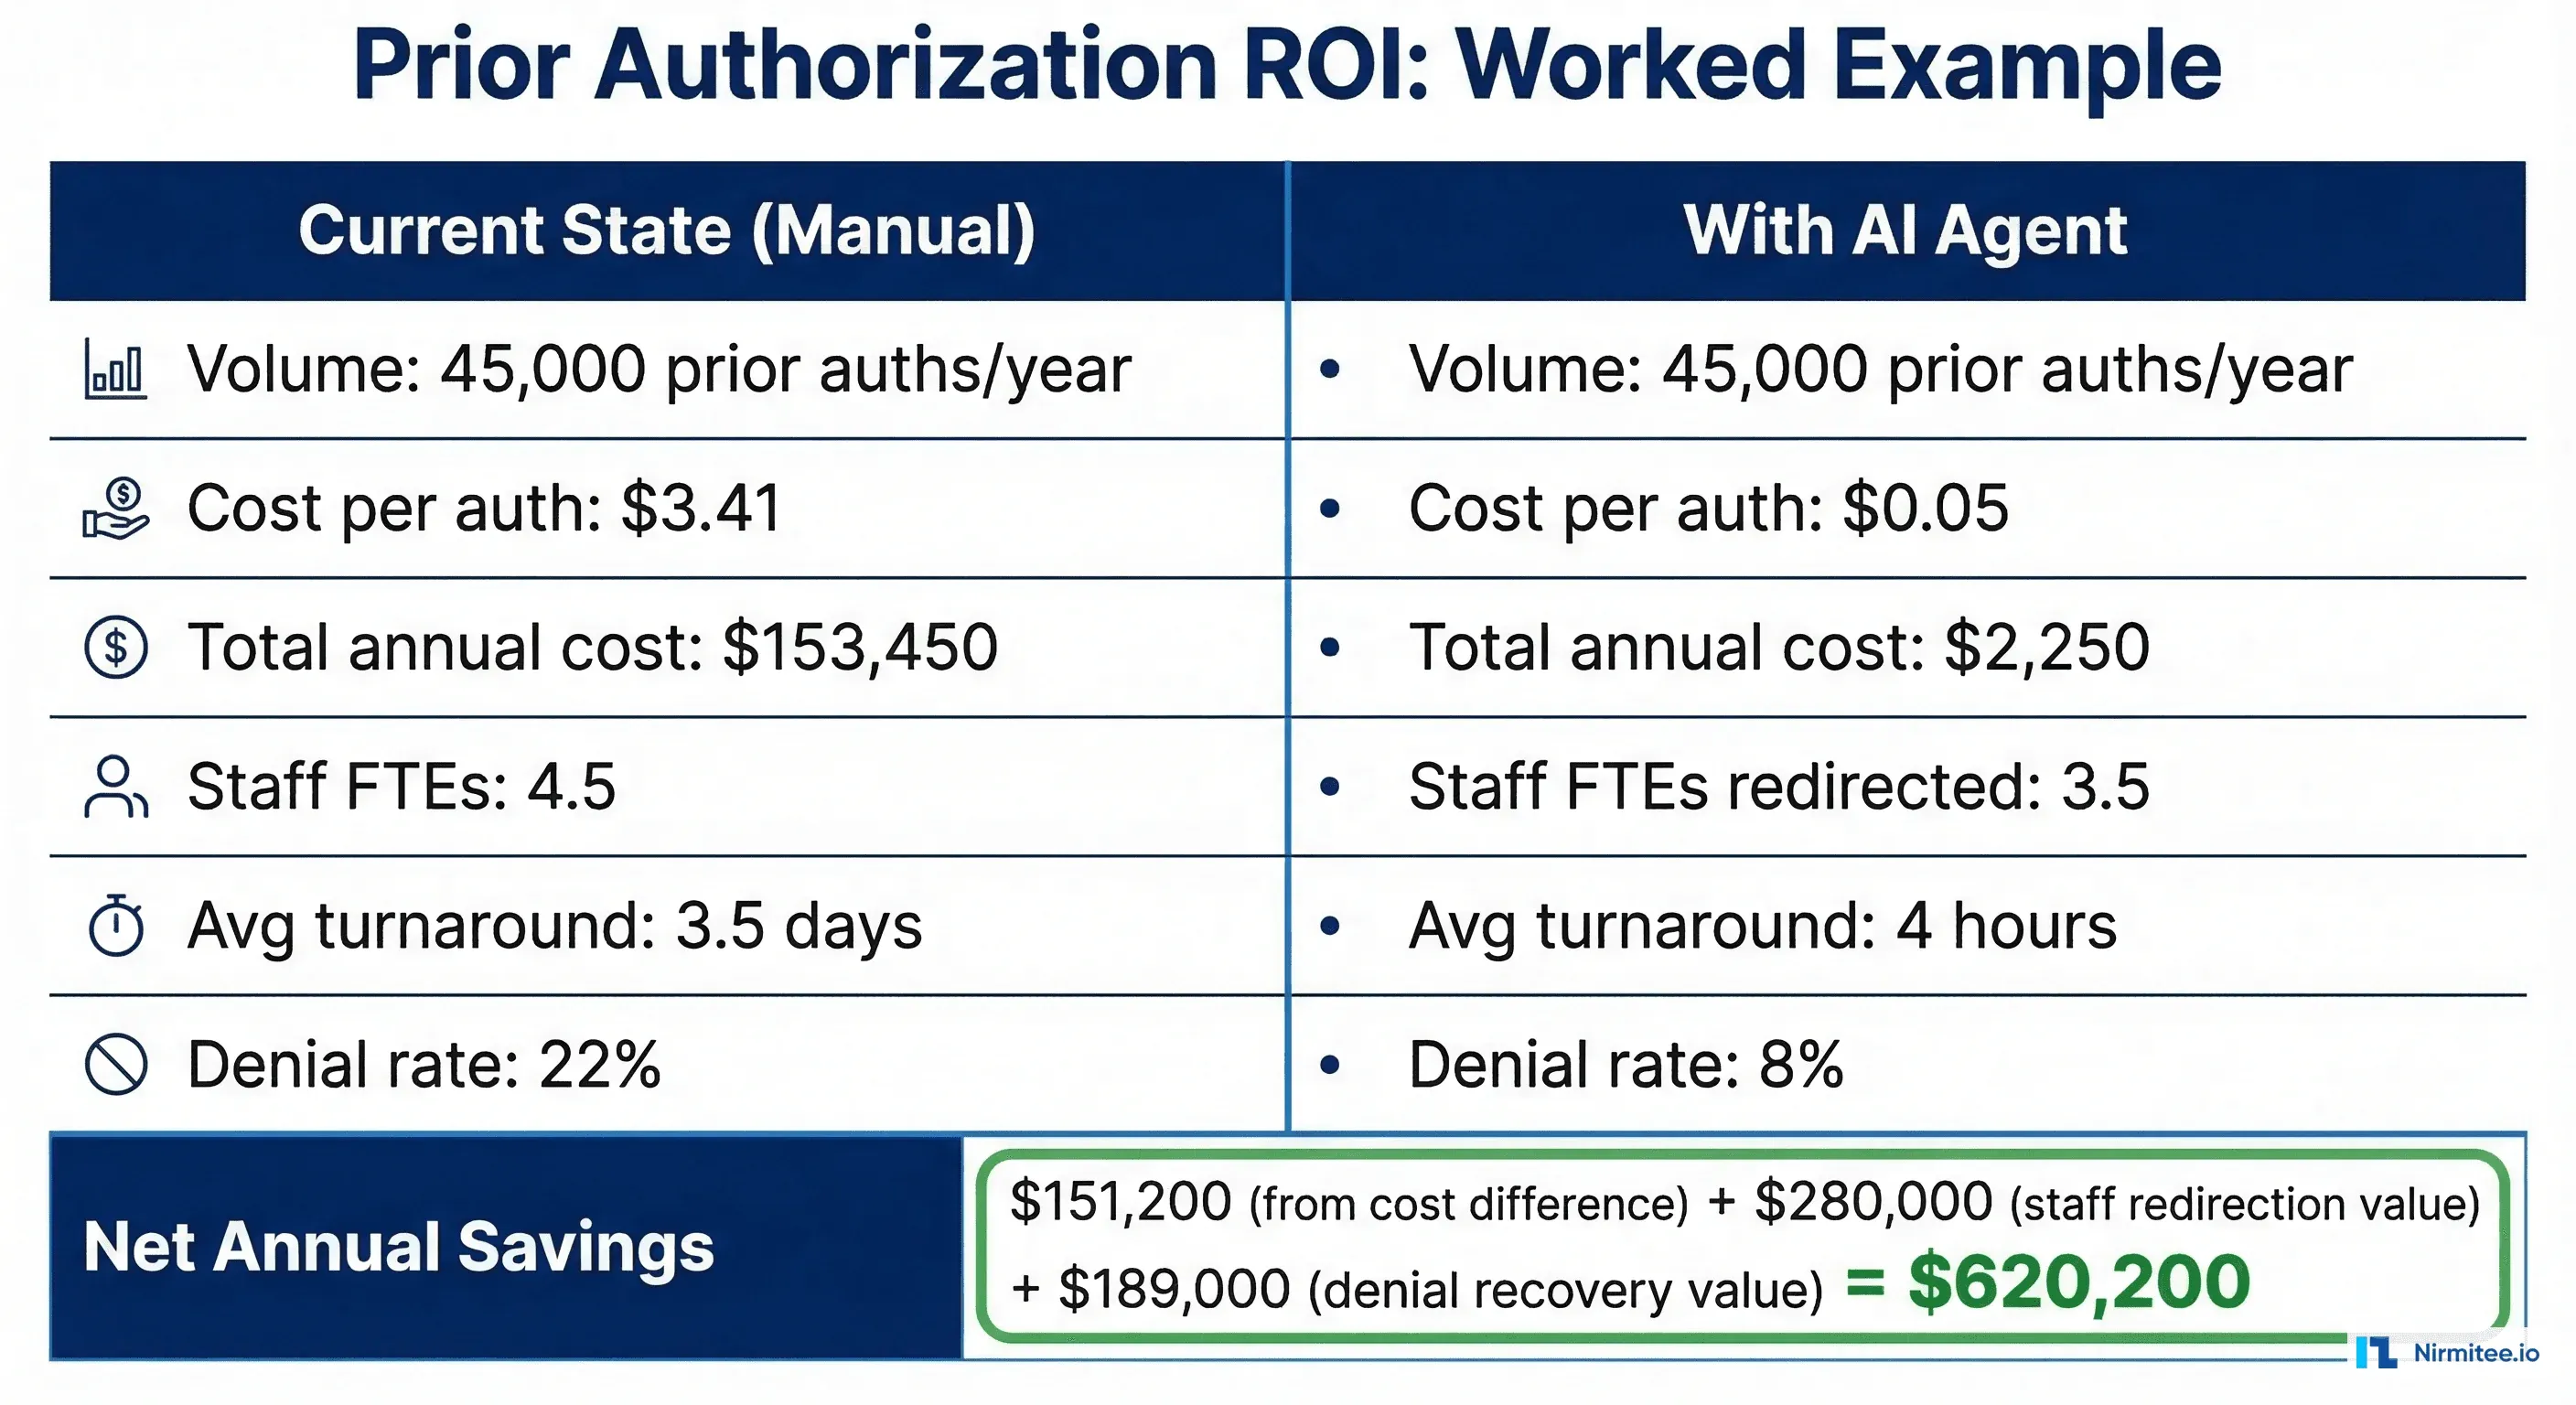
HARD SAVINGS
  Transaction cost reduction: ($8.75 - $0.05) x 45,000 = $391,500
  FTE reduction/redeployment: 3.5 FTEs x $72,000 = $252,000
  Overtime elimination: $40,320
  Subtotal hard savings: $683,820

REVENUE IMPACT
  Denial rate reduction: 22% to 8% = 14% improvement
  Additional approved procedures: 6,300 x $850 avg = $5,355,000 gross
  Net revenue recovered (margin): $5,355,000 x 35% margin = $1,874,250
  Faster turnaround revenue: (3.5 days to 4 hours) = difficult to quantify
  Subtotal revenue impact: $1,874,250

SOFT SAVINGS (track but do not rely on for ROI)
  Staff satisfaction improvement
  Patient experience (faster treatment access)
  Reduced clinician burden

TOTAL ANNUAL BENEFIT: $2,558,070
YEAR 1 TCO (midpoint): $389,000
YEAR 1 NET SAVINGS: $2,169,070
ROI: ($2,558,070 - $389,000) / $389,000 = 557%
PAYBACK PERIOD: $389,000 / ($2,558,070 / 12) = 1.8 months
Note: this example includes revenue impact from denial reduction, which is the largest driver. If your CFO only approves hard savings, the ROI is still 76% ($683,820 savings vs. $389,000 cost), with a payback period under 7 months.
Step 4: Build the Risk Model (Sensitivity Analysis)
No CFO trusts a single-point estimate. Build a sensitivity analysis that shows how the ROI holds up when your assumptions are wrong.
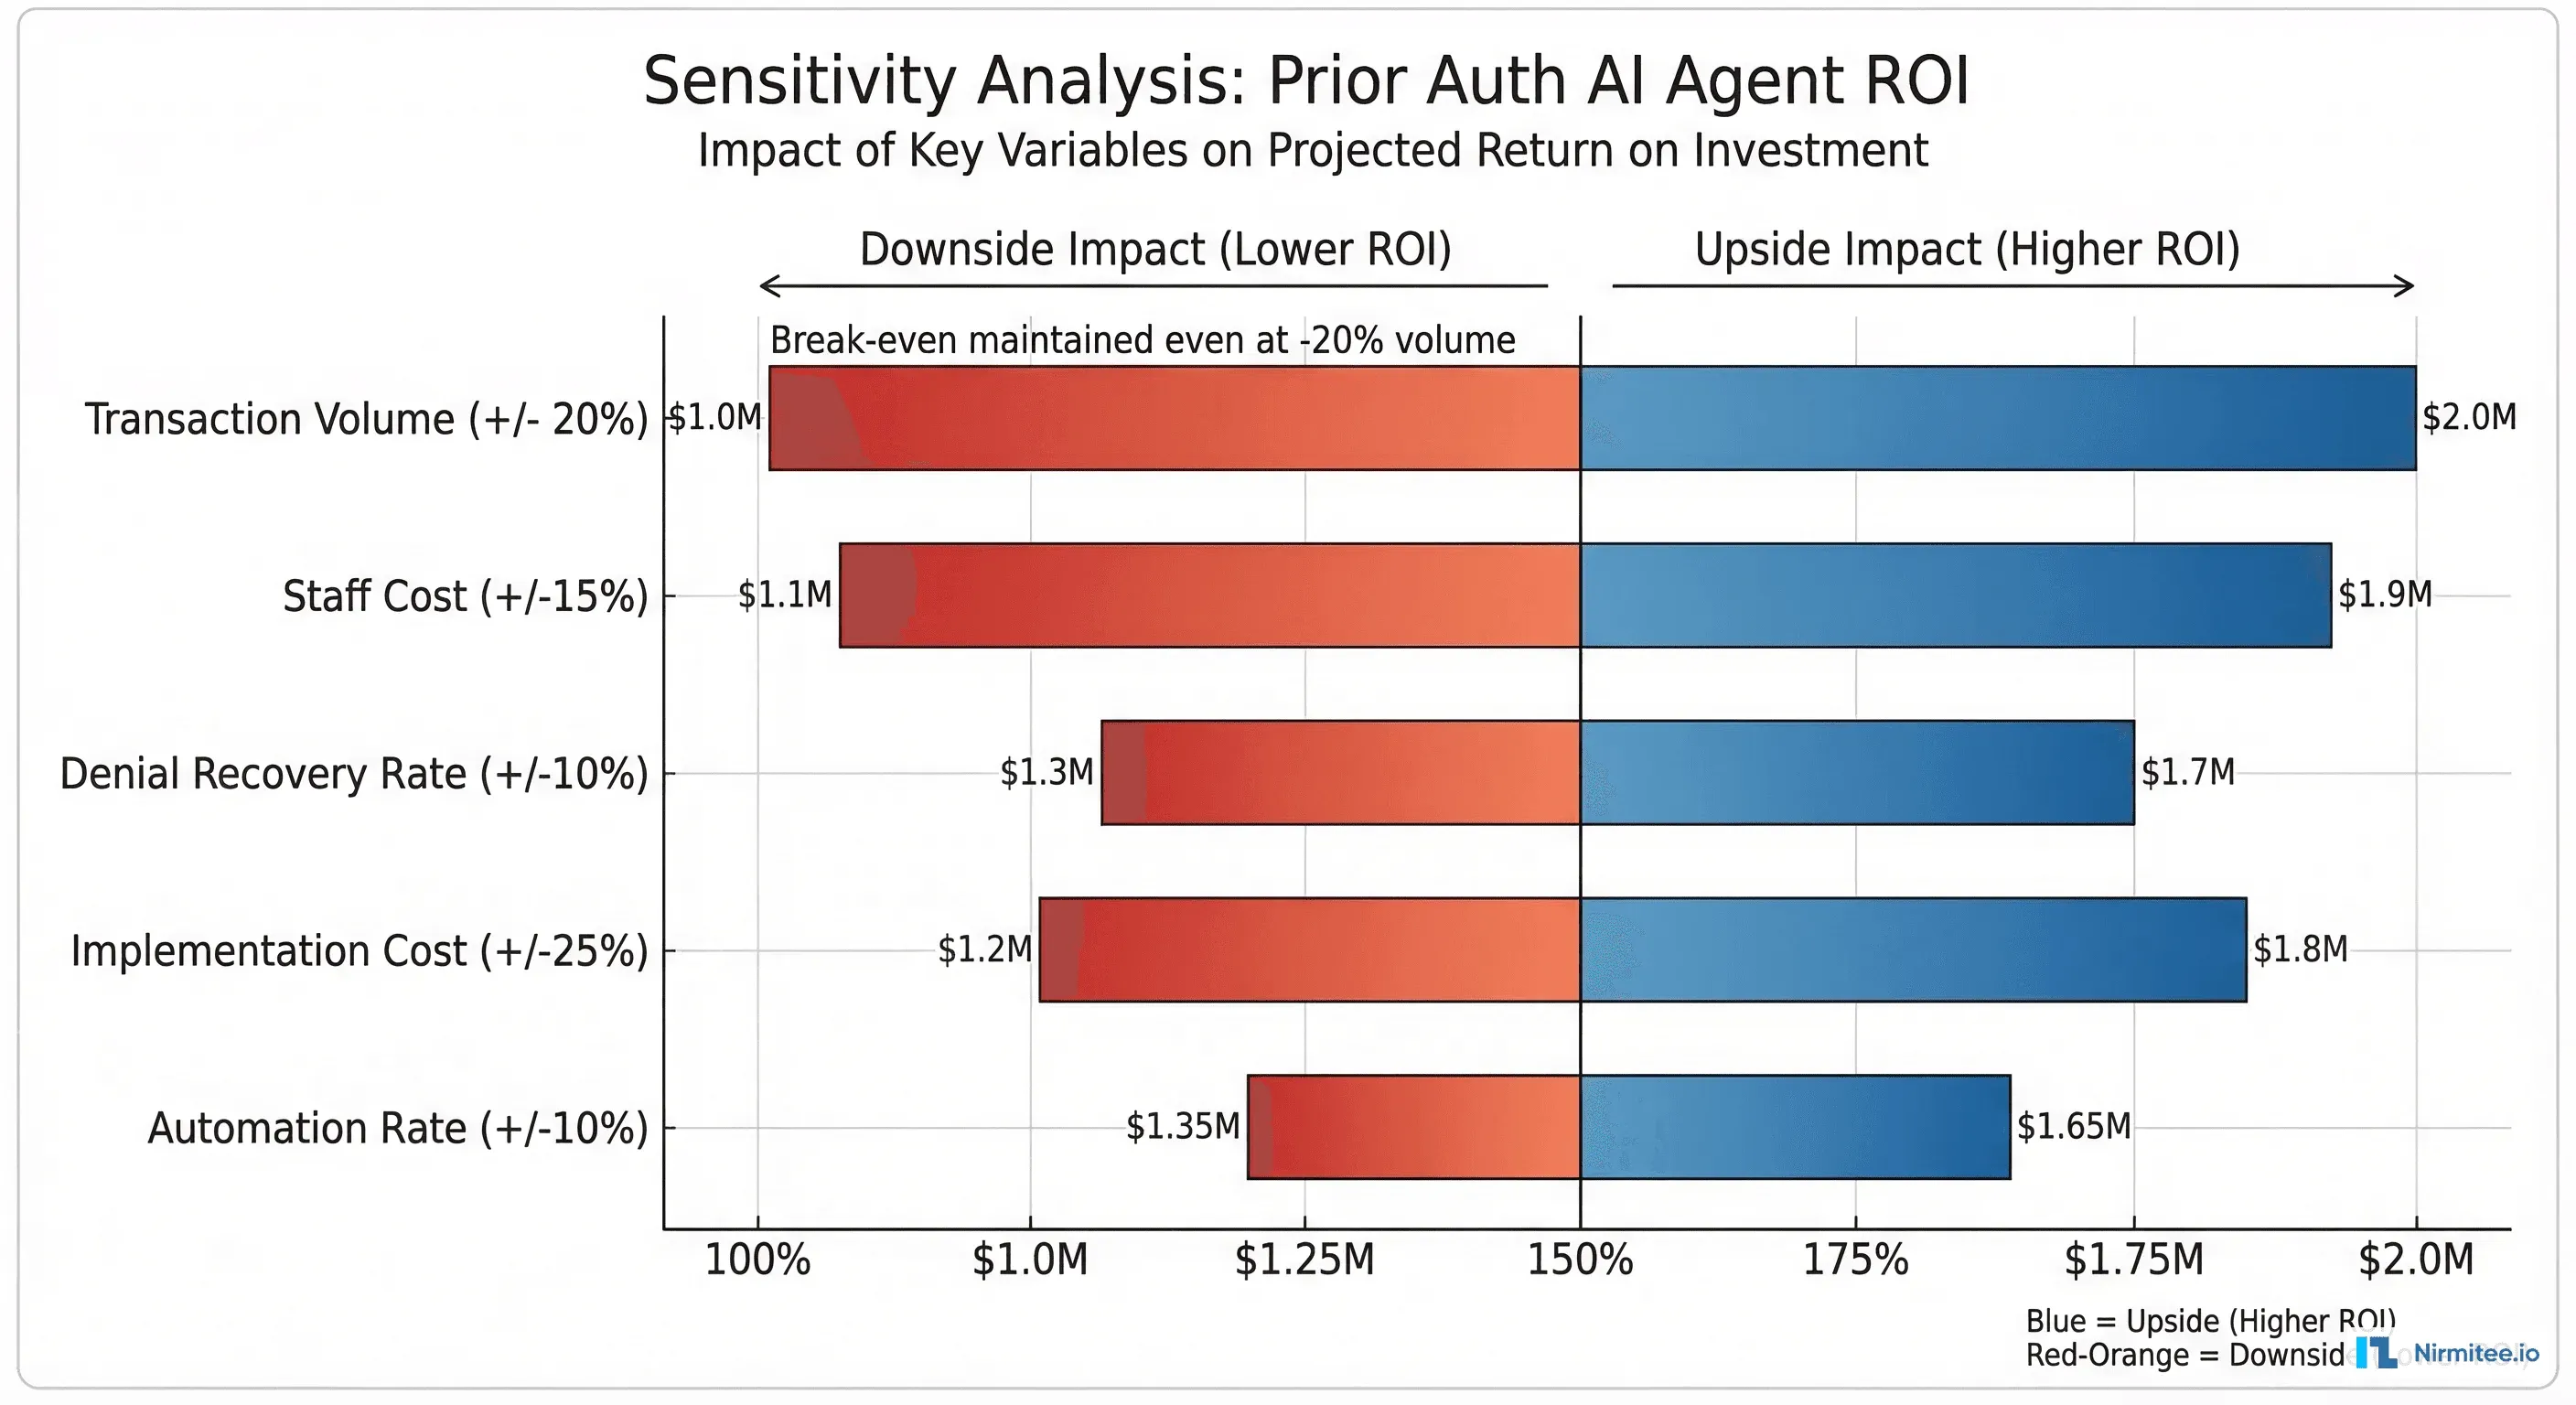
Key Variables to Stress-Test
| Variable | Base Case | Pessimistic (-20%) | Optimistic (+20%) |
|---|---|---|---|
| Transaction volume | 45,000/year | 36,000/year | 54,000/year |
| Automation rate | 85% | 68% | 95% |
| Denial rate improvement | 14 points | 8 points | 18 points |
| Implementation cost | $389K | $487K (+25%) | $311K (-20%) |
| Staff cost per FTE | $72,000 | $61,200 | $86,400 |
Pessimistic scenario (all variables at downside): Annual benefit of $1,534,842 vs. TCO of $487,000. ROI: 215%. Payback: 3.8 months.
The key finding for your CFO: Even in the worst-case scenario where every assumption misses by 20%, the project still delivers 215% ROI and pays back in under 4 months. The risk of inaction (continuing to spend $2.2M/year on manual prior auth) is higher than the risk of the AI investment.
Step 5: Present the Business Case
Structure your presentation for the CFO audience: lead with the bottom line, then support with details.
The One-Page Executive Summary
Your CFO needs to make a decision, not read a novel. The executive summary should fit on one page:
- Ask: $389,000 Year 1 investment for AI prior authorization agent
- Return: $2.56M annual savings (557% ROI, 1.8-month payback)
- Risk-adjusted return: $1.53M annual savings even at -20% on all assumptions (215% ROI)
- Funding source: Operational budget (no CapEx required)
- Timeline: 90-day proof of value, full deployment in 6 months
- Comparable: Industry benchmark: 3.2x return within 14 months
Handling the Five CFO Objections
Every healthcare CFO asks these same questions. Prepare your responses with data.
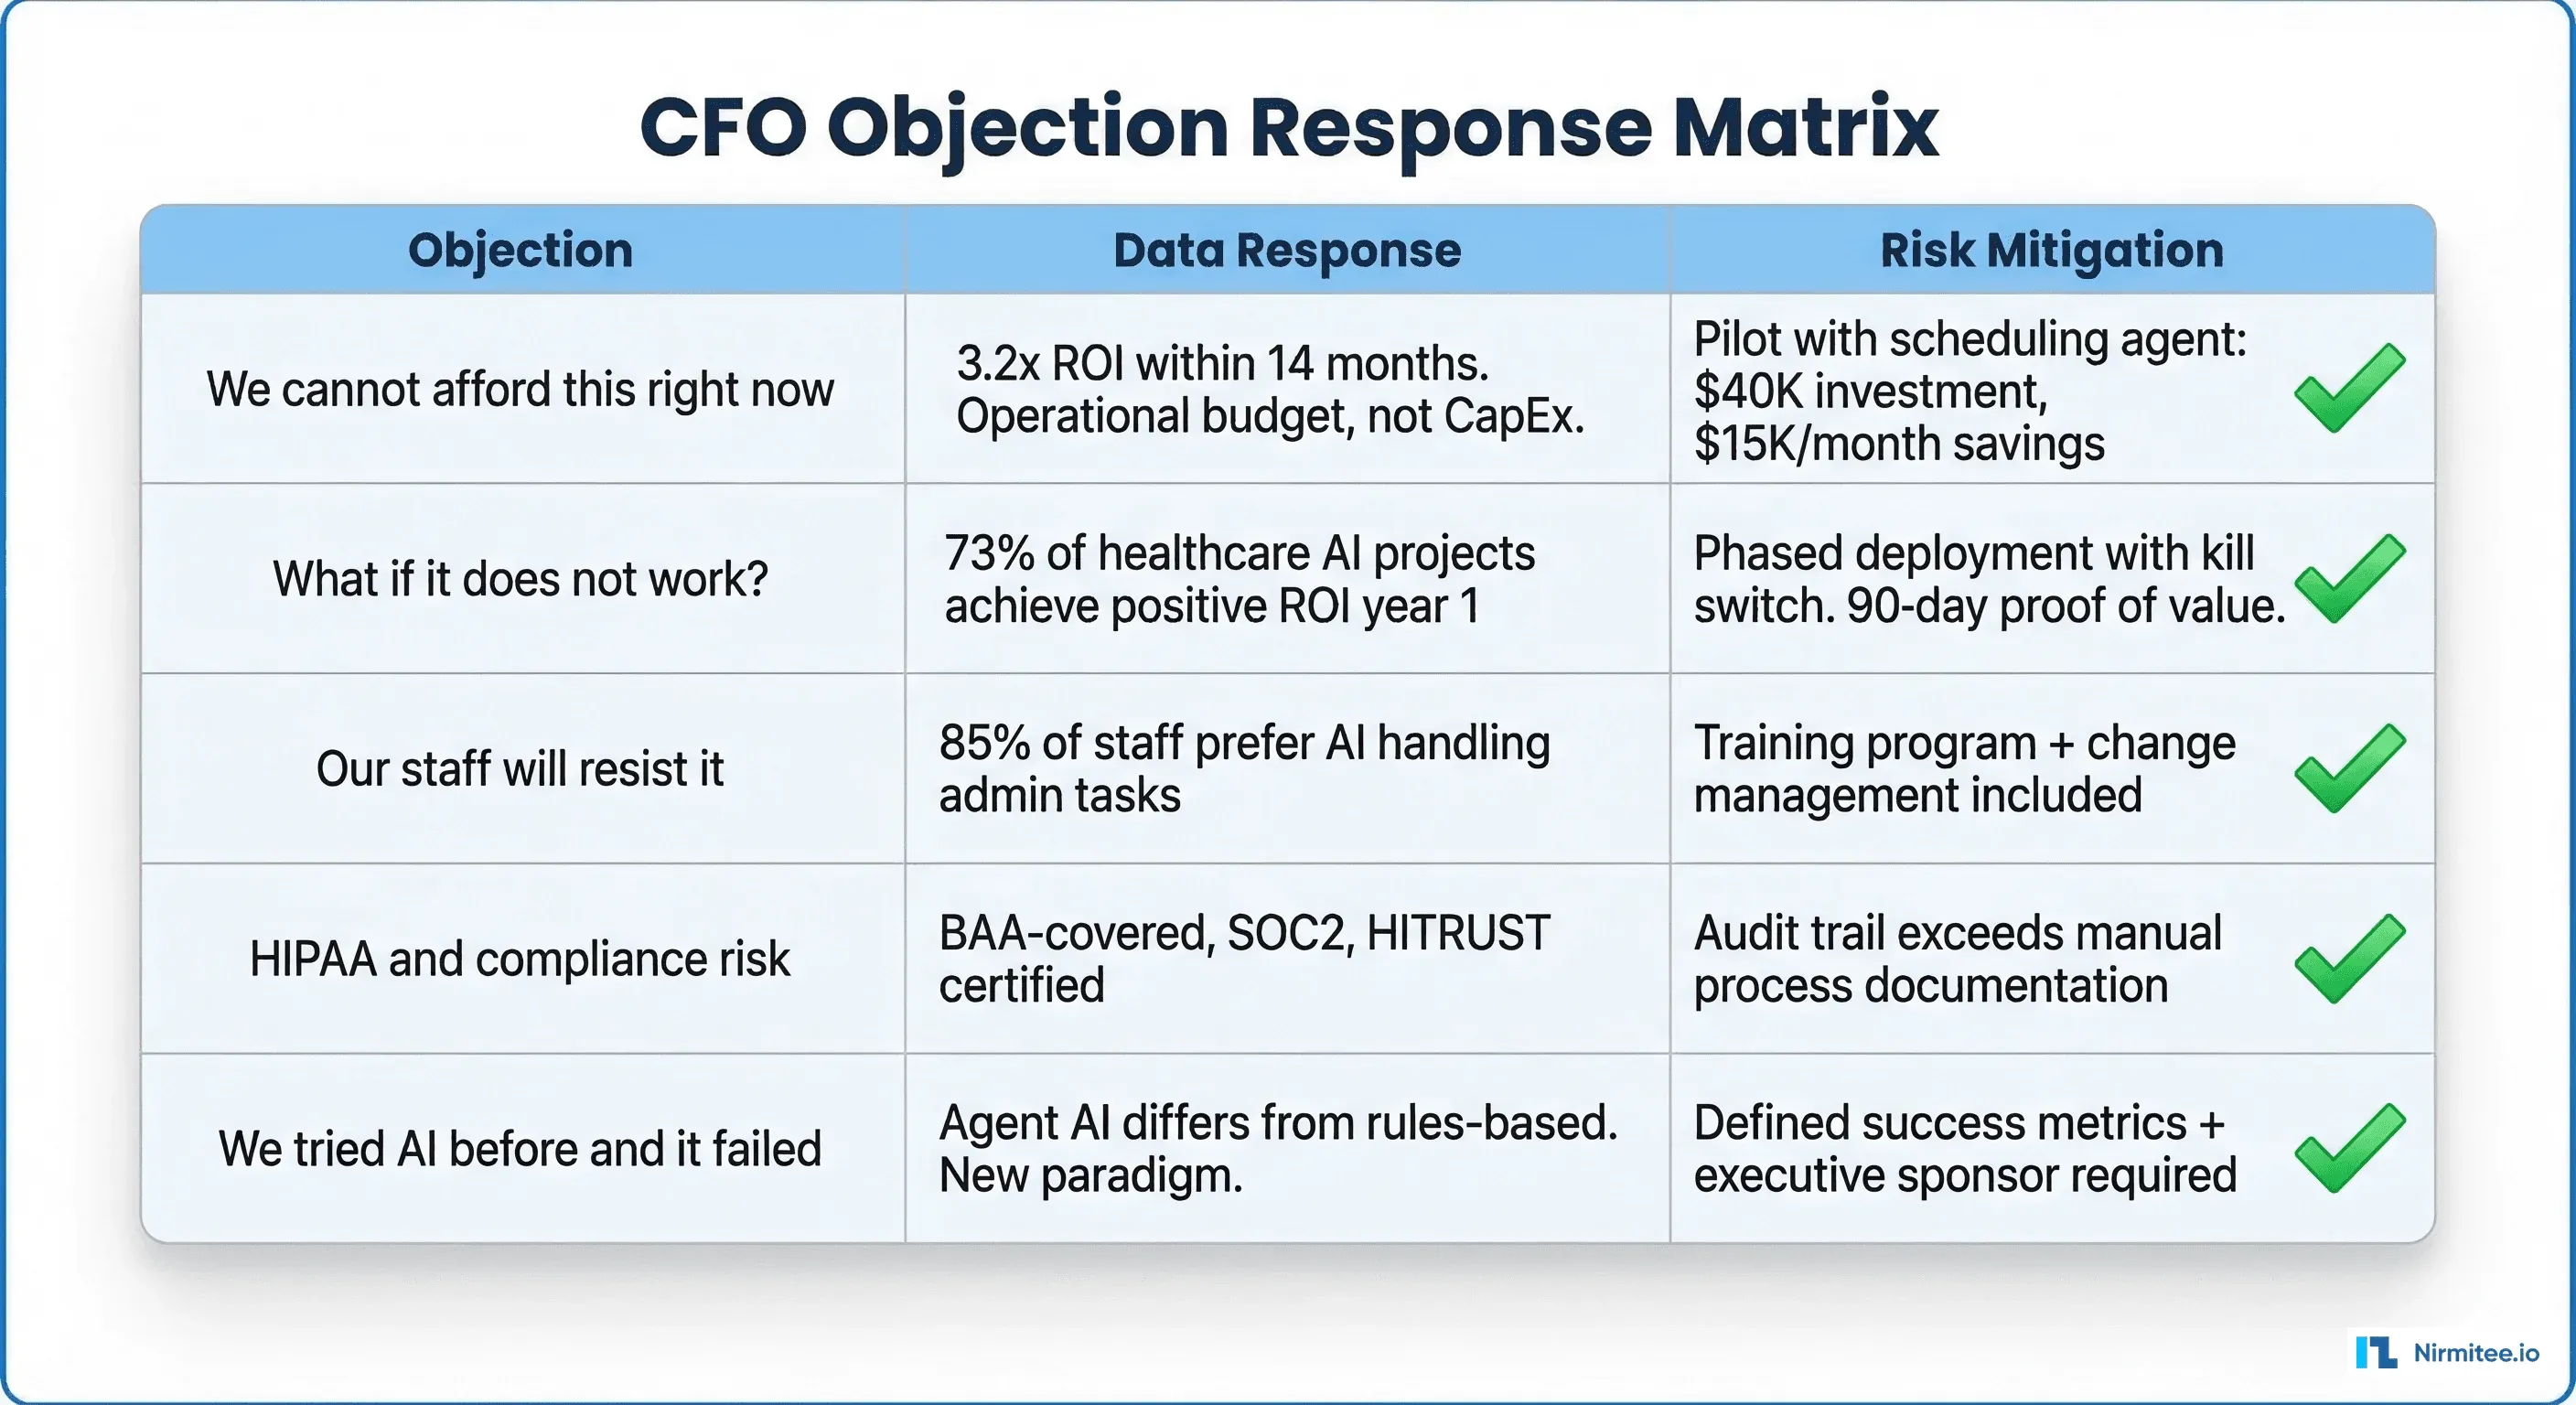
Objection 1: "We cannot afford this right now."
Response: "The question is whether we can afford not to. We are spending $2.2 million annually on manual prior authorization. A $389,000 investment reduces that to $180,000 in recurring costs. The project funds itself from savings within 2 months. This is an operational budget line item, not a capital expenditure."
Objection 2: "What if the AI does not work?"
Response: "73% of healthcare organizations report positive AI ROI within year one. We will structure a 90-day proof of value in a single department. If we do not see measurable improvement in denial rates and processing time within 90 days, we stop. Total risk exposure is $97,000 (one quarter of Year 1 TCO), not the full $389,000."
Objection 3: "Our staff will resist this."
Response: "Prior auth staff spend 70% of their time on repetitive submission tasks they do not enjoy. The agent handles submissions; staff handle exceptions, appeals, and complex cases, the work that requires human judgment. In peer organizations, staff satisfaction improved because they were freed from the most tedious parts of their job."
Objection 4: "What about HIPAA and compliance?"
Response: "The AI agent operates within our existing HIPAA compliance framework. It has a BAA with the vendor, SOC 2 Type II certification, and generates a more complete audit trail than manual processing. Every transaction is logged with user, timestamp, data accessed, and decision rationale, exceeding what our current manual process documents."
Objection 5: "We tried AI before and it did not work."
Response: "The previous generation of healthcare AI was rules-based and brittle. AI agents use large language models that understand clinical context, adapt to payer-specific requirements, and improve with use. The 2024-2026 generation of healthcare AI is delivering 300%+ ROI in revenue cycle management, validated across hundreds of organizations."
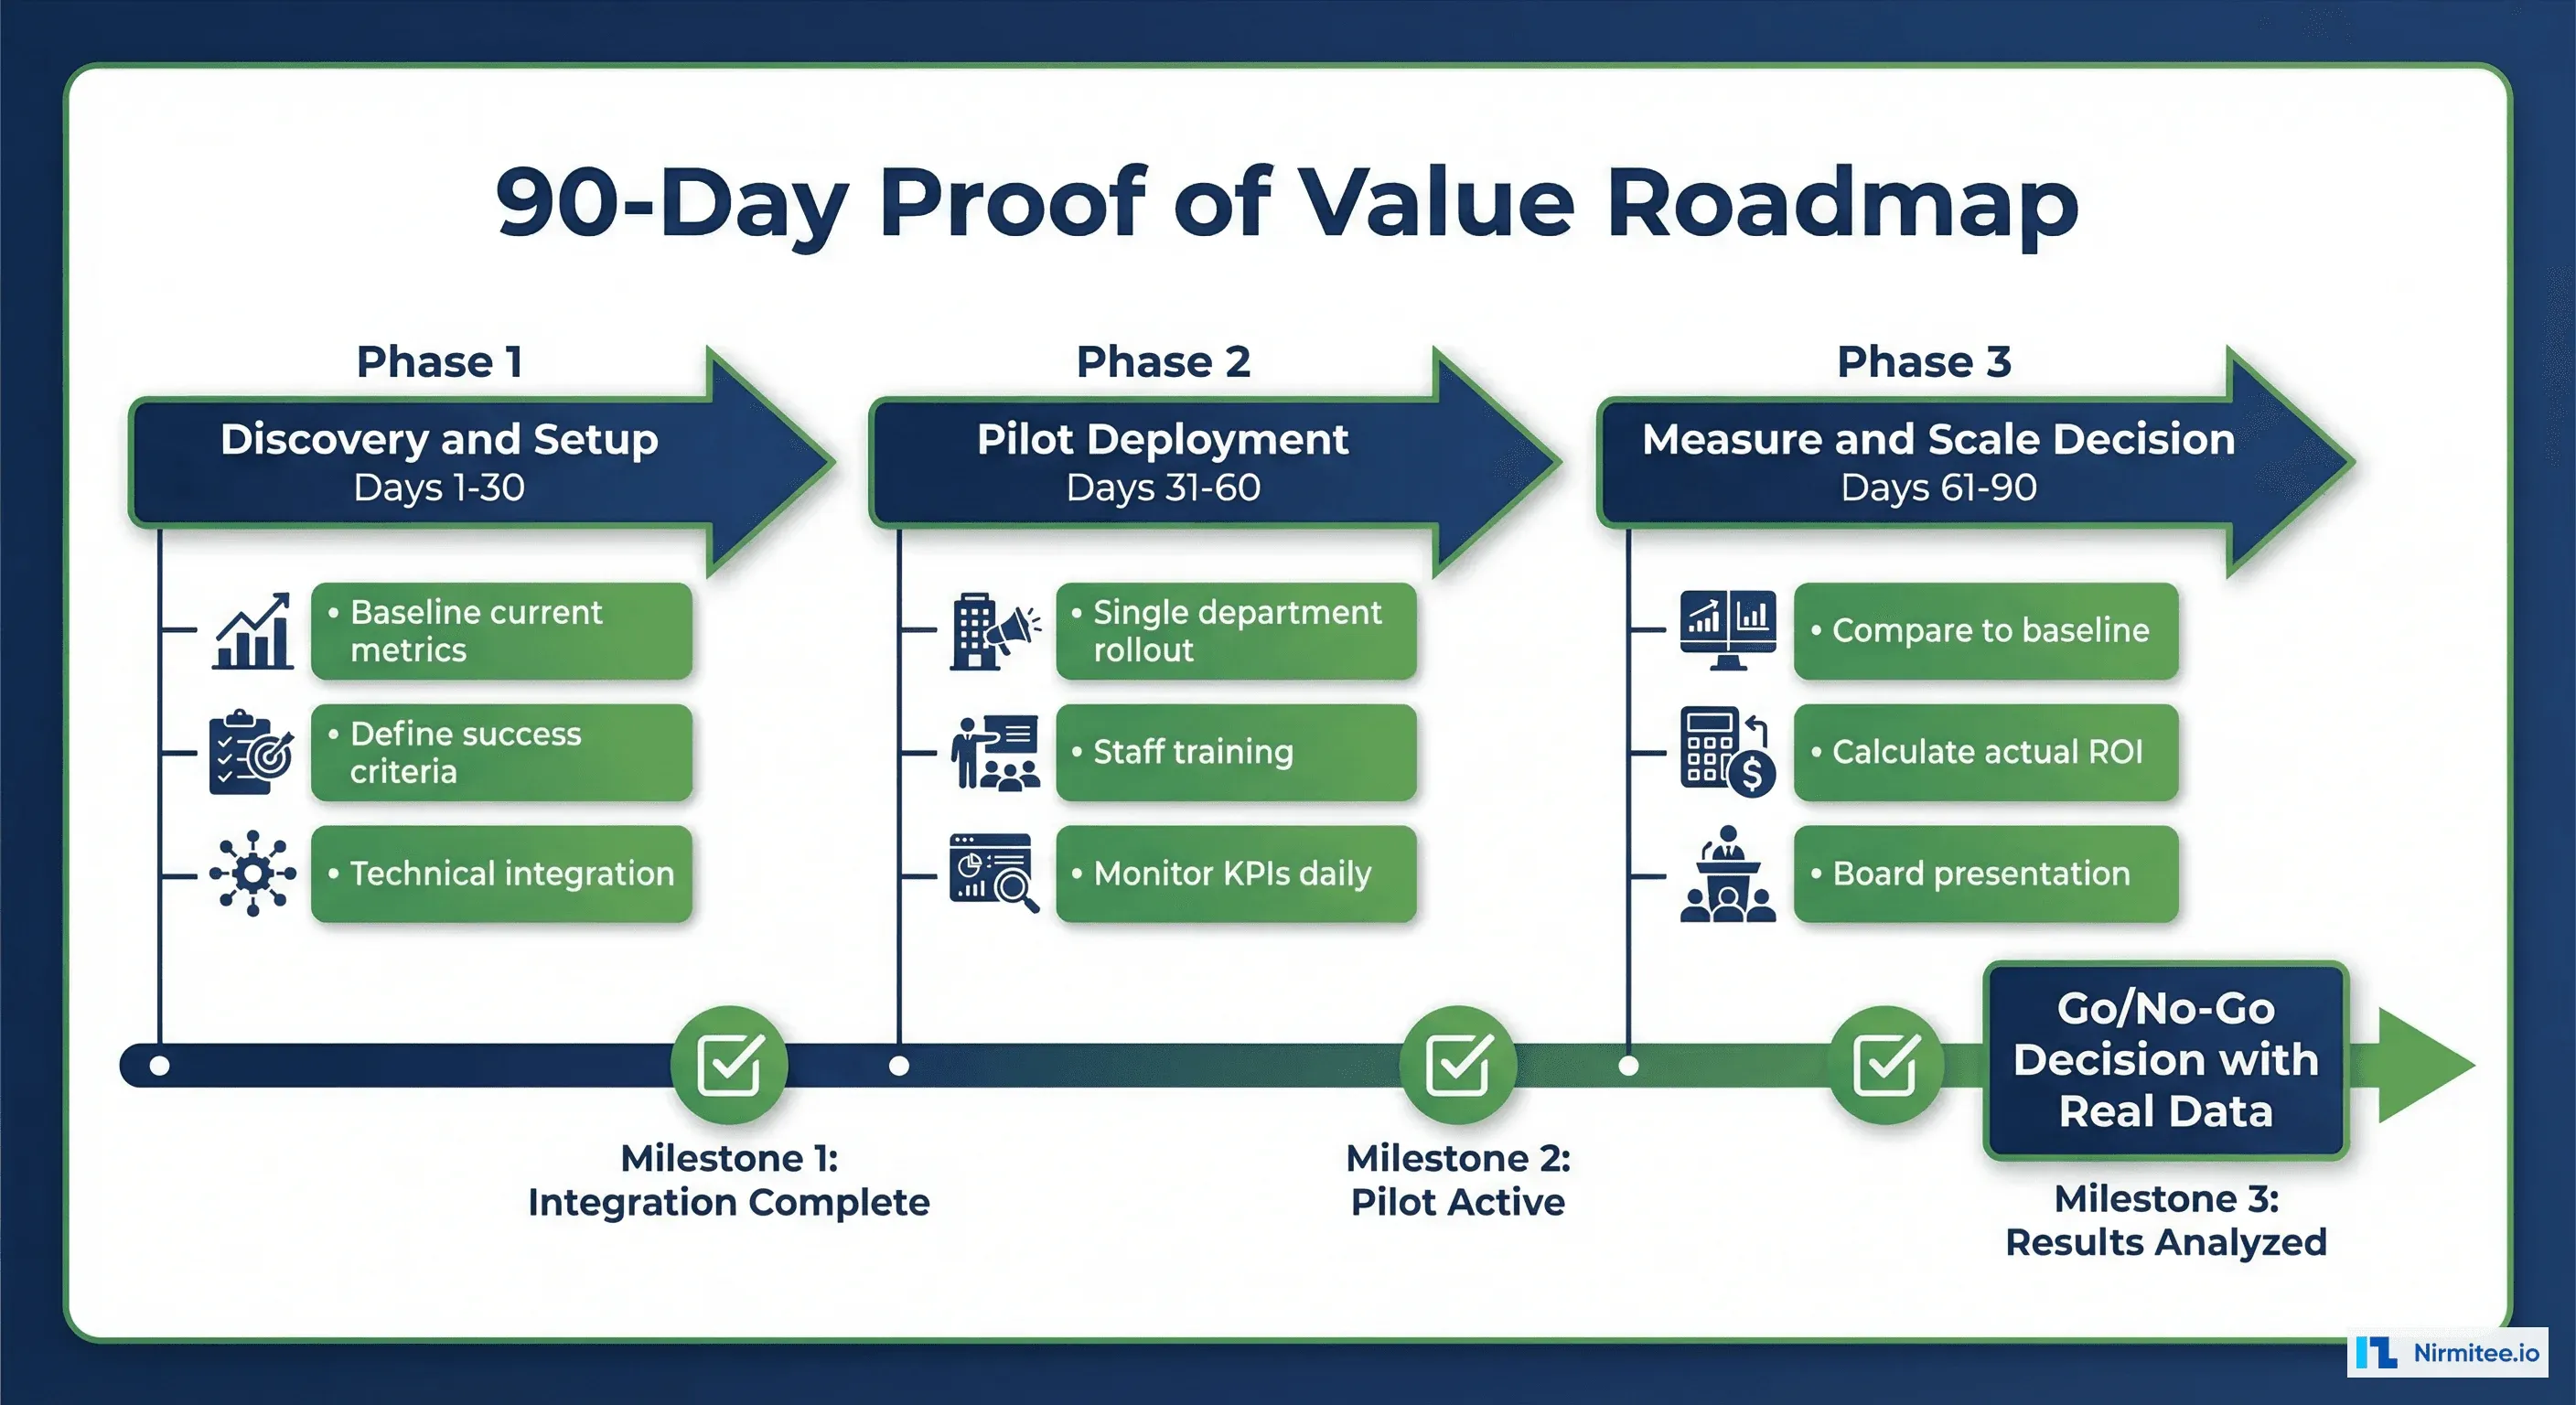
The 90-Day Proof of Value Structure
If your CFO is not ready for a full commitment, propose a 90-day proof of value (PoV). This is a structured pilot with defined success criteria, limited financial exposure, and clear go/no-go decision points.
Phase 1: Baseline (Days 1-30)
- Measure current-state metrics: cost per transaction, denial rate, turnaround time, staff hours
- Define success criteria: "We will proceed to full deployment if [metric] improves by [X%]"
- Complete technical integration with one EHR department
Phase 2: Pilot (Days 31-60)
- Deploy AI agent for one department or one payer
- Run in parallel with existing process (AI handles new requests, staff handles exceptions)
- Track daily KPIs: automation rate, accuracy, turnaround time, denial rate
Phase 3: Decision (Days 61-90)
- Compare pilot metrics to baseline
- Calculate actual ROI based on real data (not projections)
- Present results to CFO with go/no-go recommendation
- If go: request full deployment budget backed by pilot data
The NPV Calculation Your CFO Wants
For investments above $250,000, most healthcare CFOs want a Net Present Value (NPV) analysis over 3-5 years. Here is the framework:
3-Year NPV Analysis: Prior Authorization AI Agent
Discount rate: 10% (typical healthcare WACC)

Year 0 (implementation): -$389,000
Year 1 net benefit: $2,558,070 - $256,000 (recurring) = $2,302,070
Year 2 net benefit: $2,814,877 (10% volume growth) - $269,000 = $2,545,877
Year 3 net benefit: $3,096,365 (10% growth) - $282,000 = $2,814,365

NPV = -$389,000 + $2,302,070/1.1 + $2,545,877/1.21 + $2,814,365/1.331
NPV = -$389,000 + $2,092,791 + $2,104,030 + $2,114,474
NPV = $5,922,295

Risk-adjusted NPV (70% confidence): $4,145,607
A $5.9 million NPV on a $389,000 investment. Even risk-adjusted at 70% confidence, the NPV is $4.1 million. This is the number that gets projects approved.
Getting Started
Download these numbers. Plug in your organization's actual volume, staff costs, and denial rates. The framework works for any administrative AI agent, not just prior authorization. Map the patient journey stages in your organization, pick the highest-volume administrative process, and run the model.
At Nirmitee, we build the AI agents and the business cases. Our team works with product managers and finance leaders to model ROI using your real operational data, then delivers the agent that hits those numbers. Start with a 30-minute ROI assessment to see where your highest-impact opportunity is.