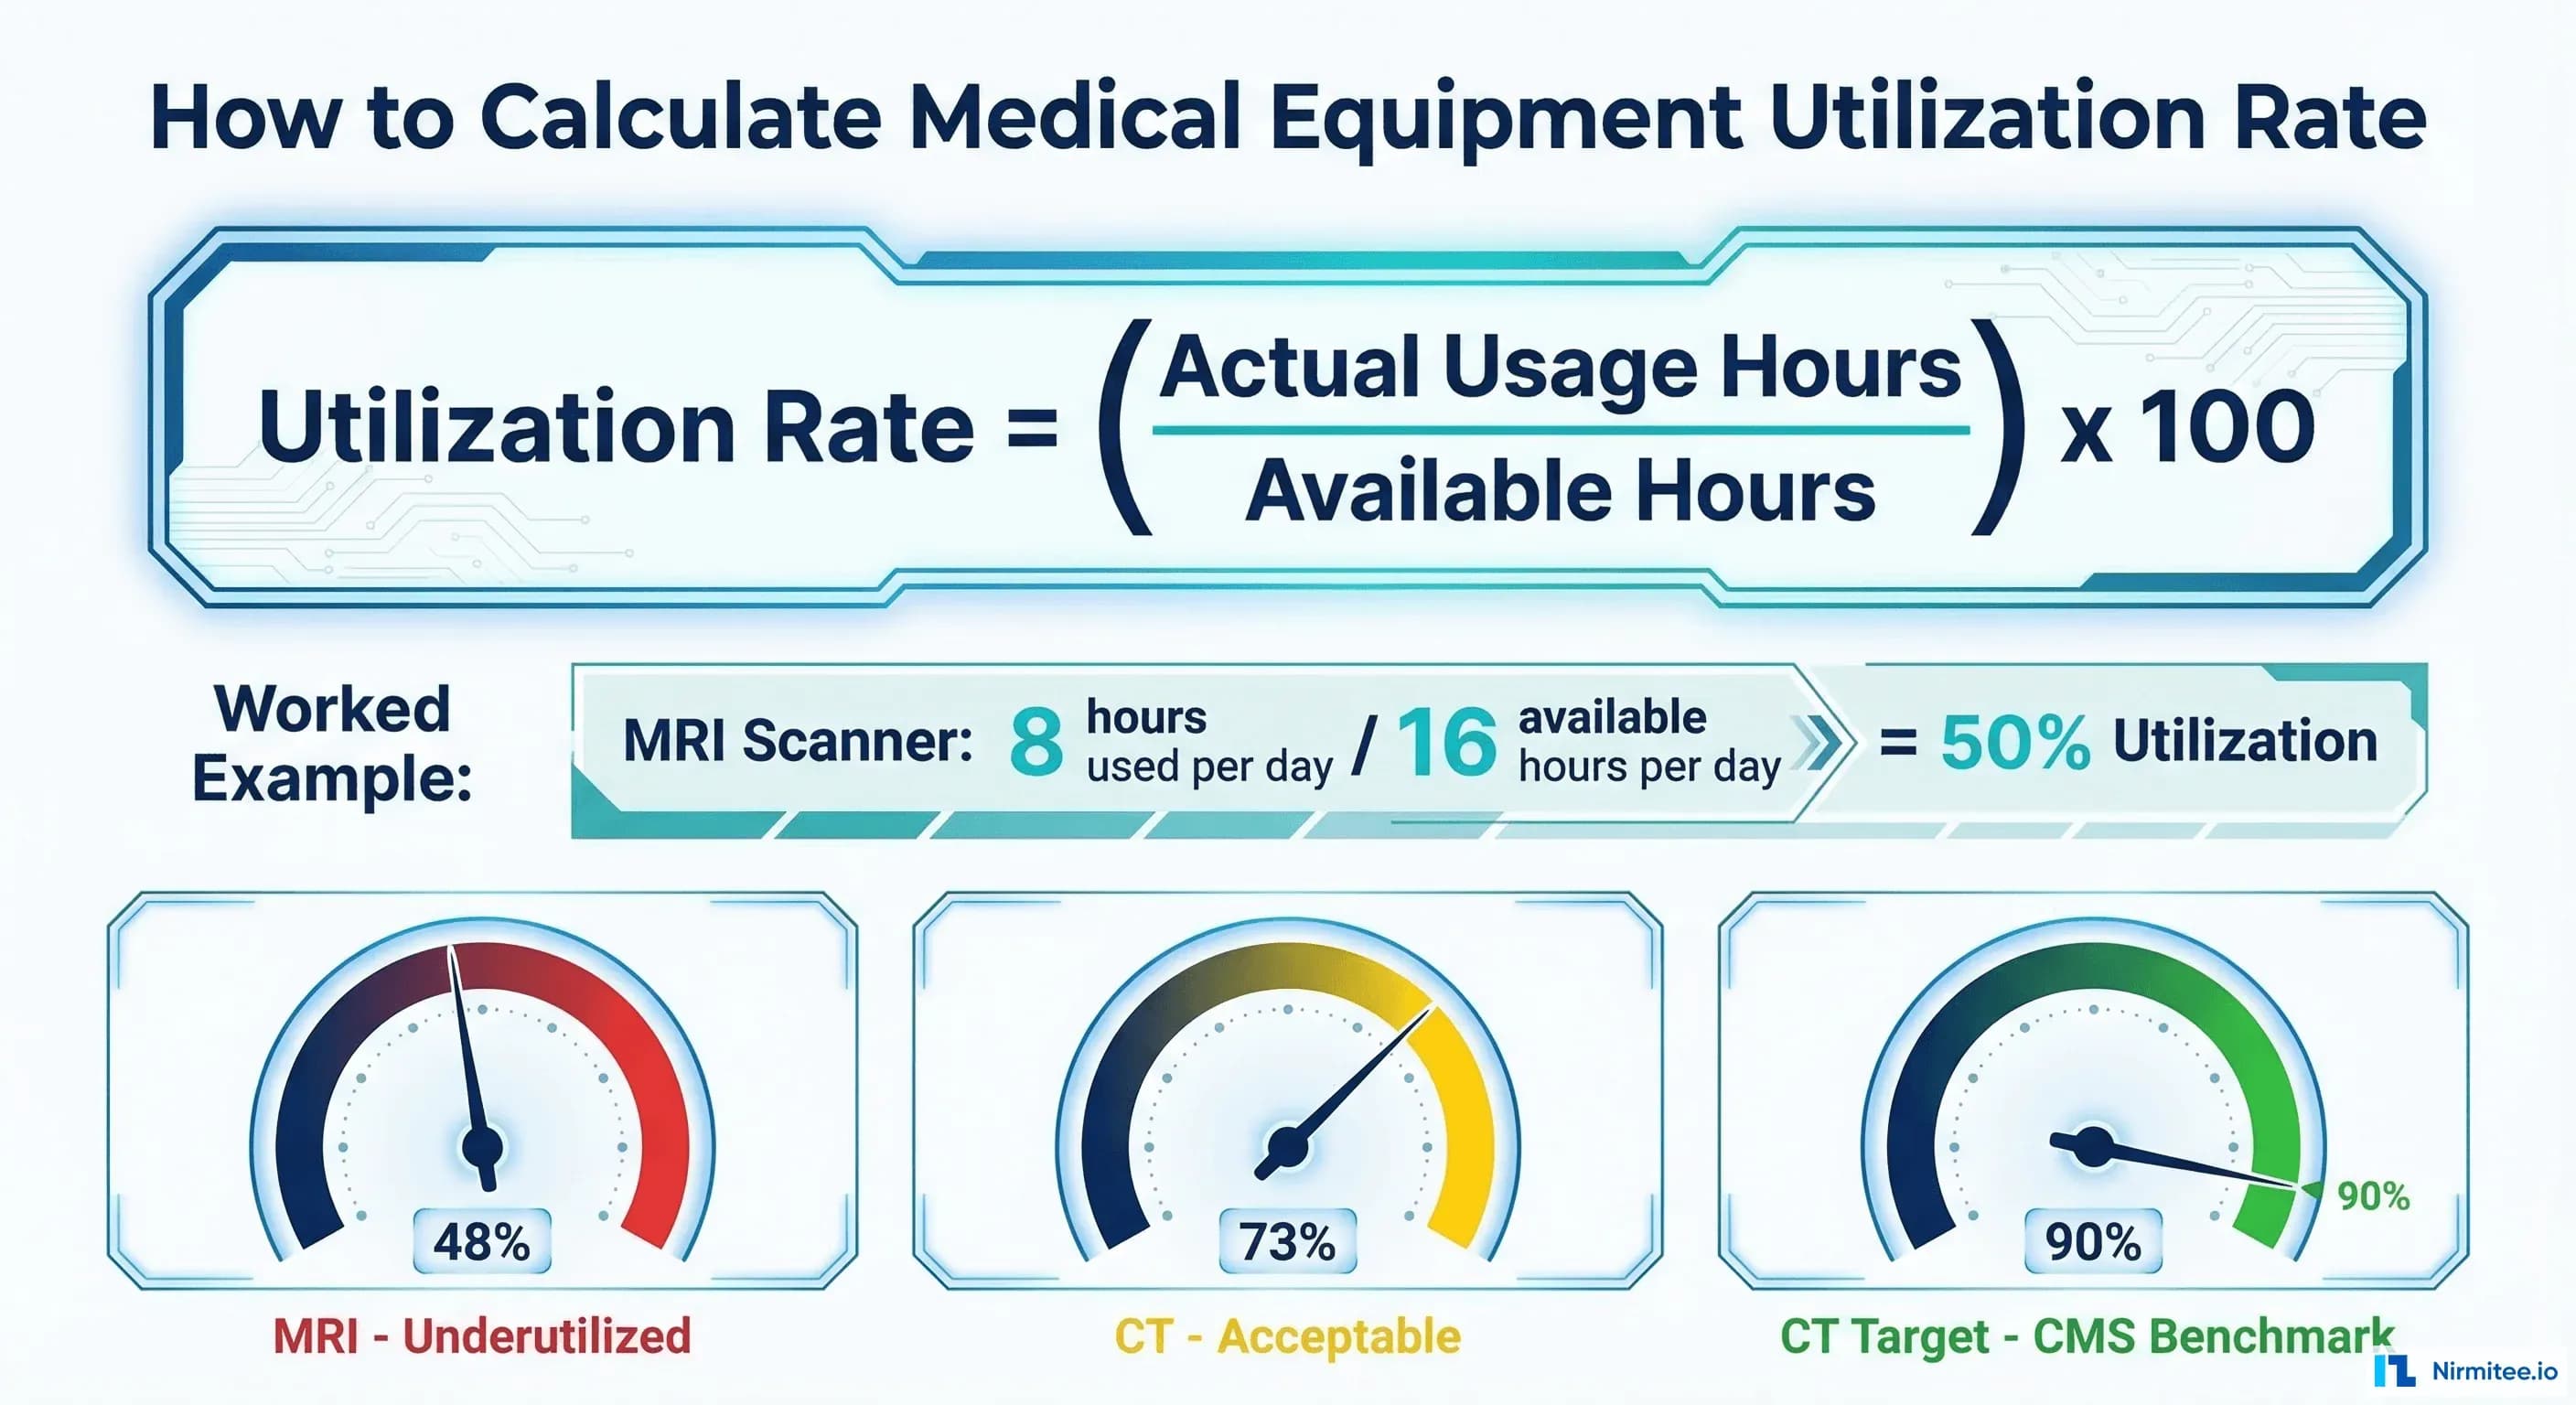
An MRI scanner costs Rs 5-15 crore to purchase. It costs Rs 1 crore per year to maintain, regardless of whether it scans 100 patients or 500. Yet a study from an Indian hospital found that MRI scanners operate at just 48% utilization, well below the 90% benchmark that CMS uses for reimbursement calculations in the United States (published research, Indian hospital radiology studies).
That gap between 48% and 90% is not an abstract number. For an MRI scanner, the break-even point is approximately 203 scans per month. The average Indian hospital MRI achieves 138 scans per month. Every month below break-even, the hospital is paying Rs 8-12 lakhs in fixed costs for a machine that is not generating enough revenue to cover itself.
Equipment utilization rate is the single most important metric that most hospital administrators do not track. This guide covers three calculation methods (from basic to comprehensive), benchmark data for every major equipment type, the financial impact of underutilization with real Indian hospital numbers, and the specific actions to take when your utilization numbers show a problem.
Three Methods to Calculate Equipment Utilization
There are three progressively more sophisticated ways to measure equipment utilization. Start with Method 1, graduate to Method 3 as your data infrastructure matures.
Method 1: Basic Utilization Rate (Start Here)
The simplest calculation that every hospital can implement immediately:
Utilization Rate (%) = (Actual Usage Hours / Maximum Available Hours) x 100

Example: CT Scanner
  Operating hours: 10 hours/day (8 AM to 6 PM)
  Available days: 26 days/month (excluding Sundays)
  Maximum available: 10 x 26 = 260 hours/month
  Actual scanning time: 190 hours/month
  Utilization Rate: (190 / 260) x 100 = 73.1%

Example: Ventilator in ICU
  Available: 24 hours/day x 30 days = 720 hours/month
  Actual patient use: 44.6 hours/month (6.2% utilization)
  Utilization Rate: (44.6 / 720) x 100 = 6.2%
How to collect the data:
- For imaging equipment: Pull scan counts from the PACS/RIS system. Multiply by average scan duration (MRI: 30-45 min, CT: 15-25 min, X-ray: 5-10 min, Ultrasound: 20-30 min)
- For ventilators and monitors: Log patient connection time. Most modern devices record operating hours internally. If not, use nursing documentation of device assignment times
- For OR equipment: Use the OR scheduling system. Operating time per case multiplied by number of cases
- For lab analyzers: Pull sample throughput from the LIS. Multiply by average processing time per sample
Method 2: Use Coefficient (WHO/Academic Standard)
The Use Coefficient (UC) is the WHO-recommended method for annual equipment utilization assessment, used in published research across hospitals in India, Ethiopia, and Southeast Asia (PMC9968427):
UC = (A x B) / (C x D) x 100

Where:
  A = Number of days equipment was actually used (in a 12-month period)
  B = Average number of hours used per working day
  C = Number of days equipment could have been available (excluding scheduled maintenance)
  D = Potential hours available per day (based on operating schedule)

Classification:
  UC >= 0.50 (50%) = Efficient utilization
  UC < 0.50 (50%) = Underutilized

Example: MRI Scanner (Indian Hospital)
  A = 280 days used in the year
  B = 6 hours average scanning per working day
  C = 305 days available (365 minus maintenance days and holidays)
  D = 12 hours potential per day (7 AM to 7 PM)
  UC = (280 x 6) / (305 x 12) x 100 = 1680 / 3660 x 100 = 45.9%
  Classification: Underutilized
The Ethiopian hospital study (PMC9968427) using this method found that only 57.8% of medical equipment was being utilized efficiently across the hospitals studied. Statistically significant factors affecting utilization included: preventive maintenance (chi-square: 91.54), trained operator availability (chi-square: 26.14), and spare parts availability (chi-square: 32.36).
Method 3: Overall Equipment Effectiveness (OEE)
Adapted from manufacturing (Lean/Six Sigma) for healthcare, OEE provides the most comprehensive picture by combining three factors:
OEE = Availability (A) x Performance (PE) x Quality (Q)

Availability (A):
  A = Uptime / Scheduled Time
  Uptime = Scheduled Time - Downtime (breakdowns + maintenance)
  Example: CT scheduled 260 hours/month, down 15 hours for repairs
  A = 245 / 260 = 94.2%

Performance (PE):
  PE = Actual Throughput / Maximum Throughput
  Maximum throughput = what the equipment CAN do at full speed
  Example: CT can do 25 scans/day, actually does 18
  PE = 18 / 25 = 72.0%

Quality (Q):
  Q = Acceptable Results / Total Results
  Example: 450 CT scans, 12 need repeats due to motion artifact or positioning
  Q = 438 / 450 = 97.3%

OEE = 0.942 x 0.720 x 0.973 = 0.660 = 66.0%

OEE Benchmarks:
  World-class manufacturing: 85%+
  Healthcare imaging equipment: 60-75% is typical
  Below 50%: Significant improvement needed
OEE is powerful because it separates the problem into three actionable components. If Availability is low, focus on reducing breakdowns and improving preventive maintenance. If Performance is low, investigate scheduling gaps and turnaround time. If Quality is low, look at technician training and patient preparation.
Benchmark Utilization Rates by Equipment Type
No single utilization target applies to all equipment. A ventilator at 6% utilization might be acceptable (it means your ICU is not constantly full), while an MRI at 48% is a financial problem. Here are the benchmarks from published research and industry standards:
Equipment Type       | Actual (India)  | Target/Benchmark    | Source
--------------------|-----------------|--------------------|--------------------------
MRI Scanner          | 48%             | 90% (CMS)          | Indian hospital study
CT Scanner           | 73%             | 90% (CMS)          | Indian hospital study
Ventilators          | 6.2%            | Variable by ICU     | Pak J Med Health Sci
Operating Rooms      | 62% (est.)      | 75% adjusted        | Plante Moran
Histopathology Equip | 60.2%           | 75%+                | PGIMER Chandigarh study
General Equipment    | 57.8% efficient | 50%+ (WHO standard) | PMC9968427 (Ethiopia)
Hospital Beds        | 65-75%          | 80-85%              | Industry benchmark
Lab Analyzers        | 60-70%          | 75-80%              | Industry benchmark
Ultrasound           | 50-60%          | 70-75%              | Industry estimate
X-Ray                | 60-70%          | 80%                 | Industry benchmark
India-Specific Utilization Data
- MRI break-even analysis (NE India hospital): Break-even at 203 scans/month; actual average: 138 scans/month. Revenue shortfall: approximately Rs 6-8 lakhs/month
- CT utilization (same study): Break-even at 308 scans/month; actual average: 550 scans/month. The CT scanner was profitable and overperforming
- Ventilator utilization (Indian public hospital): Average 6.2%, range 3.3-12.1%. This reflects ICU bed availability and patient mix rather than equipment problems
- PGIMER Chandigarh (histopathology): 60.2% utilization. Factors: restricted working hours, limited trained manpower, equipment obsolescence
- BMMP program: 13-34% of equipment found dysfunctional across Indian states before intervention, meaning utilization was zero for a significant portion of the equipment fleet
The Financial Impact of Underutilization
Fixed Costs That Run Whether You Use Equipment or Not
Medical equipment has high fixed costs that accrue regardless of utilization:
Equipment         | Annual Maintenance | Depreciation/Year | Total Fixed Cost/Year
-----------------|-------------------|-------------------|---------------------
MRI Scanner       | Rs 80L - 1.2 Cr   | Rs 50L - 1 Cr     | Rs 1.3 - 2.2 Cr
CT Scanner        | Rs 60L - 93L      | Rs 40L - 80L      | Rs 1.0 - 1.73 Cr
C-Arm             | Rs 8L - 15L       | Rs 10L - 20L      | Rs 18 - 35L
Ultrasound        | Rs 3L - 8L        | Rs 5L - 10L       | Rs 8 - 18L
Ventilator        | Rs 50K - 1.5L     | Rs 80K - 2L       | Rs 1.3 - 3.5L
Patient Monitor   | Rs 20K - 50K      | Rs 30K - 80K      | Rs 50K - 1.3L

OEM Maintenance Contracts: 10-15% of original equipment cost annually
(Source: Industry benchmark, AAMI data)
The US healthcare industry loses approximately $3 billion annually from idle equipment (GE Healthcare, MedTech Europe, HFMA). Equipment downtime costs up to $760 per device per day. For Indian hospitals, scaling these numbers to the domestic context: a large hospital group with Rs 200 crore in medical equipment operating at 50% utilization instead of 75% is effectively wasting Rs 8-12 crore annually in idle capacity.
Revenue Impact of Underutilization
For revenue-generating equipment like imaging devices:
MRI Revenue Calculation:
  Revenue per scan (average): Rs 5,000 - 12,000
  Break-even scans/month: 203 (at Rs 7,000 average revenue)
  Each additional scan beyond break-even = Rs 5,500-6,000 marginal profit (after consumables)

  At 48% utilization (138 scans/month): Rs 9.66L revenue, below break-even
  At 70% utilization (200 scans/month): Rs 14.0L revenue, near break-even
  At 90% utilization (258 scans/month): Rs 18.06L revenue, Rs 3.2L monthly profit

  Gap between 48% and 90% = Rs 8.4L/month = Rs 1.0 Cr/year per scanner
How to Collect Utilization Data: Practical Methods
Method A: Manual Logbook (Minimum Viable)
Place a logbook next to the equipment. Staff record the start time, end time, and patient ID (or procedure type) for each use. Calculate utilization weekly by summing actual hours and dividing by available hours. This is labor-intensive but requires zero technology investment.
Limitations: Staff compliance drops over time, data entry errors are common, and retrospective analysis requires manual aggregation.
Method B: EHR/RIS/LIS Data (Recommended)
Extract utilization data from systems that already track equipment use:
- Imaging: PACS/RIS logs every study with timestamps. Pull monthly scan counts by modality
- Laboratory: LIS records sample processing times and throughput per analyzer
- OR: Scheduling system records actual start/end times for each case and the equipment used
- ICU: Nursing documentation or device integration records ventilator/monitor connection times
This approach uses existing data with no additional staff effort. The challenge is extracting and aggregating data across multiple systems, which is where equipment tracking software with integration capabilities proves its value.
Method C: IoT/Device Integration (Advanced)
Modern medical devices can report their operating status in real time. Connected devices transmit power-on/off, active use, idle, and error states to a central monitoring platform. This provides the most accurate utilization data with zero manual effort.
GE HealthCare's OnWatch system and similar IoT platforms collect operating data continuously and flag underutilization patterns automatically. The infrastructure cost is high (IoT gateway installation, network configuration, monitoring software), but for high-value equipment like MRI and CT, the precision justifies the investment.
What To Do When Utilization Is Low
Calculating utilization is only useful if it drives action. Here is the decision framework:
Problem: Limited Operating Hours
Action: Extend to two-shift or three-shift operation. An MRI running 8 hours/day at 90% utilization generates Rs 1.8 crore less revenue per year than an MRI running 16 hours/day at 70% utilization. The marginal cost of the second shift (technician salary, power) is a fraction of the additional revenue.
PGIMER Chandigarh study finding: "Restricted availability / limited working hours" was identified as a primary factor in equipment underutilization at the institute.
Problem: Staff Shortages or Skill Gaps
Action: Cross-train operators. If only one radiologist can operate the MRI, utilization drops every time they are on leave. Train two additional radiologists and ensure technician coverage for all operating shifts. The Ethiopian study (PMC9968427) found that "trained operator availability" had a statistically significant impact on utilization (chi-square: 26.14, p=0.00).
Problem: Scheduling Inefficiency
Action: Implement online scheduling with optimized slot allocation. Common inefficiencies include: 60-minute MRI slots when the average scan takes 35 minutes, no-show patients without backfill protocols, and long turnaround times between patients (positioning, cleaning, preparation). Reducing MRI changeover time from 20 minutes to 10 minutes adds one additional scan per shift.
Problem: Equipment Downtime
Action: Strengthen the preventive maintenance program. The Ethiopian study found preventive maintenance was the strongest predictor of utilization (chi-square: 91.54, p=0.00). Every hour of unplanned downtime on an MRI costs Rs 8,000-15,000 in lost revenue.
Problem: Genuine Over-Procurement
Action: Consider equipment sharing arrangements with nearby hospitals, lease-back programs, or scheduled utilization of excess capacity for community health screening programs. If a hospital has three ultrasound machines and the combined utilization is 40%, it may need only two, with the third redeployed to a facility that needs it.
Building a Utilization Dashboard
Track these KPIs monthly at minimum, weekly for high-value equipment:
Dashboard Metrics (by equipment, by department, by facility):

1. Utilization Rate (%)
   - Current month vs previous month vs same month last year
   - Trend line (is utilization improving or declining?)

2. Revenue per Equipment Hour
   - For revenue-generating equipment only
   - Actual vs break-even threshold

3. Downtime Hours
   - Planned (PM) vs Unplanned (breakdowns)
   - Unplanned downtime trend (should decrease over time)

4. Scans/Procedures per Day
   - For imaging and procedure equipment
   - Actual vs capacity vs target

5. Cost per Procedure
   - Total operating cost / number of procedures
   - Should decrease as utilization increases (fixed cost spread)

6. Equipment Age vs Utilization
   - Scatter plot showing whether older equipment has lower utilization
   - Identifies equipment approaching replacement decision

Alert Thresholds:
  - Utilization drops below 50% for 2 consecutive weeks: Yellow alert
  - Utilization drops below 30% for 1 week: Red alert
  - Unplanned downtime exceeds 10% of available hours: Red alert
  - Revenue-generating equipment below break-even for 1 month: Escalate to CFO
Need a custom-built healthcare solution? Our Custom Healthcare Software Development team delivers end-to-end, from requirements to production.
The Bottom Line
Equipment utilization is not a facility's metric. It is a financial metric. An MRI at 48% utilization is a Rs 1 crore per year problem. A ventilator fleet at 6% utilization raises questions about capacity planning. An OR running at 62% while surgeons complain about scheduling is an operational leadership problem.
Start measuring. Use Method 1 (basic utilization rate) for everything, today. Pull the data from your RIS, LIS, and OR scheduling system. Build a spreadsheet if you have to. The numbers will tell a story that most hospital administrators have never seen clearly, and the story almost always points to specific, actionable improvements that pay for themselves within months.
The hospitals that track their equipment systematically are the ones that know exactly where every rupee of their capital investment is working, and where it is sitting idle. In a healthcare market growing at 17.5% annually (IBEF), the hospitals that optimize utilization will outcompete those that keep buying equipment they do not fully use.