The Explainability Imperative in Clinical AI
A machine learning model predicts that a patient has a 73% risk of readmission within 30 days. The hospitalist reviewing this score has one question: why? Not "what is the mathematical basis for this prediction" — but "what about this patient makes the model concerned, and does that concern align with my clinical judgment?"
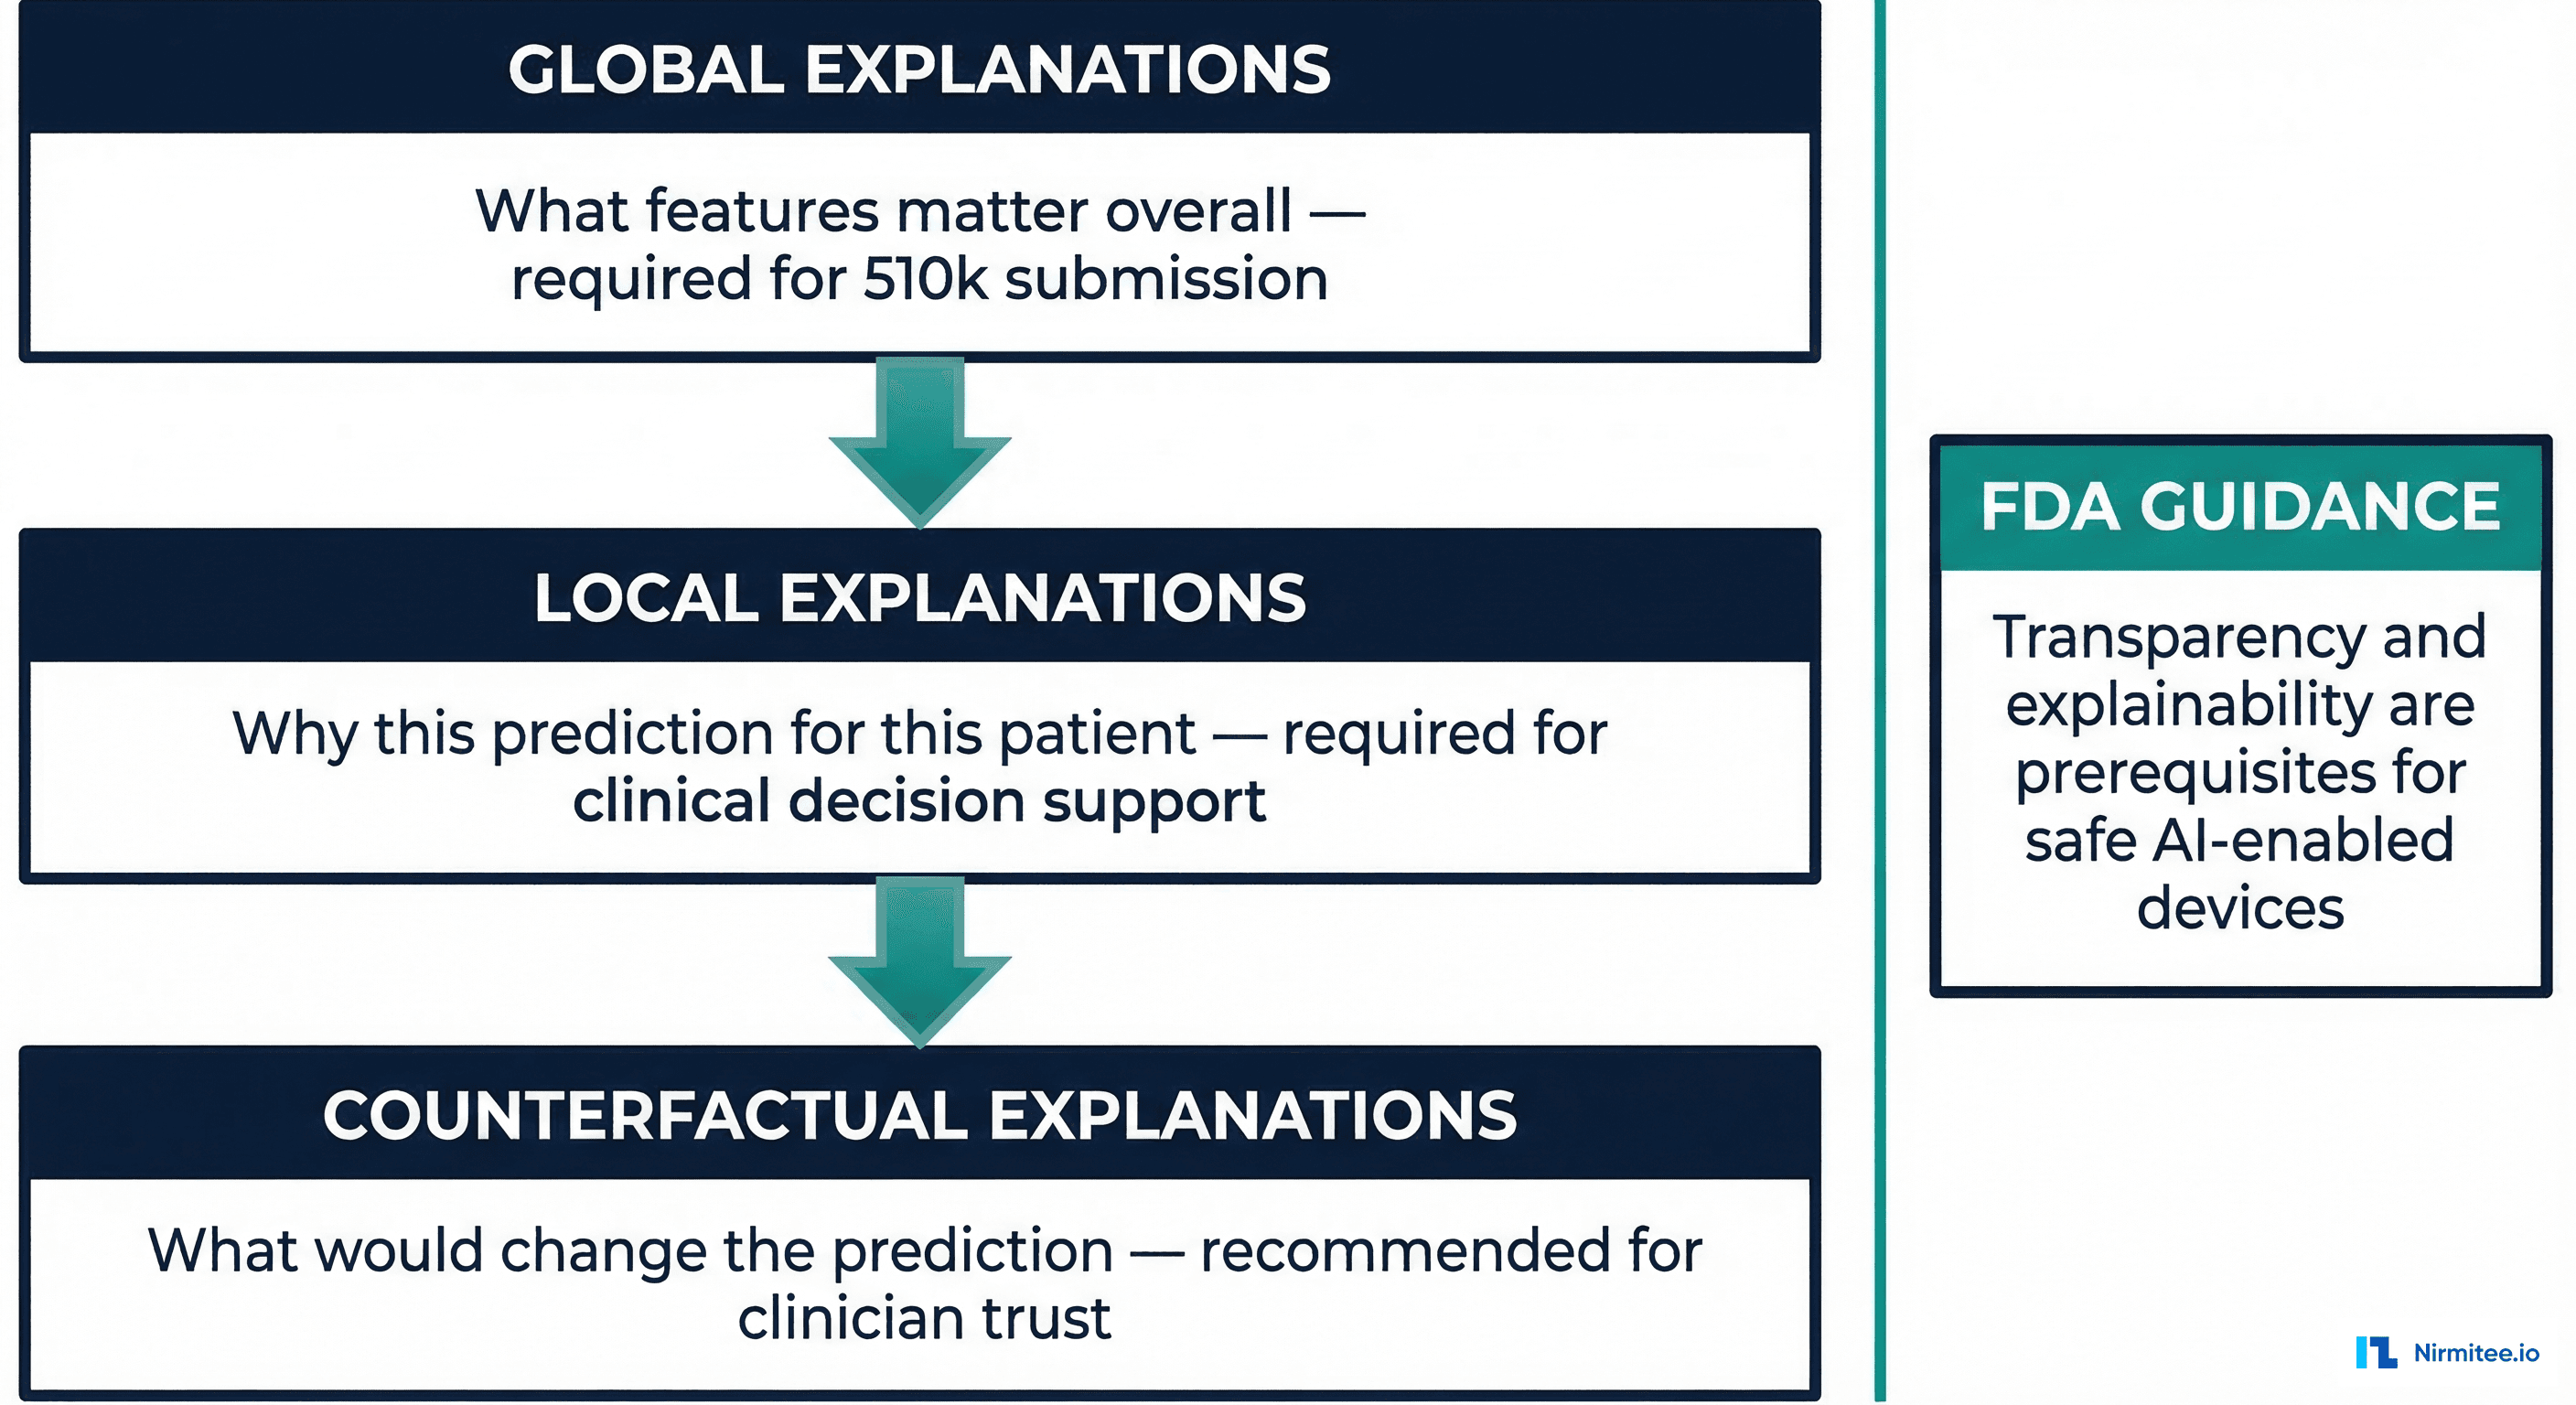
This question is not just about user experience. The FDA's 2021 Action Plan for AI/ML-Based Software as a Medical Device explicitly calls for transparency and explainability as prerequisites for safe AI-enabled devices. The European Union's AI Act classifies clinical AI as high-risk, requiring that users can interpret and appropriately use AI system outputs. And from a practical standpoint, clinicians will not act on predictions they do not understand — a model that cannot explain itself is a model that will be ignored.
The problem is that most explainable AI (XAI) tools were built for data scientists, not clinicians. SHAP waterfall plots, LIME perturbation analyses, and attention heatmaps are powerful analytical tools — but they speak the language of feature importance scores and probability distributions, not clinical reasoning. The gap between XAI output and clinical understanding is where most healthcare AI deployments fail to deliver value.
This article covers the major XAI methods, their strengths and limitations for clinical applications, and the critical missing piece: a clinical explanation layer that translates machine-learning explanations into the language clinicians use to make decisions.
SHAP: The Gold Standard for Feature Importance
SHAP (SHapley Additive exPlanations) is rooted in cooperative game theory. It assigns each feature a value representing its contribution to the prediction, with a mathematical guarantee that the contributions sum to the difference between the model's prediction and the baseline (average) prediction.
For clinical models, SHAP provides two types of explanations:
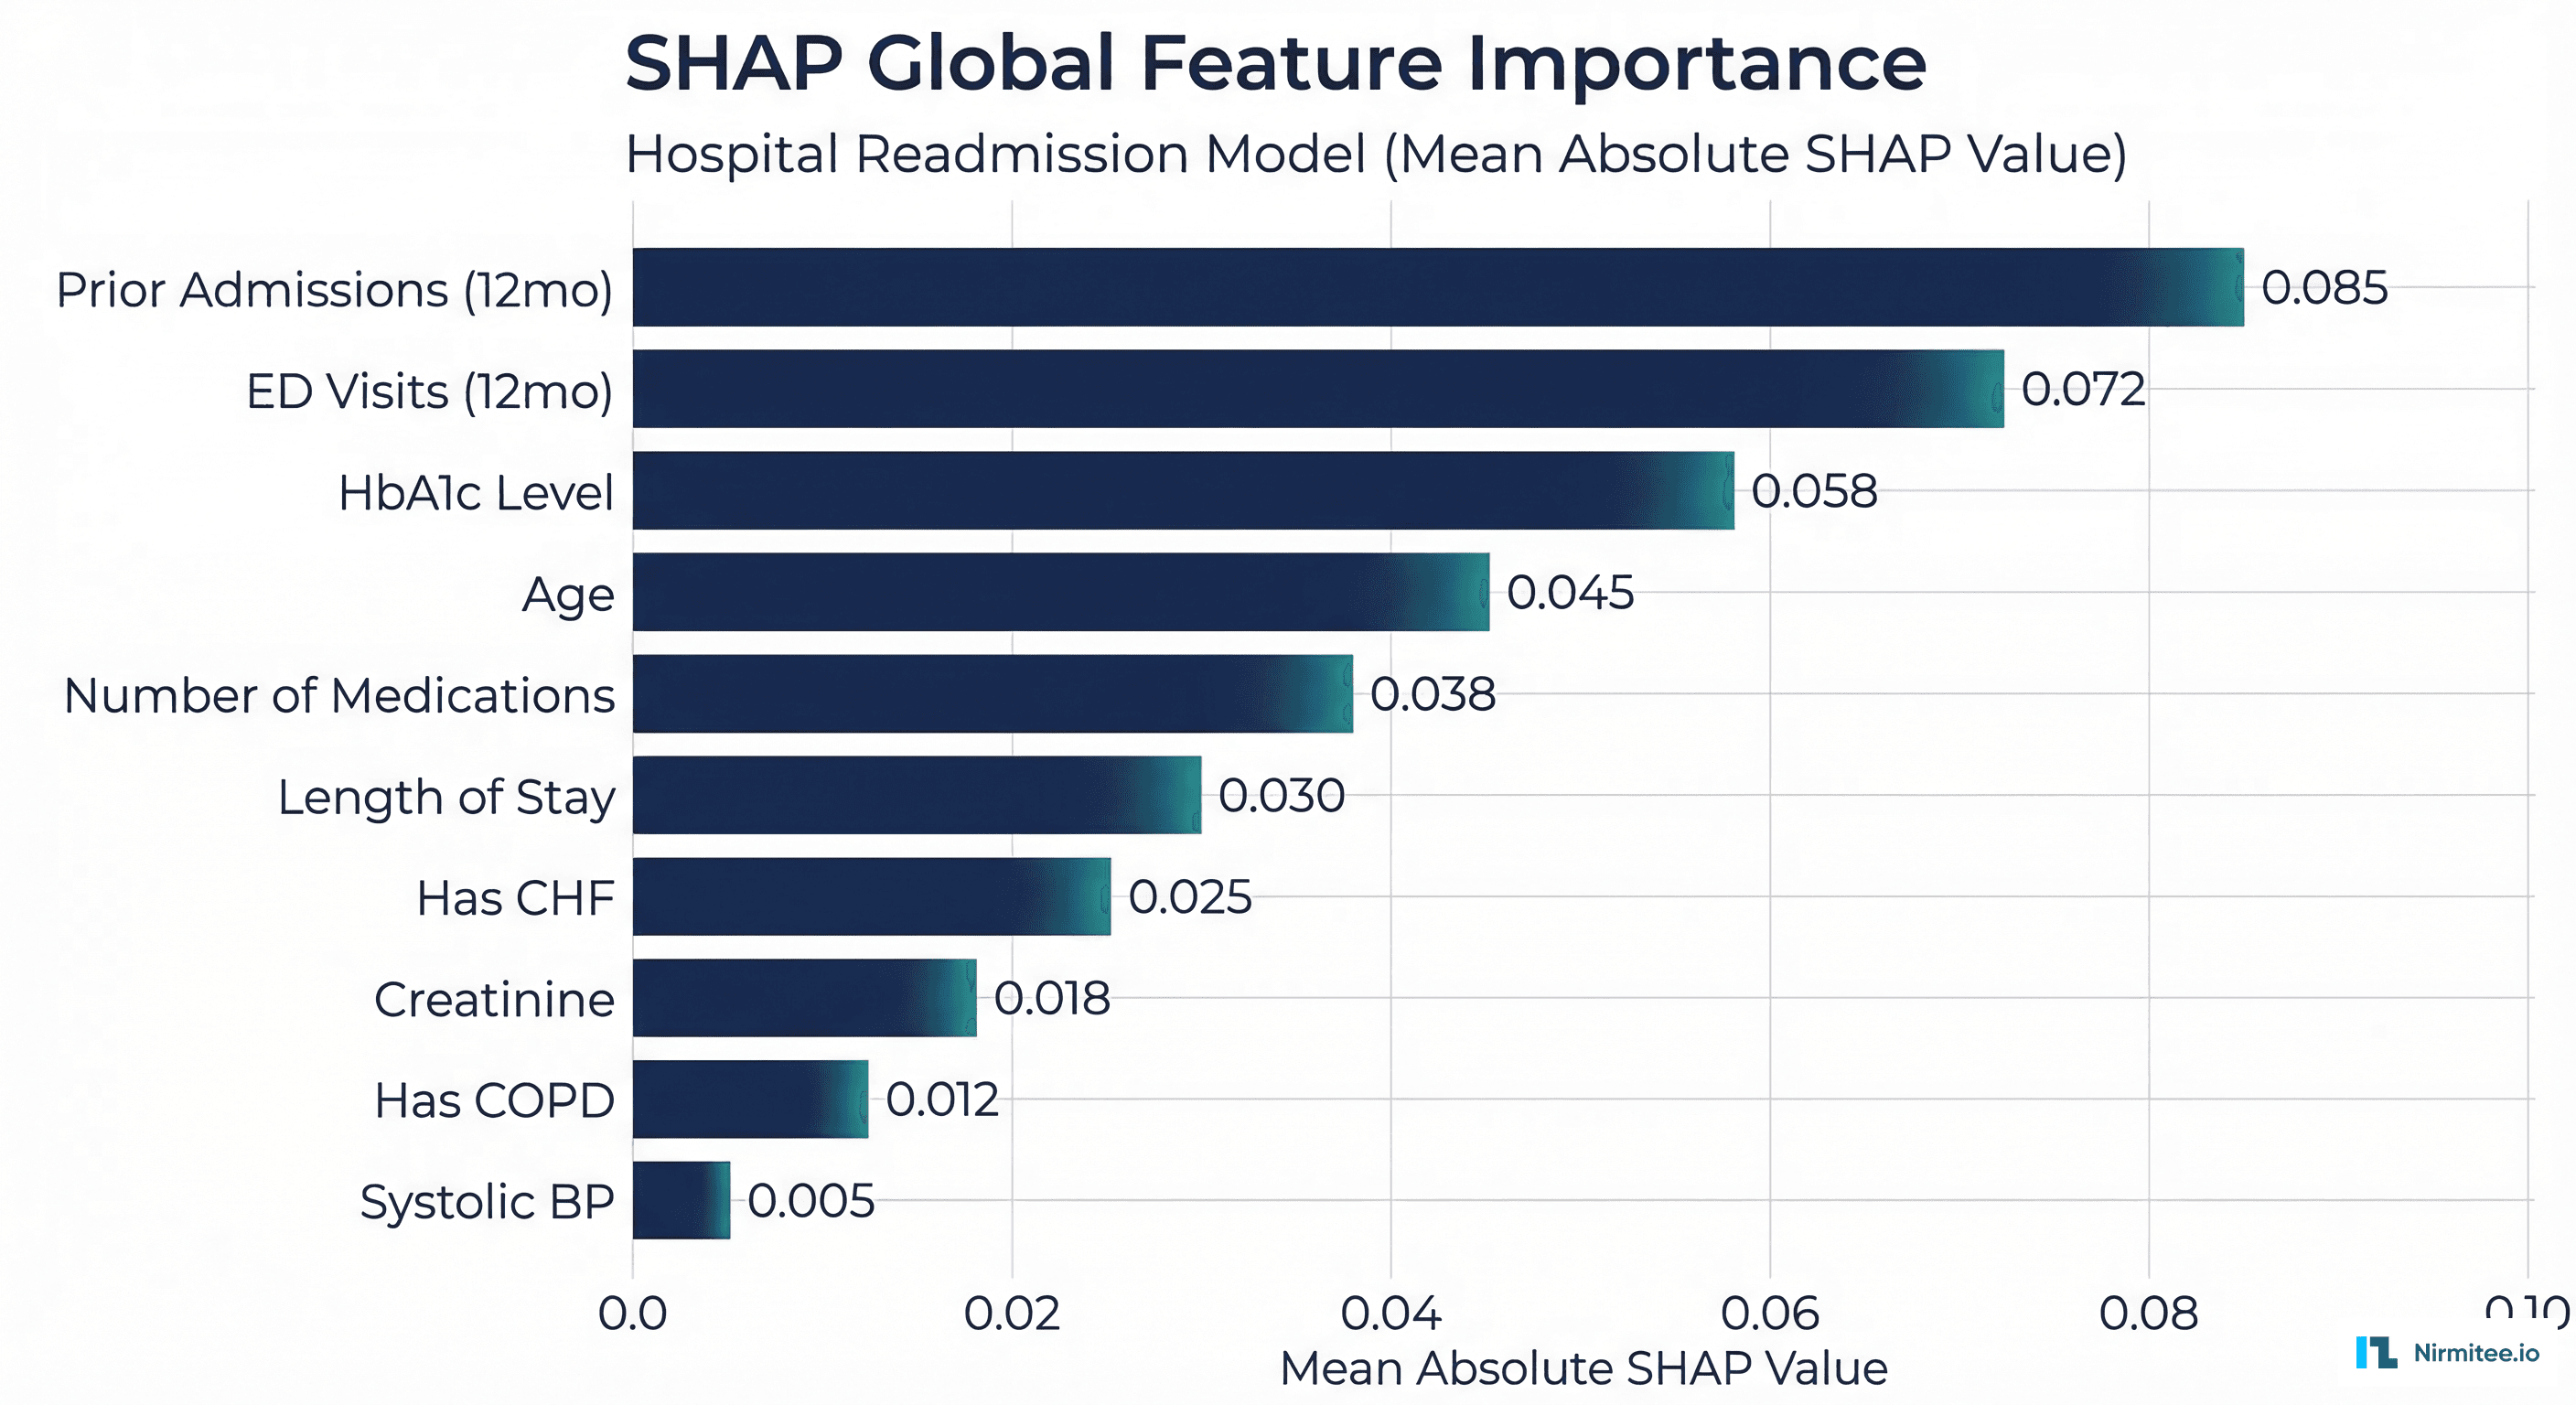
Global Explanations: What Features Matter Overall
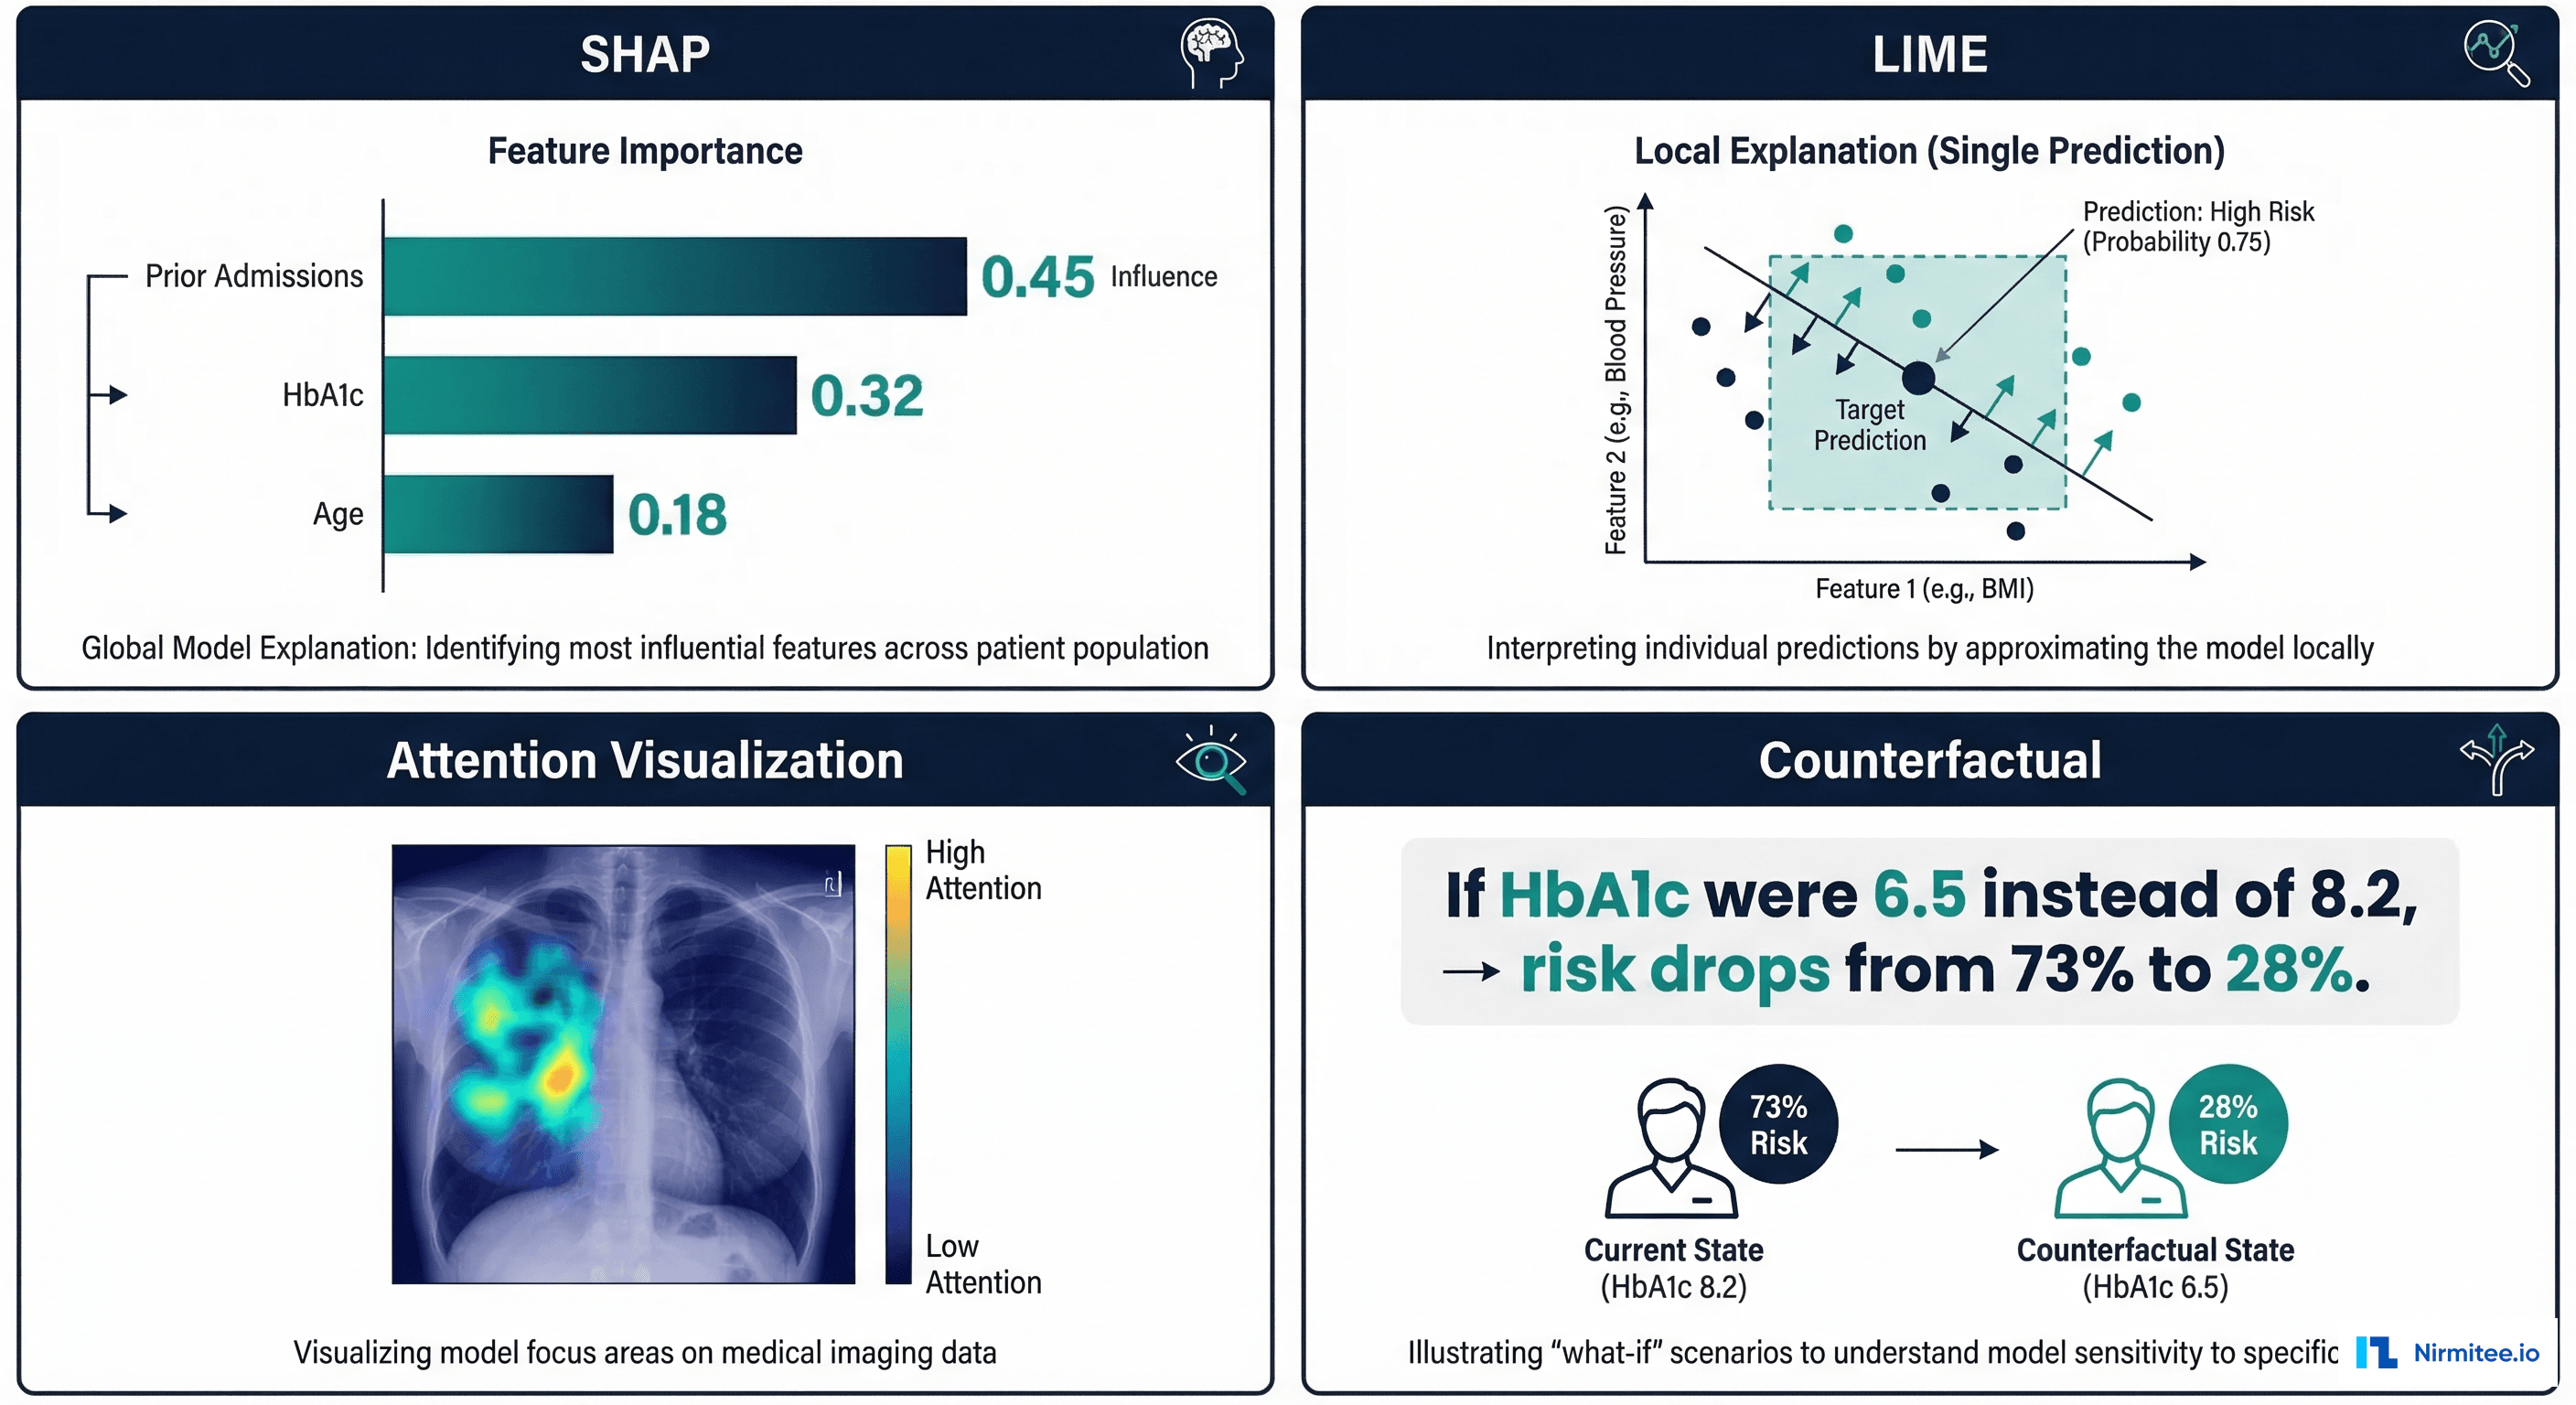
A SHAP summary plot shows which features have the strongest influence on model predictions across the entire patient population. For a readmission prediction model, this might reveal that prior admissions in the past 12 months, HbA1c level, and number of medications are the three most important predictors globally.
Global explanations serve regulatory and governance purposes: they allow clinical leadership to verify that the model uses clinically relevant features (not data artifacts), and they are required components of FDA submissions for AI/ML-based SaMD.
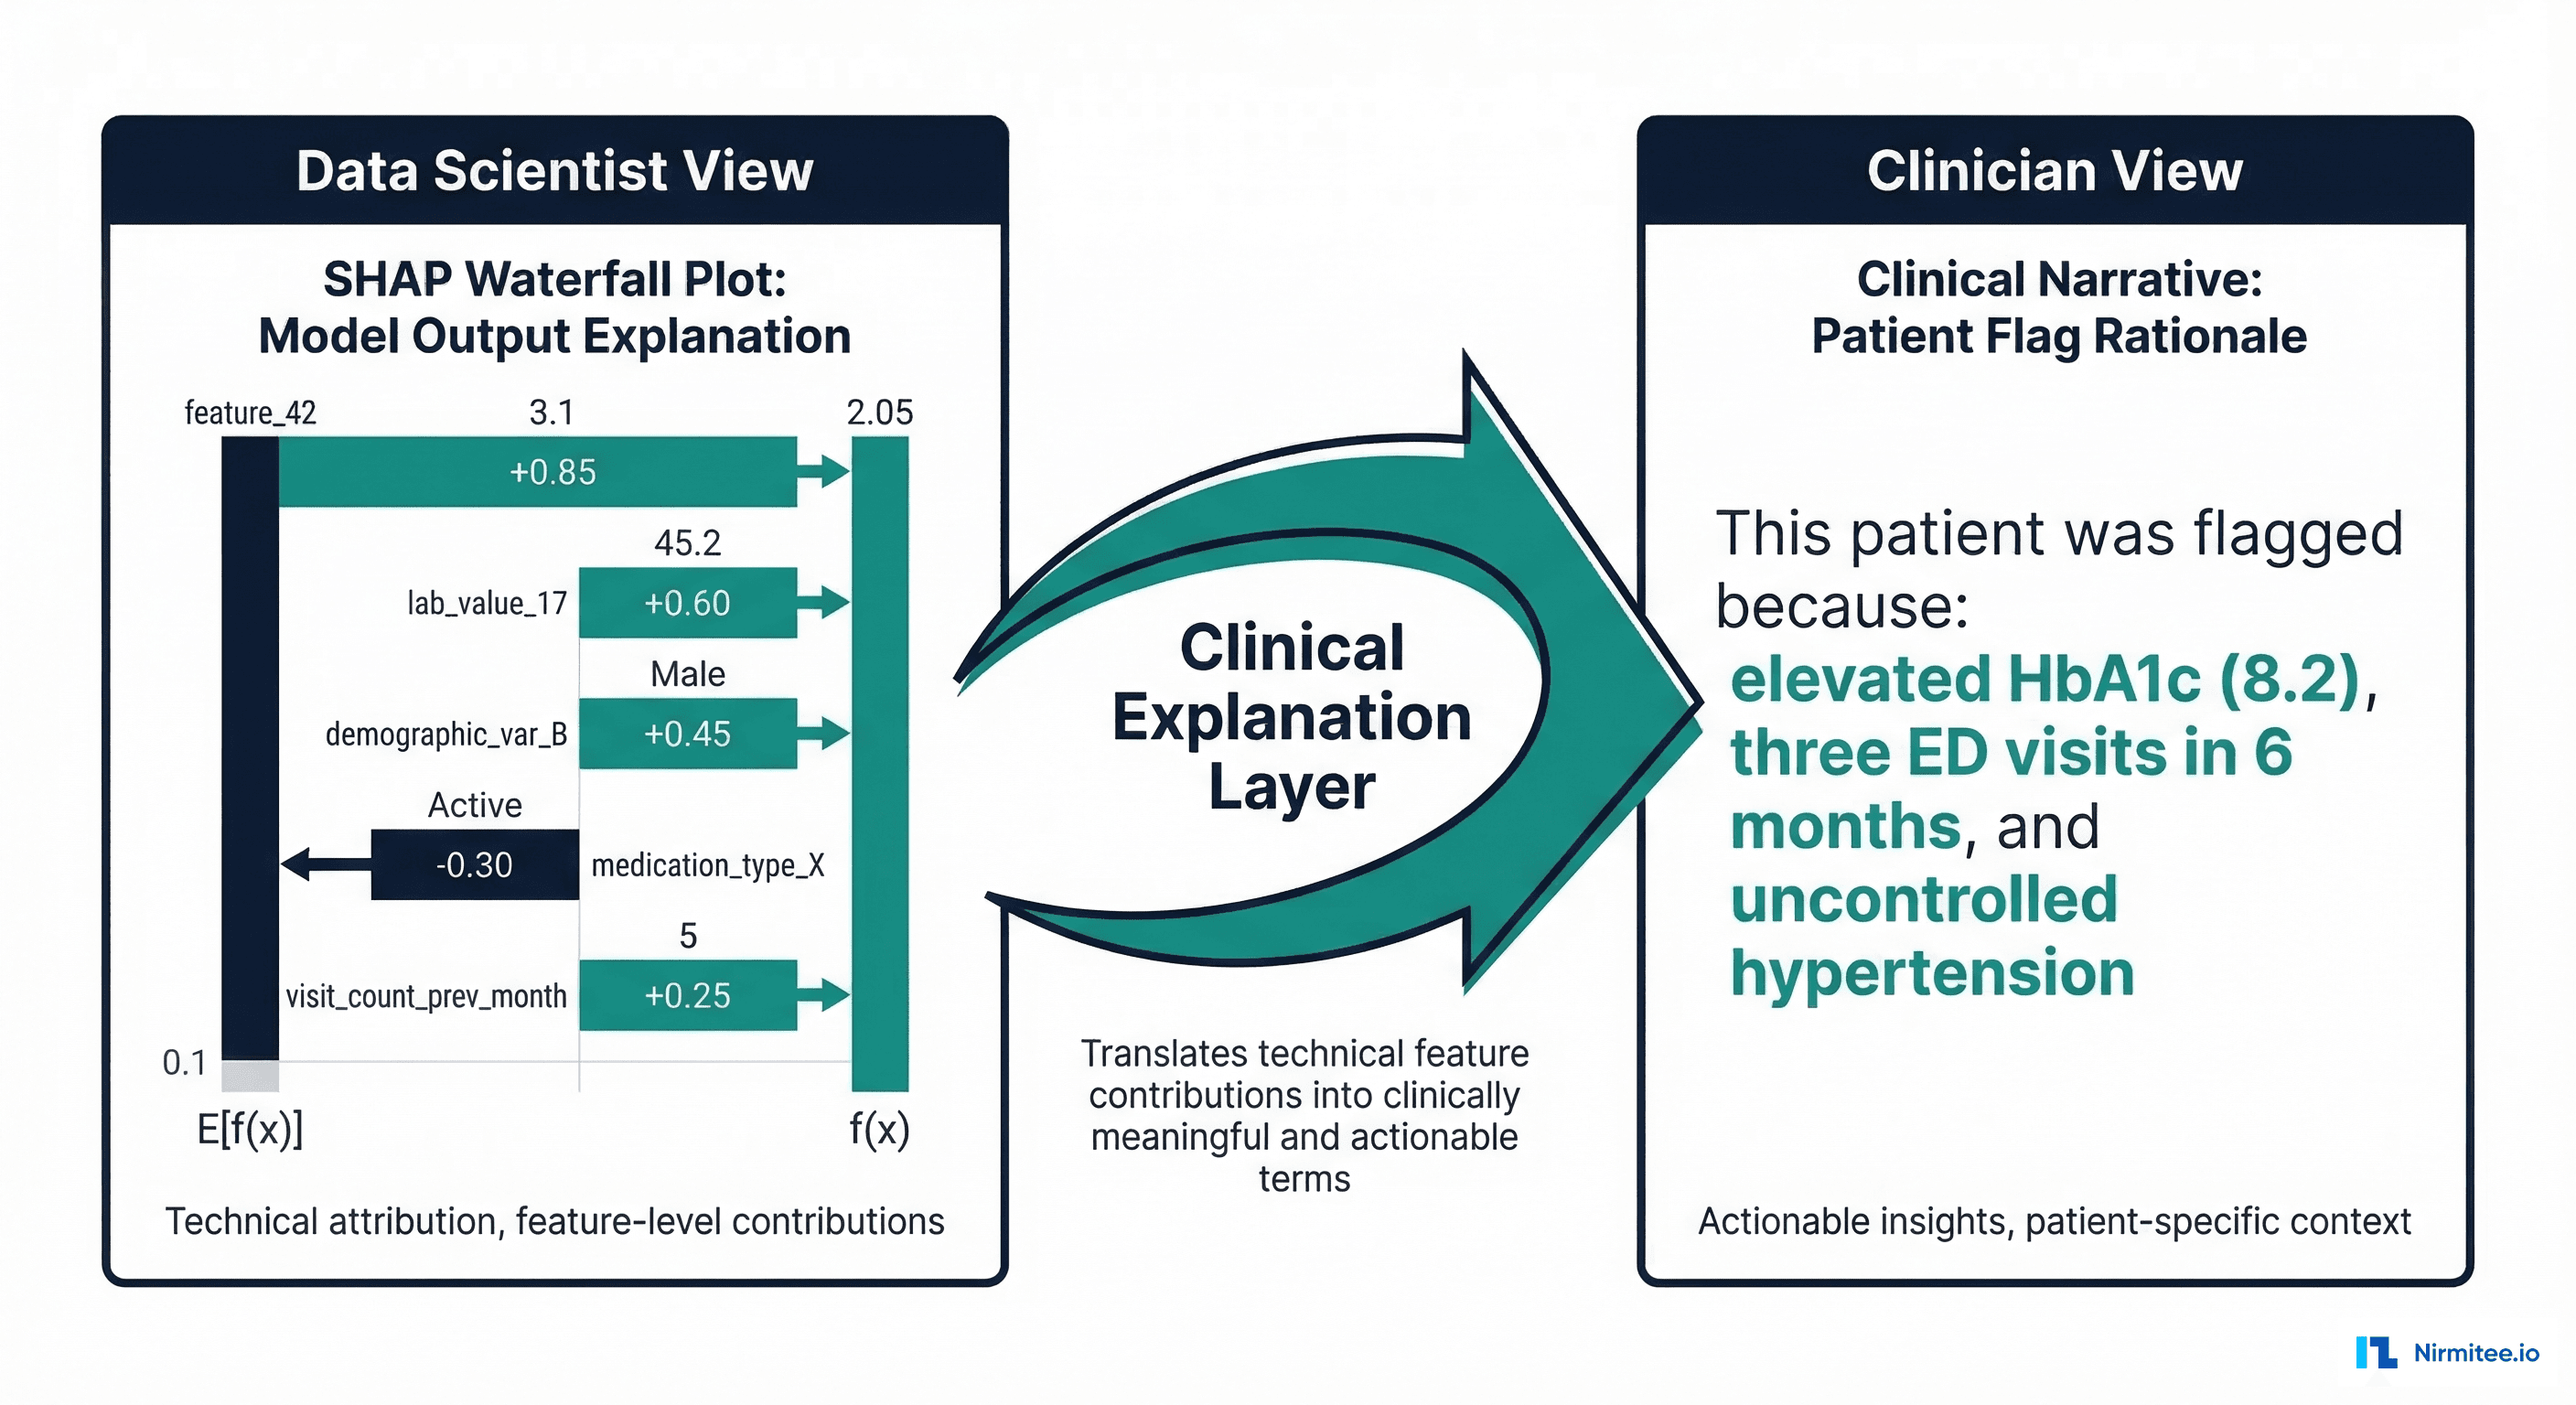
Local Explanations: Why This Patient
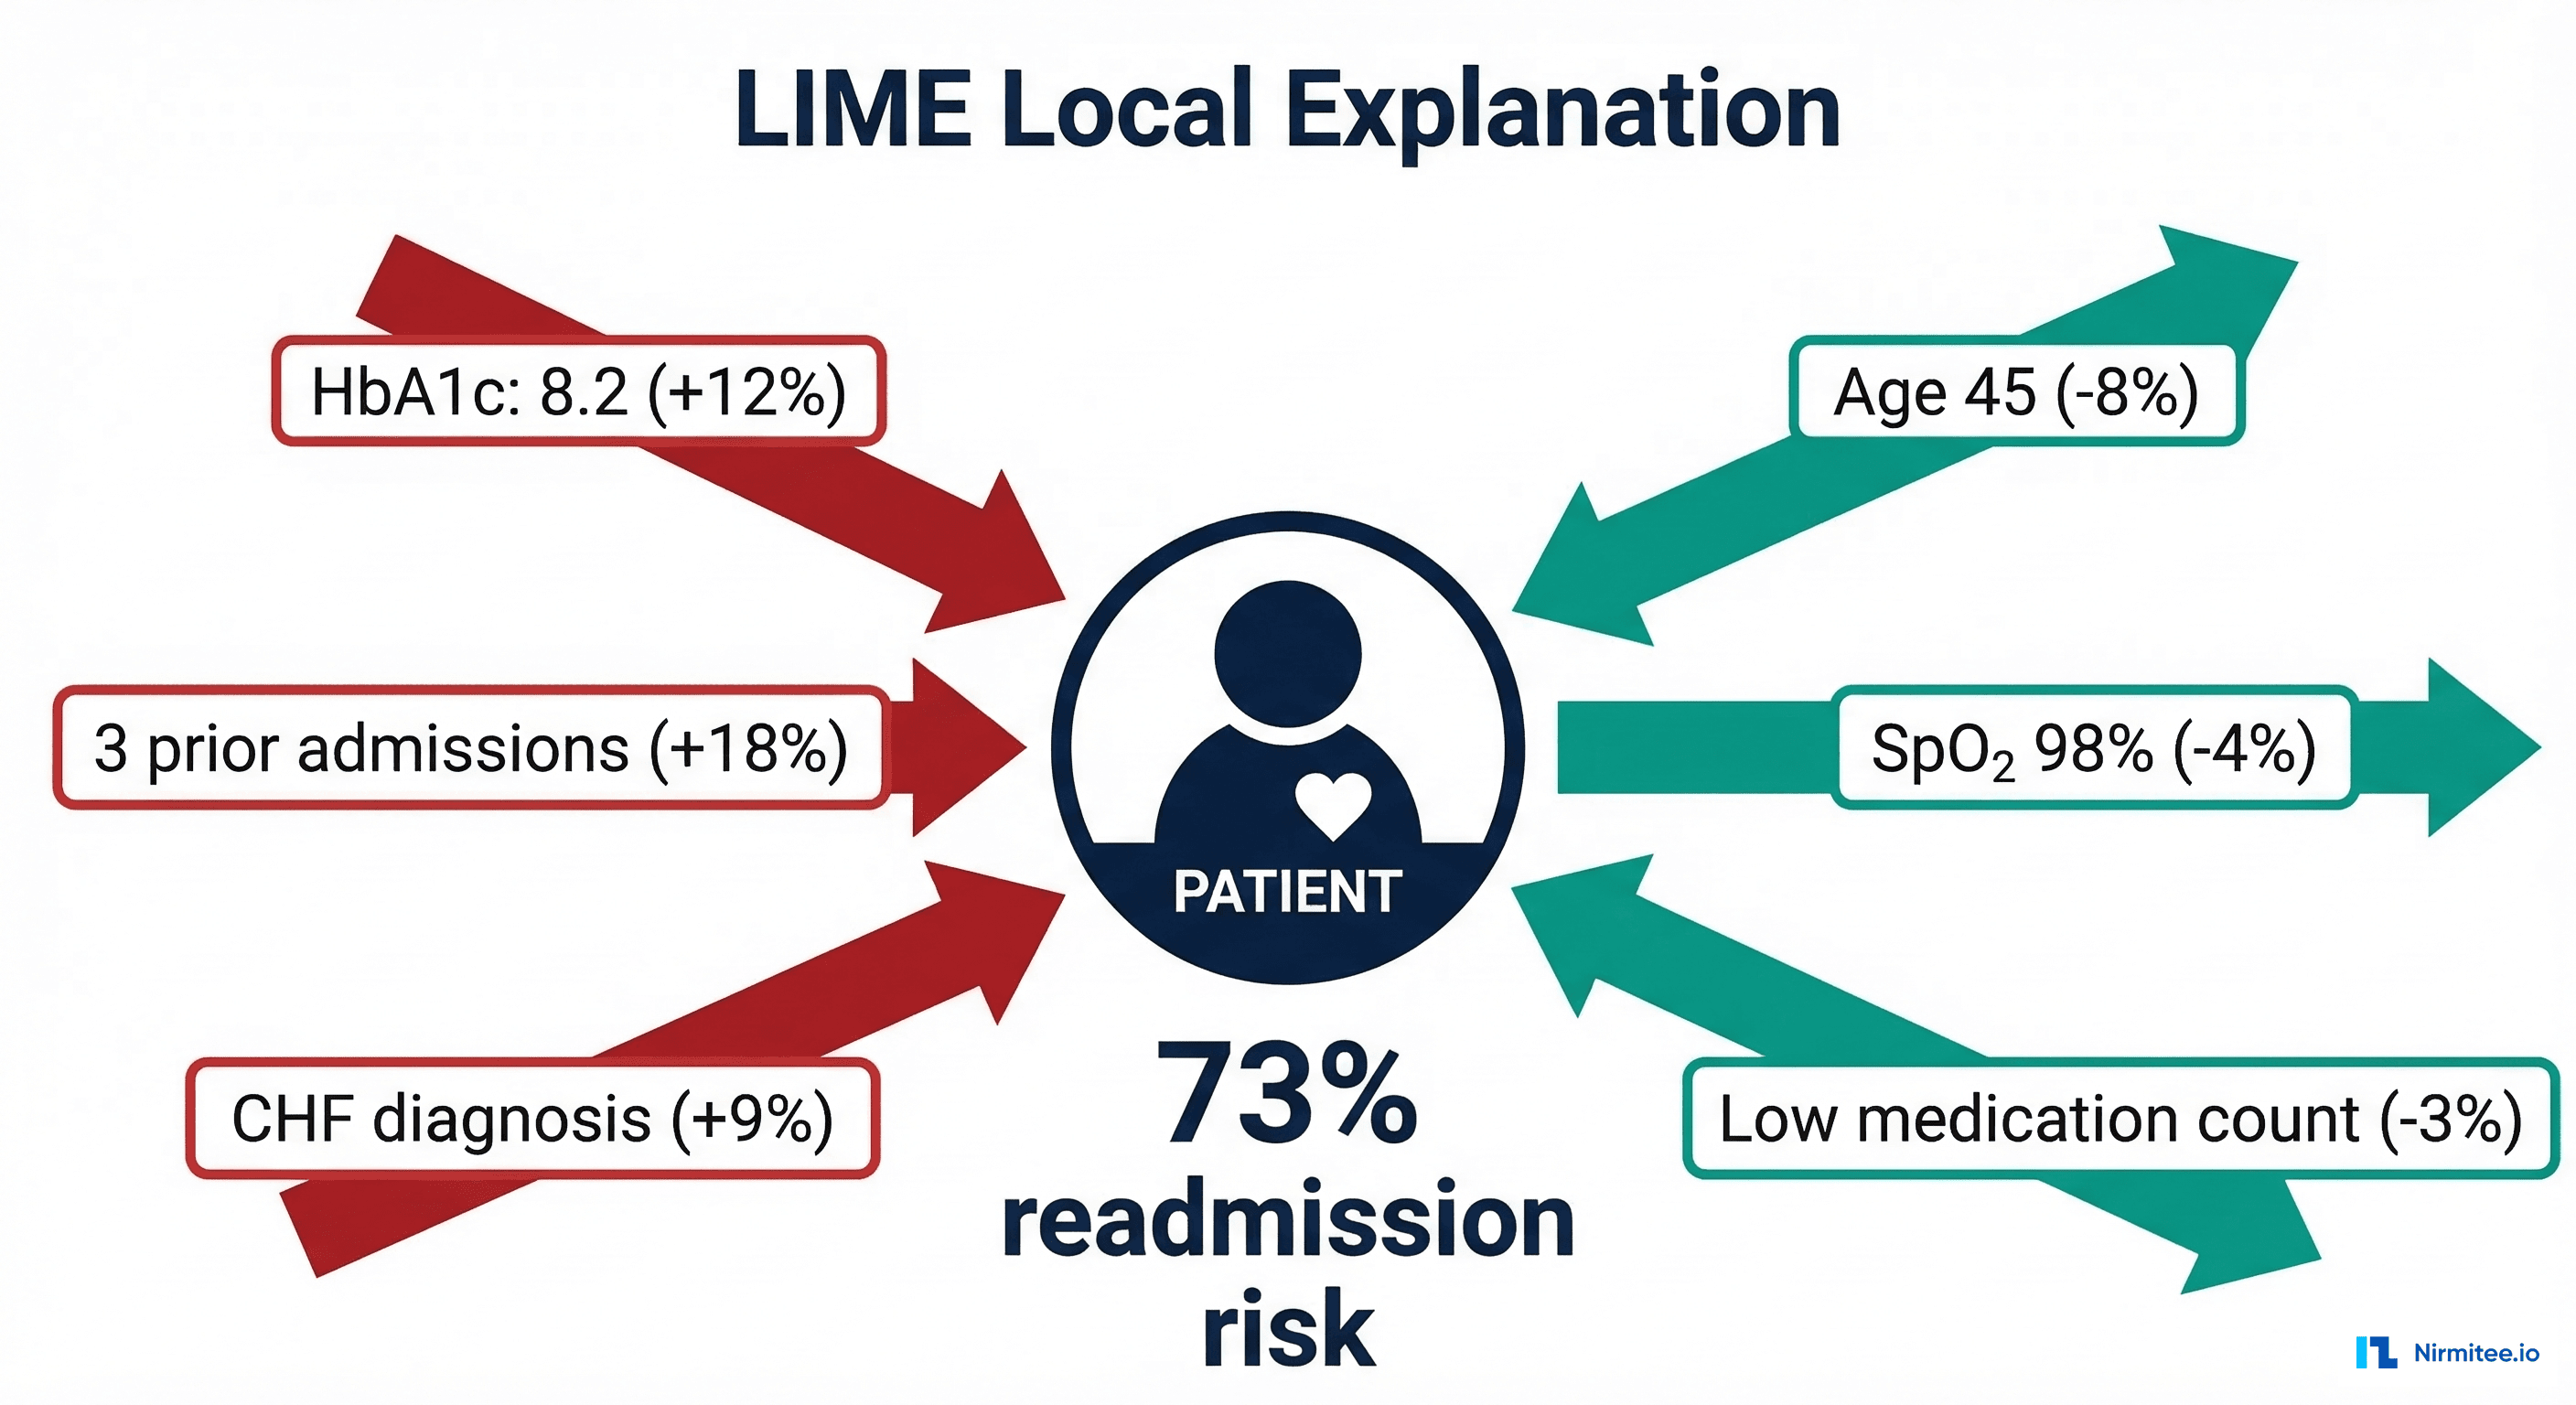
A SHAP force plot or waterfall plot shows how each feature contributed to a specific patient's prediction. For patient John D. with a 73% readmission risk, SHAP might show: prior admissions (+18%), HbA1c 8.2 (+12%), CHF diagnosis (+9%), while age 45 (-8%) and good SpO2 (-4%) decrease the risk.
SHAP Implementation for a Readmission Model
# xai_shap_clinical.py — SHAP Explanations for Clinical Readmission Model
import shap
import numpy as np
import pandas as pd
from typing import Dict, List, Tuple


class ClinicalSHAPExplainer:
    """SHAP-based explainer with clinical translation layer."""

    def __init__(self, model, training_data: pd.DataFrame,
                 feature_names: List[str]):
        self.model = model
        self.feature_names = feature_names

        # Create SHAP explainer
        # Use TreeExplainer for tree models, KernelExplainer for others
        if hasattr(model, 'predict_proba'):
            try:
                self.explainer = shap.TreeExplainer(model)
            except Exception:
                background = shap.sample(training_data, 100)
                self.explainer = shap.KernelExplainer(
                    model.predict_proba, background
                )
        else:
            background = shap.sample(training_data, 100)
            self.explainer = shap.KernelExplainer(
                model.predict, background
            )

    def explain_patient(
        self, patient_features: pd.DataFrame, top_k: int = 5
    ) -> Dict:
        """Generate SHAP explanation for a single patient."""
        shap_values = self.explainer.shap_values(patient_features)

        # Handle binary classification (take positive class)
        if isinstance(shap_values, list):
            shap_values = shap_values[1]

        values = shap_values[0] if len(shap_values.shape) > 1 else shap_values

        # Create feature-value-SHAP mapping
        explanations = []
        for i, (name, shap_val) in enumerate(
            zip(self.feature_names, values)
        ):
            explanations.append({
                "feature": name,
                "value": float(patient_features.iloc[0, i]),
                "shap_value": float(shap_val),
                "direction": "increases_risk" if shap_val > 0
                             else "decreases_risk",
                "abs_importance": abs(float(shap_val)),
            })

        # Sort by absolute importance
        explanations.sort(key=lambda x: x["abs_importance"],
                         reverse=True)

        return {
            "top_contributors": explanations[:top_k],
            "all_contributions": explanations,
            "base_value": float(
                self.explainer.expected_value[1]
                if isinstance(self.explainer.expected_value, list)
                else self.explainer.expected_value
            ),
            "prediction": float(sum(values)) + float(
                self.explainer.expected_value[1]
                if isinstance(self.explainer.expected_value, list)
                else self.explainer.expected_value
            ),
        }

    def global_importance(self, test_data: pd.DataFrame) -> List[Dict]:
        """Compute global feature importance across patient population."""
        shap_values = self.explainer.shap_values(test_data)
        if isinstance(shap_values, list):
            shap_values = shap_values[1]

        mean_abs = np.abs(shap_values).mean(axis=0)
        importance = []
        for name, val in zip(self.feature_names, mean_abs):
            importance.append({
                "feature": name,
                "mean_abs_shap": float(val),
            })
        importance.sort(key=lambda x: x["mean_abs_shap"], reverse=True)
        return importance
LIME: Local Interpretable Model-Agnostic Explanations
LIME takes a fundamentally different approach from SHAP. Instead of computing exact Shapley values, LIME creates a simple, interpretable model (typically linear regression) that approximates the complex model's behavior in the local neighborhood of a specific prediction.
The process is:
- Take the patient whose prediction you want to explain
- Generate hundreds of slightly perturbed versions of that patient (change one feature at a time)
- Get the complex model's prediction for each perturbed version
- Fit a simple linear model to these local predictions
- The linear model's coefficients are the explanation
LIME's advantage is speed and model-agnosticism — it works with any model that produces predictions. Its disadvantage is instability: different random perturbations can produce different explanations for the same patient. For clinical applications, this instability is a significant concern — a clinician should get the same explanation every time they ask why a patient was flagged.
# xai_lime_clinical.py — LIME Explanations for Clinical Models
import lime
import lime.lime_tabular
import numpy as np
import pandas as pd
from typing import Dict, List


class ClinicalLIMEExplainer:
    """LIME explainer with clinical output formatting."""

    def __init__(self, model, training_data: pd.DataFrame,
                 feature_names: List[str],
                 categorical_features: List[int] = None):
        self.model = model
        self.feature_names = feature_names

        self.explainer = lime.lime_tabular.LimeTabularExplainer(
            training_data.values,
            feature_names=feature_names,
            categorical_features=categorical_features or [],
            mode="classification",
            discretize_continuous=True,
            random_state=42,  # Fixed seed for reproducibility
        )

    def explain_patient(
        self, patient_features: np.ndarray, top_k: int = 5
    ) -> Dict:
        """Generate LIME explanation for a single patient."""
        explanation = self.explainer.explain_instance(
            patient_features,
            self.model.predict_proba,
            num_features=top_k,
            num_samples=1000,
        )

        # Extract feature contributions
        contributions = []
        for feature_rule, weight in explanation.as_list():
            contributions.append({
                "feature_rule": feature_rule,
                "weight": float(weight),
                "direction": "increases_risk" if weight > 0
                             else "decreases_risk",
            })

        return {
            "prediction_probability": float(
                explanation.predict_proba[1]
            ),
            "top_contributors": contributions,
            "model_r_squared": float(explanation.score),
            "intercept": float(explanation.intercept[1]),
        }
Counterfactual Explanations: The Clinician's Preferred Format
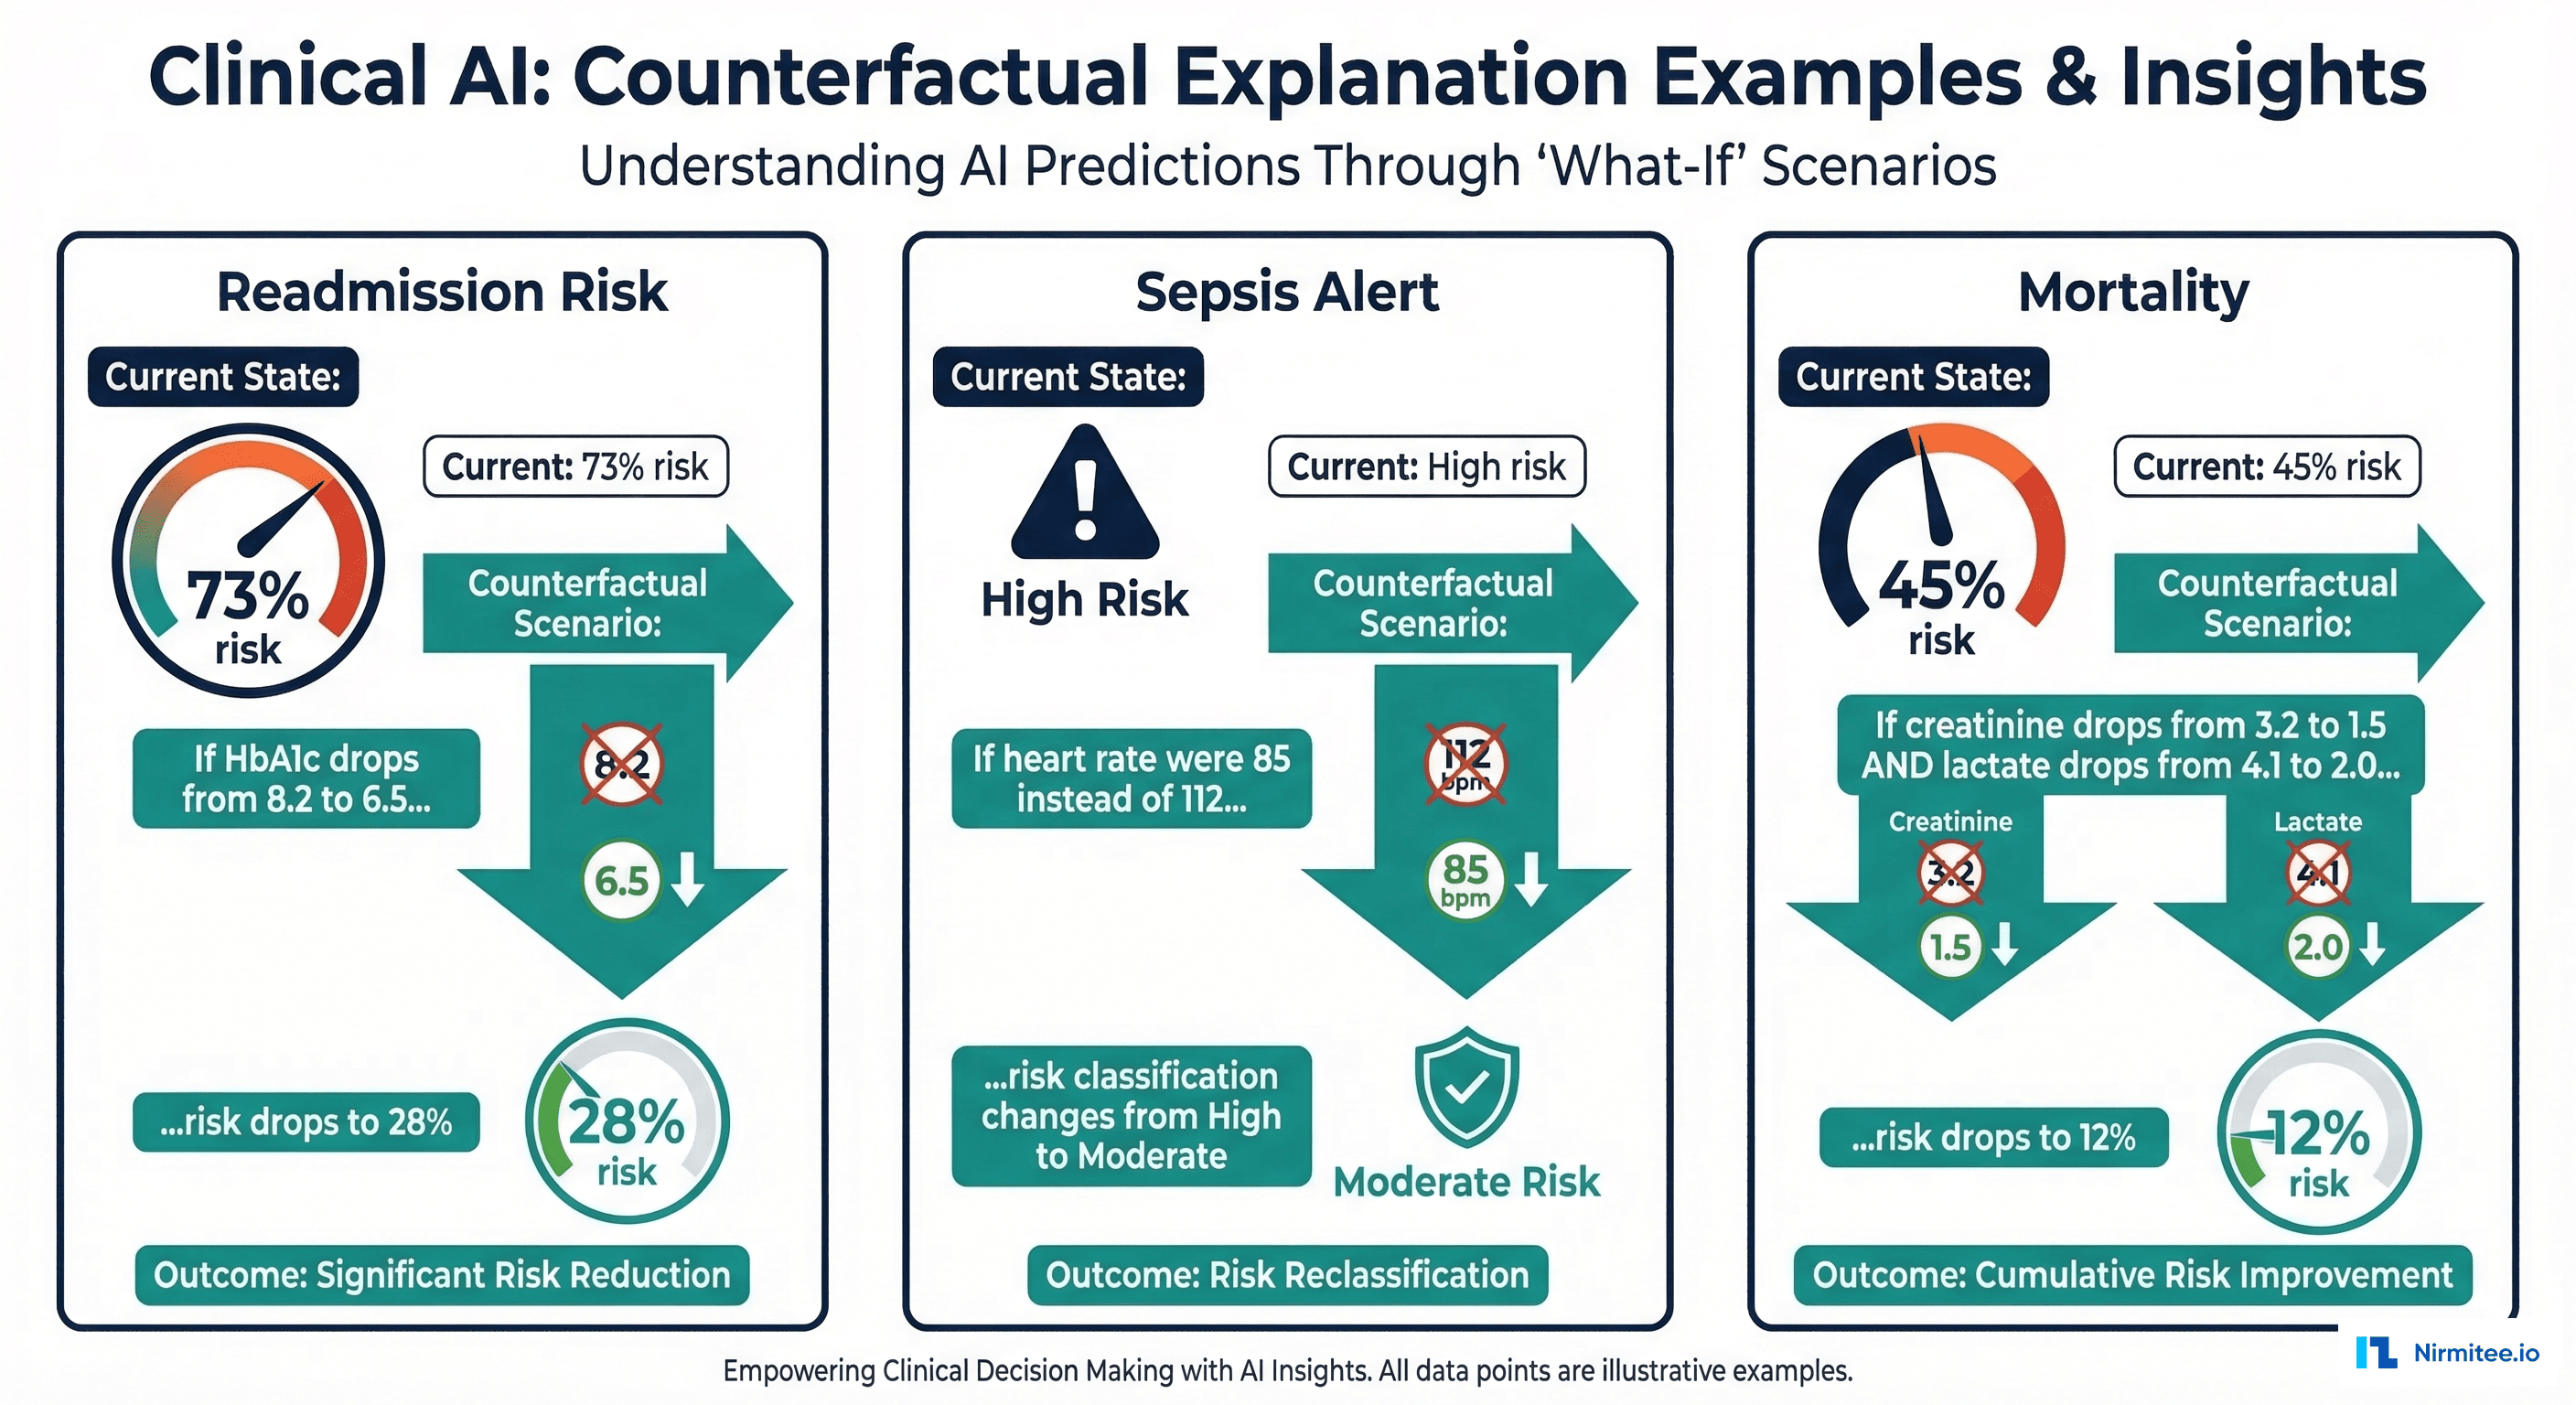
Research consistently shows that clinicians prefer counterfactual explanations over feature importance scores. A counterfactual answers the question: "What would need to change about this patient for the model's prediction to be different?"
Instead of "HbA1c has a SHAP value of +0.12," a counterfactual says: "If this patient's HbA1c were 6.5 instead of 8.2, the readmission risk would drop from 73% to 28%." This format aligns with how clinicians naturally think about patient management — in terms of interventions and their expected outcomes.
# xai_counterfactual.py — Counterfactual Explanations for Clinical AI
import numpy as np
import pandas as pd
from typing import Dict, List, Tuple


class ClinicalCounterfactualExplainer:
    """Generate actionable counterfactual explanations."""

    # Clinically modifiable features and their realistic ranges
    MODIFIABLE_FEATURES = {
        "hba1c": {"direction": "decrease", "target": 6.5,
                  "label": "HbA1c", "unit": "%"},
        "systolic_bp": {"direction": "decrease", "target": 120,
                        "label": "Systolic BP", "unit": "mmHg"},
        "heart_rate": {"direction": "normalize", "target": 75,
                       "label": "Heart Rate", "unit": "bpm"},
        "creatinine": {"direction": "decrease", "target": 1.0,
                       "label": "Creatinine", "unit": "mg/dL"},
        "num_medications": {"direction": "optimize", "target": 5,
                            "label": "Medications", "unit": ""},
        "spo2": {"direction": "increase", "target": 98,
                 "label": "SpO2", "unit": "%"},
    }

    def __init__(self, model, feature_names: List[str]):
        self.model = model
        self.feature_names = feature_names

    def generate_counterfactuals(
        self, patient: pd.DataFrame, threshold: float = 0.30
    ) -> List[Dict]:
        """Generate counterfactuals for modifiable clinical features.

        Args:
            patient: Single patient feature vector
            threshold: Risk threshold below which patient is 'low risk'
        """
        current_risk = self.model.predict_proba(
            patient.values.reshape(1, -1)
        )[0][1]
        counterfactuals = []

        for feat_name, config in self.MODIFIABLE_FEATURES.items():
            if feat_name not in self.feature_names:
                continue

            feat_idx = self.feature_names.index(feat_name)
            current_value = patient.iloc[feat_idx]
            target_value = config["target"]

            # Skip if already at or better than target
            if config["direction"] == "decrease" and current_value <= target_value:
                continue
            if config["direction"] == "increase" and current_value >= target_value:
                continue

            # Create counterfactual patient
            cf_patient = patient.copy()
            cf_patient.iloc[feat_idx] = target_value
            cf_risk = self.model.predict_proba(
                cf_patient.values.reshape(1, -1)
            )[0][1]

            risk_reduction = current_risk - cf_risk
            if risk_reduction > 0.01:  # Only report meaningful changes
                counterfactuals.append({
                    "feature": config["label"],
                    "current_value": f"{current_value:.1f} {config['unit']}",
                    "target_value": f"{target_value:.1f} {config['unit']}",
                    "current_risk": f"{current_risk*100:.0f}%",
                    "counterfactual_risk": f"{cf_risk*100:.0f}%",
                    "risk_reduction": f"{risk_reduction*100:.0f}%",
                    "crosses_threshold": cf_risk < threshold,
                })

        # Sort by risk reduction (most impactful first)
        counterfactuals.sort(
            key=lambda x: float(x["risk_reduction"].rstrip("%")),
            reverse=True
        )
        return counterfactuals
The Clinical Explanation Layer
Here is the critical insight that most healthcare AI teams miss: SHAP values and LIME weights are not explanations. They are ingredients for explanations. The explanation is what the clinician reads — a narrative in clinical language that connects model outputs to clinical reasoning.
Building this layer requires mapping technical feature names to clinical concepts, thresholds to clinical significance, and SHAP contributions to clinical narratives.
# clinical_explanation_layer.py — Translate XAI to Clinical Narratives
from typing import Dict, List
from dataclasses import dataclass


@dataclass
class ClinicalFeatureMapping:
    """Maps technical feature to clinical concept."""
    technical_name: str
    clinical_name: str
    unit: str
    normal_range: tuple  # (low, high)
    clinical_significance: str  # What does abnormality mean?
    actionable: bool  # Can clinician intervene on this?


# Clinical feature registry
FEATURE_REGISTRY = {
    "hba1c": ClinicalFeatureMapping(
        "hba1c", "HbA1c (glycated hemoglobin)", "%",
        (4.0, 5.6),
        "Indicates average blood glucose over 2-3 months. "
        "Values above 6.5% indicate diabetes.",
        actionable=True,
    ),
    "creatinine": ClinicalFeatureMapping(
        "creatinine", "Serum Creatinine", "mg/dL",
        (0.7, 1.3),
        "Marker of kidney function. Elevated values suggest "
        "renal impairment.",
        actionable=True,
    ),
    "prior_admissions_12m": ClinicalFeatureMapping(
        "prior_admissions_12m", "Hospital Admissions (past 12 months)",
        "admissions", (0, 1),
        "History of frequent hospitalizations is the strongest "
        "predictor of future readmission.",
        actionable=False,
    ),
    "systolic_bp": ClinicalFeatureMapping(
        "systolic_bp", "Systolic Blood Pressure", "mmHg",
        (90, 130),
        "Elevated values indicate hypertension risk.",
        actionable=True,
    ),
    "has_chf": ClinicalFeatureMapping(
        "has_chf", "Congestive Heart Failure", "",
        (0, 0),
        "CHF is a major risk factor for readmission, "
        "especially with medication non-adherence.",
        actionable=False,
    ),
}


def generate_clinical_narrative(
    shap_explanation: Dict,
    counterfactuals: List[Dict],
    risk_score: float,
    patient_id: str,
) -> str:
    """Generate a clinician-readable explanation."""
    risk_level = (
        "high" if risk_score > 0.5
        else "moderate" if risk_score > 0.3
        else "low"
    )

    narrative = []
    narrative.append(
        f"READMISSION RISK ASSESSMENT: {risk_score*100:.0f}% "
        f"({risk_level} risk)"
    )
    narrative.append("")

    # Top contributing factors in clinical language
    narrative.append("KEY CONTRIBUTING FACTORS:")
    for i, contrib in enumerate(
        shap_explanation["top_contributors"][:3], 1
    ):
        feat = contrib["feature"]
        mapping = FEATURE_REGISTRY.get(feat)
        if mapping:
            value = contrib["value"]
            normal = mapping.normal_range
            status = (
                "elevated" if value > normal[1]
                else "low" if value < normal[0]
                else "normal"
            )
            direction = (
                "increases" if contrib["direction"] == "increases_risk"
                else "decreases"
            )
            narrative.append(
                f"  {i}. {mapping.clinical_name}: "
                f"{value:.1f} {mapping.unit} ({status}) "
                f"- {direction} risk"
            )
        else:
            narrative.append(
                f"  {i}. {feat}: {contrib['value']:.1f}"
            )

    # Actionable counterfactuals
    if counterfactuals:
        narrative.append("")
        narrative.append("ACTIONABLE INSIGHTS:")
        for cf in counterfactuals[:2]:
            if cf.get("crosses_threshold"):
                narrative.append(
                    f"  - If {cf['feature']} improves from "
                    f"{cf['current_value']} to {cf['target_value']}, "
                    f"risk would decrease from {cf['current_risk']} "
                    f"to {cf['counterfactual_risk']} "
                    f"(below threshold)"
                )
            else:
                narrative.append(
                    f"  - Improving {cf['feature']} to "
                    f"{cf['target_value']} would reduce risk "
                    f"by {cf['risk_reduction']}"
                )

    narrative.append("")
    narrative.append(
        "NOTE: This assessment is generated by an AI model and "
        "is advisory only. Clinical judgment should guide all "
        "treatment decisions."
    )

    return "\n".join(narrative)
The Clinician-Facing Explanation Card
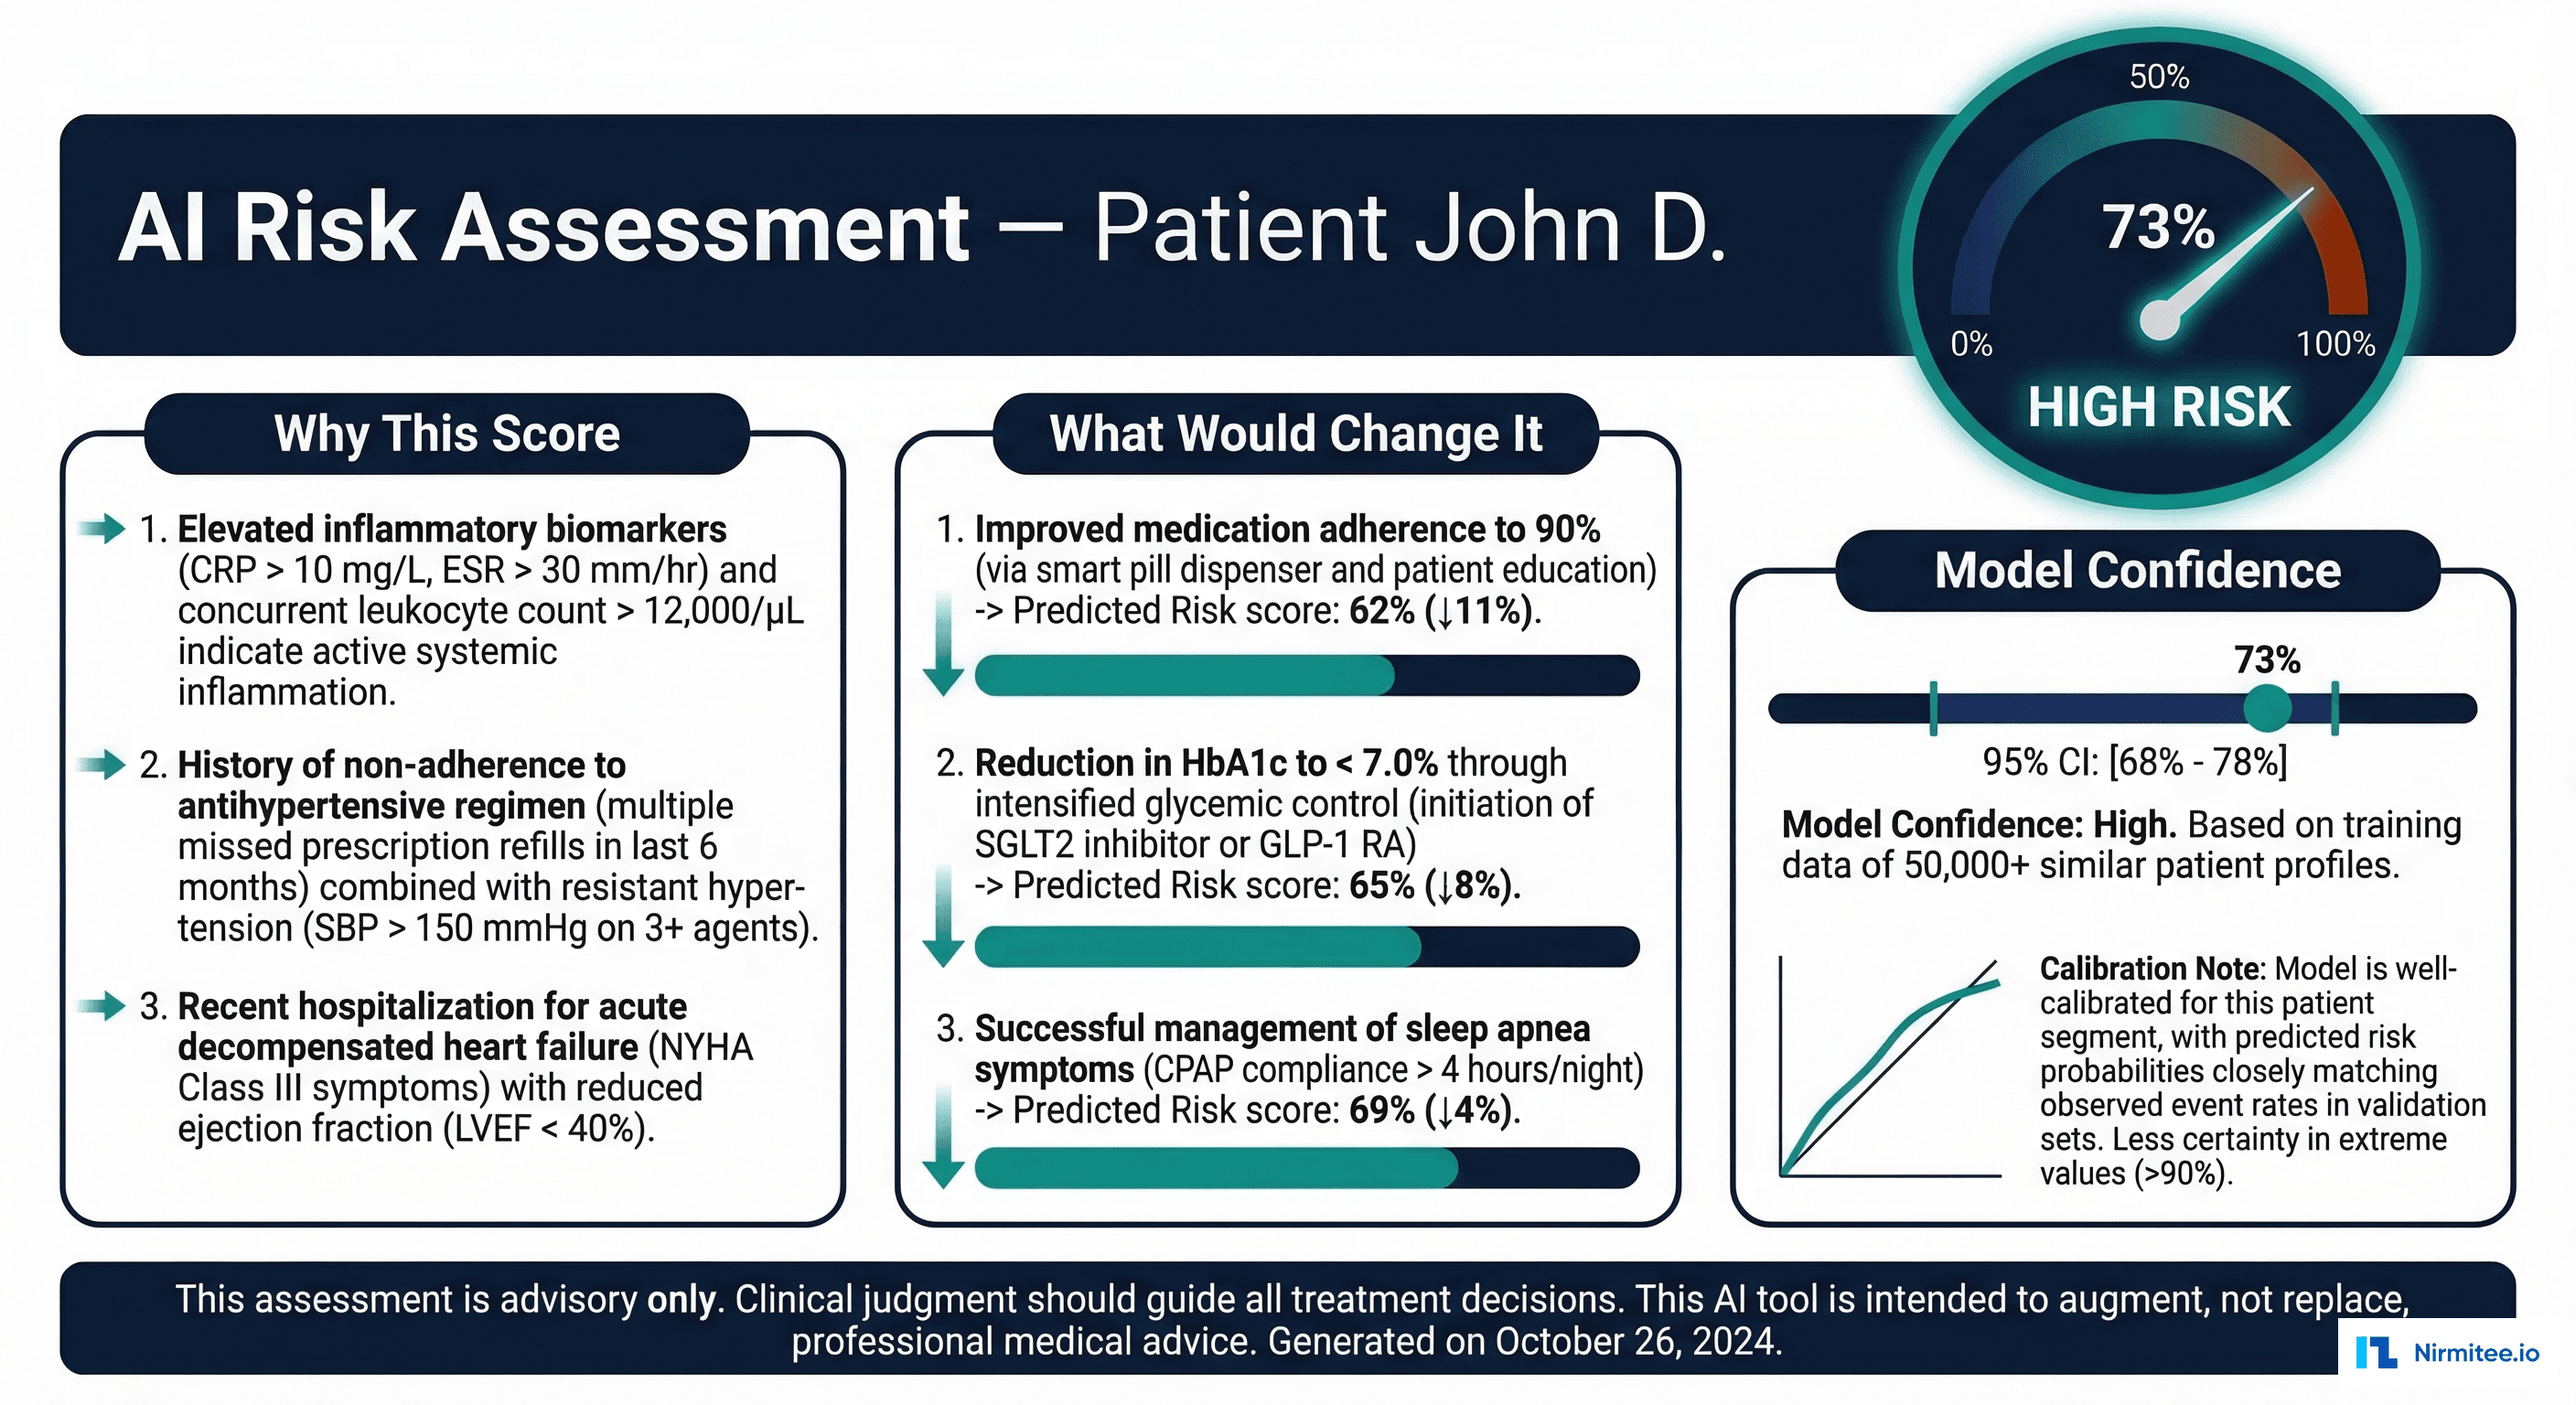
The final deliverable is not a SHAP plot or a LIME table — it is a structured explanation card that fits into the clinical workflow. This card is displayed in the EHR alongside other clinical decision support tools.
Key design principles for the explanation card:
- Risk score prominently displayed with a visual gauge (not just a number)
- Top 3 contributing factors in clinical language, not feature names
- Actionable counterfactuals showing what interventions could change the risk
- Confidence indicator showing the model's calibration quality for this patient type
- Mandatory disclaimer stating the model is advisory only
FDA Requirements for Explainability
The FDA does not mandate a specific XAI method, but its guidance documents establish clear expectations:
| FDA Requirement | What It Means | XAI Method |
|---|---|---|
| Transparency | Users must understand the device's intended use, limitations, and general logic | Global SHAP, model card documentation |
| Explainability | Individual predictions must be interpretable by the intended user | Local SHAP, LIME, or counterfactual per patient |
| Performance characterization | Performance must be disclosed across relevant subpopulations | SHAP interaction values by demographic group |
| Bias evaluation | Algorithmic bias must be assessed and mitigated | SHAP disparity analysis across protected classes |
For complete FDA compliance guidance, see our article on FDA-cleared AI algorithms and clinical decision support. For model registry integration with XAI documentation, see our guide on version control and regulatory traceability.
Implementation Checklist
- Choose the right XAI method per model type. SHAP for tabular models (readmission, sepsis). GradCAM for imaging models (chest X-ray, pathology). Attention visualization for NLP models (clinical note extraction).
- Build the clinical translation layer. Map every feature to a clinical concept with normal ranges, units, and clinical significance. No technical feature names in the clinician-facing output.
- Validate explanations with clinicians. Run user studies with hospitalists and specialists. Do the explanations align with clinical reasoning? Are they actionable? Do they build or erode trust?
- Integrate into the EHR workflow. Explanations must appear at the point of decision — in the EHR, not in a separate dashboard. Use CDS Hooks for Epic/Oracle integration.
- Monitor explanation quality. Track whether clinicians agree with the model's top contributing factors. If agreement drops below 70%, the model's clinical relevance is questionable.
- Document for regulatory submission. The model registry should store XAI method, global importance rankings, and sample explanation outputs as part of the model card.
Frequently Asked Questions
Which XAI method should I use for my clinical model?
For tabular models (readmission, sepsis, mortality prediction), SHAP is the gold standard — it provides both global and local explanations with mathematical guarantees. For medical imaging, GradCAM or attention visualization shows which regions of the image influenced the prediction. For clinical NLP, attention weights in transformer models show which words or phrases were most influential. Always pair technical explanations with the clinical translation layer.
How do I handle XAI for ensemble models?
SHAP's TreeExplainer works natively with gradient boosting ensembles (XGBoost, LightGBM, CatBoost) — the most common model type in clinical tabular prediction. For other ensemble types, KernelExplainer is model-agnostic but slower. The clinical translation layer is the same regardless of the underlying XAI method.
Do explanations need to be computed in real-time?
For clinical decision support at the point of care, explanations should load within 2-3 seconds. SHAP TreeExplainer is fast enough for real-time (typically under 100ms for tabular models). KernelExplainer and LIME are slower (1-5 seconds) but still acceptable. Pre-compute global explanations and cache per-patient explanations to reduce latency.
Can SHAP values be manipulated or gamed?
SHAP values faithfully represent the model's reasoning, but the model's reasoning may not reflect clinical reality. A model might rely heavily on a feature like "time of admission" (a data artifact correlated with severity) rather than clinical indicators. SHAP exposes this problem — it does not create it. Regular review of global SHAP importance by clinical leadership catches these issues early.
How do I validate that explanations are correct?
There is no ground truth for "correct" explanations — but there are validation approaches. First, clinical plausibility: do the top features align with medical knowledge? Second, consistency: does SHAP give the same explanation for similar patients? Third, user studies: do clinicians find the explanations helpful and trustworthy? Track explanation satisfaction scores as a KPI alongside model accuracy.
Conclusion
Explainable AI for clinical models is not about producing SHAP plots — it is about building the trust bridge between machine learning predictions and clinical decision-making. The technical methods (SHAP, LIME, counterfactuals) are well-established. The gap is in the translation layer: converting feature importance scores into clinical narratives that clinicians can understand, evaluate, and act upon.
The organizations that get this right will see their clinical AI models adopted into real workflows. The ones that ship SHAP waterfall plots to hospitalists will see their models ignored — regardless of how accurate they are. Explainability is not a feature to add after deployment. It is a core requirement that shapes model design, validation, and clinical integration from the start.