Here is a truth that nobody in the healthcare interoperability space wants to say out loud: connecting your systems makes your data worse before it makes it better. Every health system that has attempted a major integration project has discovered this the hard way. You spend eighteen months and $2 million connecting five EHRs, three lab systems, and a pharmacy platform. On go-live day, your clinicians open the unified patient chart and find duplicate records, contradictory medication lists, lab values missing reference ranges, and diagnosis codes that mean different things depending on which system generated them.
This is not a failure of your integration team. It is a structural property of healthcare data. When data lives in isolated silos, each silo enforces its own consistency rules. The Epic system has internally consistent patient records. The Cerner system has internally consistent patient records.
The reference lab system has internally consistent results. But the moment you merge these streams, you expose every inconsistency between them that was previously invisible. You are not creating data quality problems. You are revealing them, and in the process, making them worse through duplication, ambiguity, and context loss.
This article is the honest, technically detailed guide to healthcare data quality at scale that every data architect and CIO needs before starting an integration project. We will cover the six specific mechanisms that degrade data quality during integration, the patient matching problem that has no perfect solution, how to build a data quality pipeline that prevents rather than remediates, and the architecture patterns that make quality a precondition for integration rather than an afterthought.
The Counterintuitive Truth: Interoperability Makes Data Worse Before It Gets Better
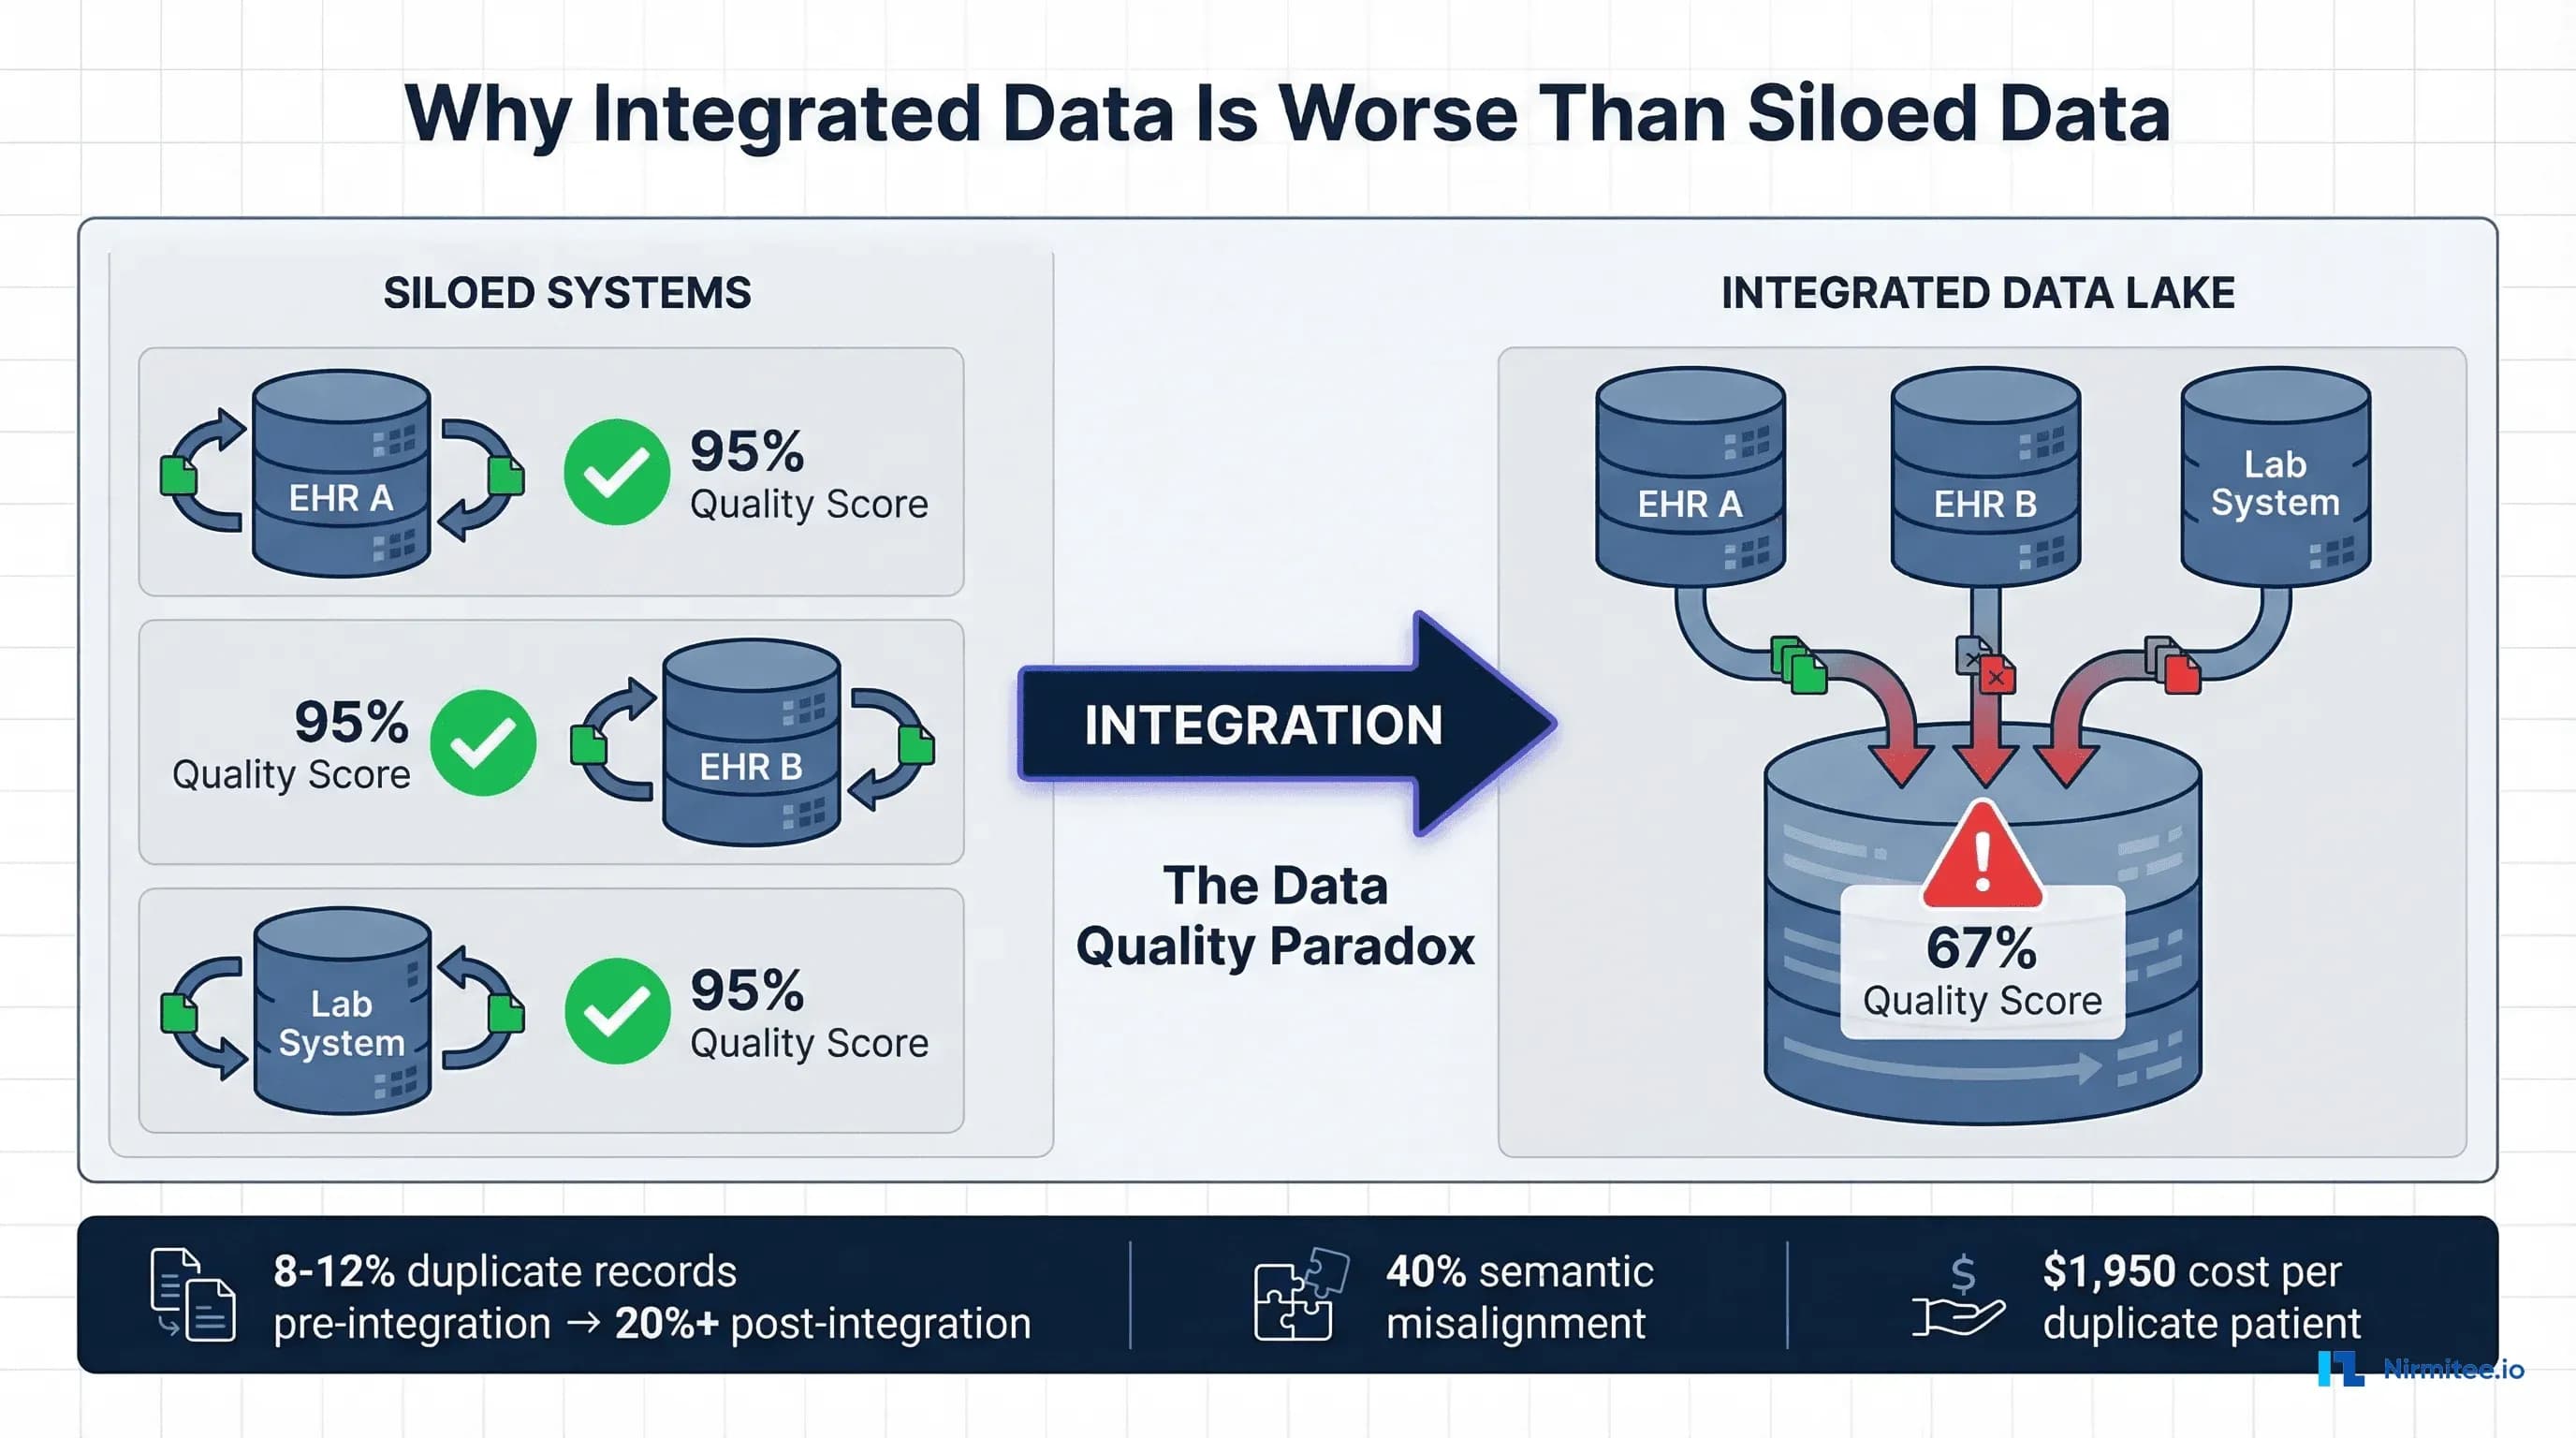
The promise of healthcare interoperability is a complete, accurate, longitudinal patient record available at the point of care. The reality of healthcare interoperability, as documented by the ONC's Master Data Management study and confirmed by every major health system integration, is that connecting systems multiplies data quality problems by a factor that correlates directly with the number of source systems.
Why? Consider what happens when you connect five hospital EHRs into a health information exchange. Before integration, each EHR had its own master patient index (MPI) with an internal duplicate rate of approximately 8%. The 2016 JAMIA study on MPI data discrepancies found that the average MPI duplicate rate was 8% for individual systems, rising to 9.4% for databases with more than one million records. After integration, you now have five separate representations of many of the same patients. Each system may have recorded different spellings of names, different addresses (home vs. work vs. mailing), different phone numbers, and different insurance IDs for the same person. Your cross-system duplicate rate can easily exceed 20%, and in some documented cases has reached 39.1% in enterprise MPI databases.
But duplicates are only the beginning. The deeper problem is that integration exposes semantic, contextual, temporal, and provenance failures that were invisible when each system operated independently. A hemoglobin A1C value of 7.2 in System A and 7.2 in System B looks identical, but if System A uses DCCT-aligned units and System B uses IFCC-aligned units, the clinical meaning is different. A medication order for "metformin 500mg" in one system and "Glucophage 500mg" in another might be the same prescription recorded with generic versus brand names, or it might be two separate prescriptions. Without the source context, the integrated view cannot distinguish between these scenarios.
The Healthcare IT Today analysis of integration challenges identified that fragmented systems from hospitals, clinics, and insurance providers keep information siloed, and that when these silos are connected, the inconsistencies between them create a data quality crisis that did not exist when the systems were separate.
The 2026 Knowi healthcare data management report confirmed that data quality degradation during integration remains one of the top three challenges facing healthcare organizations.
The 6 Data Quality Killers in Healthcare Integration
Through analysis of published research, integration case studies, and our own experience building healthcare data platforms, we have identified six specific mechanisms that degrade data quality during healthcare system integration. Each operates independently, and their effects compound when multiple killers are present simultaneously, which they almost always are.
1. Duplicate Patient Records: The Multiplication Problem
Duplicate patient records are the most visible and most studied data quality problem in healthcare integration. The numbers tell a story of compounding failure. Individual hospital MPIs average an 8% duplicate rate, according to the JAMIA MPI study. The CHIME survey of healthcare CIOs found error rates due to patient mismatching averaged 8% and ranged up to 20%. Enterprise MPI databases that aggregate across multiple facilities have documented duplicate rates as high as 39.1%.
The financial impact is direct and measurable. Each duplicate patient record costs an average of $1,950 per inpatient stay and more than $1,700 per emergency department visit in repeated testing, delayed treatment, and administrative rework. Thirty-five percent of all denied claims result from inaccurate patient identification, costing the average hospital $2.5 million annually and the U.S. healthcare system more than $6.7 billion per year.
Why does integration make duplicates worse? When you merge five systems, you must match patients across databases that may not share a common identifier. The United States has no national patient identifier (the MATCH IT Act of 2025 is the latest legislative attempt to address this). Matching relies on demographic data: name, date of birth, Social Security number, address, and phone number. Every variation in how these fields are recorded across systems creates potential for false negatives (failing to match records that belong to the same person) or false positives (incorrectly merging records of different people).
Consider a patient named "Robert James Smith" in System A and "Bob J. Smith" in System B. If the date of birth matches but the address is different (he moved between visits), a conservative matching algorithm will create two separate records. An aggressive matching algorithm might merge them but will also risk merging records for "Robert James Smith" (age 45) and "Robert Joseph Smith" (age 47), who happen to share the same address because they are father and son.
2. Semantic Misalignment: Same Code, Different Meaning
Semantic misalignment occurs when different systems use the same coding system but assign codes differently, or when systems use different coding systems entirely. This is more insidious than duplicates because it is invisible without deep clinical knowledge.
The systematic review of FHIR implementations published in JMIR documented that even within the same standard, local customizations and optional fields mean that one organization's data can look very different from another's. HL7 Version 2 has been used for decades, but local customizations mean that an ADT message from Hospital A may have completely different segment ordering and field population than the same message type from Hospital B.
Real-world examples of semantic misalignment include ICD-10 code specificity differences, where one system codes "Type 2 diabetes mellitus without complications" (E11.9) while another codes "Type 2 diabetes mellitus with diabetic chronic kidney disease" (E11.22) for the same patient based on different clinical perspectives. LOINC code mapping inconsistencies where the same lab test is mapped to different LOINC codes by different analyzers. Medication coding where NDC codes, RxNorm concepts, and local formulary codes all represent the same drug differently. And severity scoring where the same clinical finding is graded differently on institution-specific scales.
According to the Frontiers in Digital Health study on FHIR mapping, transforming data between healthcare standards like HL7 CDA and FHIR requires sophisticated approaches to ensure data integrity, and that semantic loss during transformation remains a significant challenge even with modern tools.
3. Missing Context: Lab Values Without Reference Ranges, Medications Without Indications
Healthcare data derives its meaning from context. A potassium level of 5.8 mEq/L is critically abnormal if the reference range is 3.5-5.0, concerning if the range is 3.5-5.5, and normal-adjacent if the patient is on potassium-sparing diuretics and the expected range has been adjusted. When data moves between systems, the context frequently does not travel with it.
This manifests in several patterns. Lab results transmitted without reference ranges, which vary by analyzer manufacturer, patient age, and patient sex. Medication lists without indication codes make it impossible to determine whether metformin is prescribed for diabetes, polycystic ovarian syndrome, or weight management. Vital signs without position context (seated, standing, supine blood pressure), rendering trend analysis unreliable. Problem list entries without onset dates or status (active, resolved, inactive) create a clinical picture that conflates past and present conditions.
The MDPI survey on patient-centered data interoperability found that current interoperability standards cannot address some scenarios, particularly when patients' health records are stored by multiple healthcare providers with diverse interoperability standards or the same standard but different implementation guides. The context loss is not a failure of any individual standard but an emergent property of data exchange between systems that were designed to operate independently.
4. Temporal Inconsistency: Different System Clocks, Retroactive Updates
Healthcare operations run on timestamps. Medication administration times, lab specimen collection times, vital sign measurement times, and order entry times all form the temporal backbone of a patient's clinical narrative. When systems have different time-keeping practices, the integrated timeline becomes unreliable.
System clock synchronization is the most basic issue. Hospital servers, medical devices, point-of-care instruments, and ambulatory EHRs may not be synchronized to the same NTP source. A 15-minute clock drift between a bedside monitor and the central EHR means vital signs appear to have been recorded at the wrong time, and medications administered "before" the vital sign change that prompted them.
More complex temporal inconsistencies arise from retroactive documentation. A physician enters a note at 3:00 PM describing a clinical finding observed at 9:00 AM. Some systems timestamp the note with the documentation time. Others timestamp it with the clinically relevant time. An interface that transmits this data may use either a timestamp, and the receiving system may interpret it differently than the sending system intended.
Backdated corrections create another category of temporal problems. When a lab result is corrected after initial reporting, the correction carries a new timestamp. If the integrated system has already consumed the original result, the correction may create a duplicate (original plus corrected) rather than replacing the original. The clinical significance is not trivial: a corrected lab result that appears as an additional value looks like a trend when it is actually a correction.
5. Format Fragmentation: HL7v2 Pipes + FHIR JSON + CDA XML = Chaos
Healthcare data arrives in at least three major formats, often simultaneously. HL7 Version 2 messages use a pipe-delimited format that has been the backbone of healthcare interfaces since the 1980s. FHIR uses JSON (or XML) resources with a modern RESTful architecture. CDA (Clinical Document Architecture) uses XML with a complex document model. Each format encodes clinical information differently, and translating between them is a lossy process.
Consider a patient's allergy. In HL7v2, allergies may be captured in AL1 segments with coded allergy type, coded allergen, severity, and reaction. In FHIR, an AllergyIntolerance resource uses a richer model with clinical status, verification status, category, criticality, and separate reaction components with manifestation and severity. In CDA, allergies appear in the Allergies and Intolerances section with coded entries that may or may not include the same level of detail.
When a health information exchange receives allergy data in all three formats from different source systems, the integration engine must normalize these into a single representation. The critical review of health data interoperability standards found that HL7 and FHIR adoption tends to be manual, non-uniform, and hampered by the inherent intricacy of healthcare information. Most systems are unable to accommodate semantic variation or unstructured types without considerable human effort.
The practical result is that format fragmentation forces integration teams to build and maintain multiple parsers, multiple mappers, and multiple validators. Each transformation step introduces the possibility of data loss, misinterpretation, or error. A field that exists in HL7v2 but has no direct FHIR equivalent may be dropped. A FHIR extension that captures nuanced clinical data may be flattened into a generic text field when mapped to CDA.
6. Provenance Loss: Which System Was the Source of Truth?
When data is merged from multiple sources, a critical piece of metadata is often lost: provenance. Which system generated this data? When? Under what clinical circumstances? Who was the responsible clinician? Was this a primary observation or a copy of data from another system?
Provenance loss creates a specific clinical risk: the inability to resolve conflicting information. If the integrated patient record shows two different medication lists, one from the ambulatory EHR and one from the hospital EHR, the clinician needs to know which is more current and which was the source of the prescribing decision. Without provenance metadata, the clinician sees conflicting information with no way to determine which source to trust.
The ONC Master Data Management study emphasized that data governance and provenance tracking are essential components of any multi-system integration, yet found that the majority of health information exchange implementations lacked comprehensive provenance metadata. The FHIR standard includes a Provenance resource specifically designed to address this, but adoption remains inconsistent. Many integration engines strip provenance metadata during transformation to simplify processing, creating an ironic situation where the standard supports provenance tracking but the implementation tools discard it.
Case Study: What Happens When You Connect 5 Hospital EHRs
To illustrate how these six quality killers compound in practice, consider a realistic scenario based on patterns observed across multiple health system integrations.
A five-hospital health system decides to implement an enterprise data warehouse and health information exchange. The hospitals run three different EHR platforms (two Epic, two Cerner, one MEDITECH). Each hospital also connects to external reference labs, pharmacy benefit managers, and imaging centers. The stated goal is a unified longitudinal patient record accessible across all five facilities.
Month 1-3: Discovery
The integration team discovers that the five hospitals have collectively accumulated 2.1 million unique patient records across their separate MPIs. Based on the service area population of 800,000, the actual number of unique patients is approximately 1.4 million, implying an initial cross-system duplication rate of 33%. The two Epic instances have been independently configured with different custom fields, different SmartPhrase libraries, and different preference list hierarchies. The two Cerner instances use different code sets for the same clinical concepts. The MEDITECH system uses legacy HL7v2 interfaces that predate current HL7 implementation guides.
Month 4-8: Integration Build
The team builds integration interfaces and begins flowing data to the enterprise data warehouse. Immediate problems surface. The patient matching algorithm produces 180,000 potential matches (patients who appear in multiple systems) but can only auto-resolve 112,000 with high confidence. The remaining 68,000 require manual review. Manual review capacity is approximately 200 records per day per analyst. With three analysts, clearing the backlog will take 113 business days (more than five months). Meanwhile, new potential duplicates are generated daily as patients continue to register across facilities.
Months 9-12: Quality Crisis
Clinical users begin accessing the integrated view and immediately report problems. A cardiologist at Hospital A opens a patient record and sees two active medication lists with contradictory information. The list from Hospital B includes a beta-blocker that was discontinued three months ago but was never reconciled in Hospital B's system because the patient's primary care was at Hospital A. A lab value appears twice with slightly different timestamps because the reference lab sent results to both the ordering hospital and the patient's primary care hospital, and the integration engine could not deduplicate them without matching on accession numbers, which were not included in the HL7 messages.
The emergency department reports that allergies are inconsistently displayed. Some patients show "Penicillin" as an allergy from one system and "Penicillin V" as a separate allergy from another system. These are clinically related but coded differently, and the integration engine treats them as separate allergies. For medications, the integrated view sometimes shows both generic and brand names as separate entries, inflating the apparent medication count and creating confusion about the actual regimen.
Month 12-18: Remediation
The health system is forced to invest an additional $1.8 million in data quality remediation that was not budgeted in the original integration project. This includes hiring additional analysts for manual record matching, implementing a terminology normalization service, building custom deduplication rules for lab results and medication lists, and creating a clinical data quality dashboard to track ongoing issues. The original twelve-month project timeline extends to twenty-four months. The total cost doubles from $2 million to approximately $4 million.
This scenario is not hypothetical. It is a composite of documented integration outcomes. The CertifyHealth analysis of interoperability challenges confirmed that healthcare organizations consistently underestimate the data quality investment required for successful integration, and that remediation costs typically exceed the original integration budget by 50-100%.
The Patient Matching Problem: No Perfect Solution
Patient matching deserves dedicated analysis because it is the single largest technical challenge in healthcare data integration, and because its failure modes have direct patient safety implications.
Why Healthcare Does Not Have a National Patient ID
The United States is one of the few developed nations without a universal patient identifier. Since 1998, Congress has included a provision in the annual HHS appropriations bill prohibiting the use of federal funds to develop a unique patient identifier. The MATCH IT Act of 2025 represents the most recent bipartisan attempt to address this, focusing on improving patient matching rather than creating a national ID.
Without a universal identifier, patient matching relies on demographic data that is inherently imprecise. Names change (marriage, divorce, legal name change, preferred name vs. legal name). Addresses change (moves, temporary addresses, homelessness). Phone numbers change. Even dates of birth can be recorded incorrectly. Social Security numbers are not universally collected (pediatric patients, undocumented individuals, refusal to provide) and carry privacy risks that make many organizations reluctant to use them as matching fields.
Three Approaches to Patient Matching
Deterministic matching requires exact agreement on a defined set of fields (e.g., exact match on last name + date of birth + SSN last 4). Deterministic matching achieves very high precision (low false positive rate, typically above 99%) but poor recall (high false negative rate, missing 20-25% of true matches). It fails on name variations, data entry errors, and missing fields.
Probabilistic matching (Fellegi-Sunter model) assigns weights to field agreements and disagreements, computing a composite score that represents the probability that two records refer to the same person. The 2023 PMC study on patient record linkage optimization found that probabilistic algorithms offer flexibility and can handle variations in patient demographic data but may have higher false-positive rates.
Typical probabilistic matchers achieve 89-95% recall with 94-96% precision, but the 4-6% false positive rate at scale (millions of records) generates thousands of incorrect merges that require manual review.
Machine learning-based matching uses supervised learning models (random forests, gradient boosting, neural networks) trained on curated match/non-match pairs. The PMC optimization study demonstrated that ML-based approaches can achieve 95-97% precision and 95-96% recall, outperforming both deterministic and probabilistic methods.
However, ML-based matchers require labeled training data (which is expensive to create), may not generalize well across populations, and create "black box" matching decisions that are difficult to audit or explain to clinicians.
The False Positive Problem: Worse Than False Negatives
In patient matching, false positives (incorrectly merging records of two different patients) are significantly more dangerous than false negatives (failing to link records of the same patient). A false positive creates a hybrid medical record that contains clinical information from two different people. A clinician reviewing this record may prescribe a medication based on allergies, diagnoses, or lab results that belong to a different patient. The PMC study explicitly noted that "a false positive prediction has a high cost, because the records of two distinct patients will be incorrectly linked, leading to potential privacy issues, increasing the risk of medical errors, and reducing the credibility of patient records."
False negatives, while less dangerous, are still costly. A patient whose records are not linked across systems will undergo duplicate testing, provide redundant medical history, and miss out on care coordination. The financial cost of duplicate testing alone averages $800-$1,200 per unlinked patient record per year.
Building a Healthcare Data Quality Pipeline
The solution to healthcare data quality at scale is not a single tool or technique. It is a pipeline architecture that treats data quality as a series of transformations applied systematically before data reaches clinical or analytical consumers.
Stage 1: Ingest (Multi-Format Intake)
The ingestion stage accepts data from all source systems in their native formats. This means HL7v2 parsers for legacy interfaces, FHIR client/server capabilities for modern APIs, CDA document parsers for clinical document exchange, flat file processors for CSV/Excel exports from ancillary systems, and real-time stream processing (Apache Kafka or similar) for high-volume feeds.
Critical ingestion capabilities include source tagging (every record must carry metadata identifying the originating system, interface, and timestamp), schema detection (automatically identifying the format and version of incoming data), and audit logging (every ingested record must be traceable to its source message for debugging and compliance). For a deeper treatment of healthcare data ingestion patterns, see our analysis of healthcare data lake architecture.
Stage 2: Normalize (Standard Mapping)
Normalization transforms all ingested data into a single canonical data model. For healthcare, FHIR R4 is the strongest candidate for a canonical model because it is both a transport standard and a data model, it has broad industry adoption, it includes terminology binding guidance, and it supports extensions for local concepts without breaking the base model.
Normalization includes structural mapping (converting HL7v2 segments to FHIR resources, CDA sections to FHIR resources), terminology binding (mapping local codes to standard terminologies: SNOMED CT for clinical findings, LOINC for lab observations, RxNorm for medications, ICD-10 for diagnoses), and unit conversion (normalizing measurement units using UCUM). For organizations building real-time data synchronization, change data capture (CDC) patterns can ensure normalization happens continuously rather than in batch.
Terminology binding is where the most clinical expertise is required. An organization needs access to a terminology server (such as Ontoserver or the HL7 FHIR Terminology Service) that can resolve mappings, validate codes, and identify subsumption relationships (e.g., recognizing that "Penicillin V" is a child concept of "Penicillin" in SNOMED CT).
Stage 3: Deduplicate (Entity Resolution)
The deduplication stage resolves entity identity across the normalized data. This applies primarily to patients (the MPI problem discussed above) but also to providers (the same physician may appear with different NPIs or identifiers across systems), organizations (the same referring clinic may be recorded differently), and clinical entities (duplicate lab results, duplicate medication entries).
A production-grade deduplication service includes blocking (reducing the comparison space by grouping records that share key attributes, avoiding the computational impossibility of comparing every record against every other record), scoring (computing a similarity score for each candidate pair using probabilistic or ML-based algorithms), classification (categorizing pairs as definite match, definite non-match, or uncertain), golden record creation (merging matched records into a single "golden" record that represents the best available data from all sources), and link management (maintaining the linkage graph so that merges can be reversed if errors are discovered).
Stage 4: Validate (Quality Gates)
Validation applies data quality rules to every record after normalization and deduplication. This is where tools like Great Expectations and dbt with dbt-expectations become valuable in the healthcare data stack.
Healthcare-specific validation rules include completeness checks (every patient record must have name, date of birth, and gender; every lab result must have a value, unit, and reference range; every medication must have a dose, route, and frequency), referential integrity (every observation must reference a valid patient; every medication order must reference a valid prescriber), clinical plausibility (body temperature must be between 30C and 45C; heart rate must be between 20 and 300 bpm; a hemoglobin A1C above 20% should trigger review), and temporal consistency (discharge date must be after admission date; specimen collection time must be before result reporting time).
In a dbt-based pipeline, these rules can be implemented as dbt tests that run after each transformation, gating downstream processing until quality thresholds are met. Great Expectations provides a more expressive expectation language for complex multi-field validations and statistical distribution checks. For a healthcare data pipeline processing 10,000 records per hour, we recommend running validation continuously rather than in batch to catch issues as close to ingestion as possible.
Stage 5: Enrich (Context Addition)
The enrichment stage adds context that was missing from the source data.
This includes reference range lookup (attaching age-appropriate and sex-appropriate reference ranges to lab results that arrived without them), provenance metadata (attaching source system, ingestion timestamp, transformation history, and confidence scores to every data element), temporal alignment (normalizing timestamps to a common timezone, resolving clinically-relevant time vs. documentation time, and marking retroactive corrections), and relationship inference (linking medication orders to their indications using diagnosis timing, identifying medication duplicates across generic and brand names using RxNorm relationships).
Master Data Management for Healthcare
A data quality pipeline processes individual records. Master Data Management (MDM) manages the reference entities that all records relate to: patients, providers, organizations, locations, and terminology. MDM is the governance layer that ensures consistency across the entire integrated data landscape.
The Enterprise Master Patient Index (EMPI)
The EMPI is the central MDM component for healthcare. It maintains the "golden record" for each patient, resolving identities across all source systems. The Verato analysis of EMPI challenges found that traditional EMPIs struggle with several issues: they are only as good as the demographic data available (garbage in, garbage out), they require ongoing maintenance as patient demographics change, they must handle overlays (false positive merges that must be reversed) and undos (separating records that were incorrectly linked), and they need to operate in real-time for clinical workflows while also supporting batch processing for analytics.
Modern EMPI approaches incorporate referential matching (supplementing demographics with external reference data sources like credit bureaus, address verification services, and insurance eligibility records), biometric matching (using fingerprint, palm vein, or iris scanning at registration to supplement demographic matching), and federated identity (maintaining links between local MPIs rather than creating a single monolithic EMPI, reducing the blast radius of matching errors).
Terminology Services
A terminology server is not optional for healthcare data quality at scale. It provides code validation (confirming that a code is valid within its code system and version), code mapping (translating between code systems: ICD-10 to SNOMED CT, local codes to standard codes), subsumption checking (determining that "Amoxicillin" is a more specific concept than "Penicillin" for allergy cross-referencing), and value set management (maintaining curated sets of codes for specific clinical purposes, such as "diabetes-related diagnoses" or "opioid medications").
For organizations building their own data quality pipeline, HAPI FHIR provides an open-source FHIR server with built-in terminology capabilities. Ontoserver (from CSIRO) provides a dedicated, high-performance FHIR terminology server.
Golden Record Patterns
The Golden Record is the single, authoritative representation of an entity created by synthesizing data from multiple sources.
Three patterns are used in healthcare.
Survivorship rules define which source system is authoritative for each field. For example: System A is authoritative for patient demographics (because it is the registration system), System B is authoritative for insurance information (because it is the billing system), and System C is authoritative for clinical data (because it is the primary care EHR).
Most recent wins use the most recently updated value for each field, which is simple to implement but can be defeated by retroactive corrections.
Confidence scoring assigns a quality score to each source value based on the source system's reliability for that data type, the recency of the data, the completeness of the source record, and external validation (e.g., address verification). The Golden Record uses the highest-confidence value for each field.
Measuring Data Quality: The Six Dimensions
You cannot improve what you do not measure. Healthcare data quality should be measured across six standard dimensions, each with specific metrics and targets.
1. Completeness
Definition: The proportion of required data elements that are populated.
Metric: Percentage of records with all mandatory fields present.
Target: >95% for core demographic fields, >90% for clinical data elements.
Healthcare reality: Typical completeness ranges from 70-85% across integrated datasets. The most commonly missing fields are insurance secondary payer (42% missing), race/ethnicity (31% missing), and email address (28% missing). Clinically, medication indication (why the drug was prescribed) is missing in 40-60% of medication records.
2. Accuracy
Definition: The degree to which data values correctly represent the real-world entities they describe.
Metric: Percentage of values confirmed correct against an authoritative source.
Target: >98% for patient identifiers, >95% for clinical values.
Healthcare reality: Address accuracy degrades at approximately 15-20% per year as patients move. Phone number accuracy degrades at 10-15% per year. Insurance information accuracy drops significantly between open enrollment periods.
3. Consistency
Definition: The degree to which the same entity is represented the same way across different data stores.
Metric: Percentage of cross-system pairs that agree on key attributes.
Target: >90% agreement on demographic fields, >85% on clinical fields.
Healthcare reality: This is typically the worst-performing dimension, with consistency scores of 60-75% across integrated systems. The gap is driven by different data entry practices, different code sets, and different update frequencies across source systems.
4. Timeliness
Definition: The degree to which data is available when needed for its intended use.
Metric: Lag time between real-world event and data availability in the integrated system.
Target: <5 minutes for real-time clinical data, <24 hours for batch-updated reference data.
Healthcare reality: Lab result availability ranges from minutes (for stat tests within a single facility) to days (for reference lab results that traverse multiple interfaces). Discharge summaries are frequently 48-72 hours behind the actual discharge event.
5. Validity
Definition: The degree to which data conforms to the format, type, and range rules defined for its data element.
Metric: Percentage of values that pass format and range validation.
Target: >99% for structured fields, >95% for coded fields.
Healthcare reality: Validity is typically high for well-defined fields (dates, enumerated values) and lower for free-text fields that are mapped to codes. Phone number format inconsistencies (with/without country code, with/without dashes) are the most common validity failure.
6. Uniqueness
Definition: The degree to which each real-world entity is represented exactly once in the dataset.
Metric: Duplicate record rate (detected duplicates / total records).
Target: <2% after deduplication processing.
Healthcare reality: As discussed extensively above, pre-deduplication rates of 8-20% are common, and achieving the <2% target requires ongoing investment in matching algorithms and manual review processes. The JAMIA MPI study found that middle name discrepancies accounted for 58.3% of matching failures, suggesting that targeted data collection improvements for this single field could meaningfully reduce duplicate rates.
Tools and Technologies for Healthcare Data Quality
A production healthcare data quality pipeline uses multiple specialized tools, each addressing a different aspect of the quality challenge.
Great Expectations for Healthcare Data Validation
Great Expectations (GX) is an open-source data quality framework that defines "expectations" — declarative assertions about data properties. For healthcare, GX excels at profiling data distributions (identifying when a lab result distribution shifts, which may indicate an analyzer calibration change or a mapping error), building data quality checkpoints that gate downstream processing, and generating data quality documentation automatically. The practical guide to GX demonstrated how expectations can be integrated into CI/CD pipelines for continuous data quality monitoring.
dbt for Healthcare Data Transformation
dbt (data build tool) provides SQL-based transformations with built-in testing. For healthcare, dbt enables version-controlled transformations (every mapping rule is code, reviewable and auditable), incremental processing (transforming only new or changed data rather than reprocessing the entire dataset), and built-in testing with the dbt-expectations package, which brings Great Expectations-style assertions into dbt models. A typical healthcare dbt project includes staging models that normalize raw HL7v2/FHIR/CDA data, intermediate models that apply terminology mappings and deduplication logic, and mart models that present clinical and operational data to consumers.
FHIR Validation
The HL7 FHIR Validator checks FHIR resources against the specification, implementation guides, and custom profiles. FHIR validation catches structural errors (missing required fields, wrong data types), terminology errors (invalid codes, codes from the wrong value set), and profile conformance errors (resources that do not conform to the US Core Implementation Guide or other required profiles). Every FHIR resource entering the data quality pipeline should pass FHIR validation before downstream processing.
Terminology Servers
As discussed in the MDM section, a terminology server is essential. The two leading options are HAPI FHIR (open-source, Java-based, includes terminology services as part of the FHIR server) and Ontoserver (commercial, CSIRO-developed, optimized for high-performance terminology operations including SNOMED CT, LOINC, and RxNorm). Both implement the FHIR Terminology Service API ($validate-code, $lookup, $translate, $expand), enabling terminology operations to be integrated directly into the data pipeline via standard API calls.
Stream Processing
Apache Kafka provides the backbone for real-time healthcare data quality processing. Kafka's key advantages for this use case include durability (messages are persisted, enabling replay for reprocessing after mapping rule changes), ordering guarantees (within a partition, messages are processed in order, critical for temporal consistency), scalability (Kafka clusters can handle hundreds of thousands of messages per second), and integration (Kafka Connect provides connectors for HL7v2, FHIR, and database CDC). For organizations using cloud infrastructure, managed Kafka services (AWS MSK, Azure Event Hubs, Confluent Cloud) reduce operational overhead.
The Quality-First Integration Architecture
The most important architectural decision in healthcare data integration is whether to pursue an integration-first or quality-first approach. The difference in outcomes is dramatic.
Integration-First (The Common Mistake)
Most health systems follow this pattern: connect the systems, aggregate the data, discover quality issues, and then try to fix them. This approach fails because quality issues compound over time (every day of undetected duplicates means more records that need manual review), clinical users lose trust in the integrated view (once a physician encounters incorrect data in the integrated chart, they stop trusting it and revert to checking individual source systems), and remediation is orders of magnitude more expensive than prevention (fixing a duplicate record that has been in the system for six months and has accumulated lab results, notes, and orders is far more complex than preventing the duplicate at ingestion).
Our experience across healthcare integration projects confirms a consistent finding: remediation costs 5x more than prevention. An investment of $200,000 in a pre-integration data quality pipeline prevents $1 million or more in post-integration remediation.
Quality-First (The Recommended Approach)
The quality-first architecture inverts the process. Before connecting any systems, you define quality standards (what level of completeness, accuracy, consistency, timeliness, validity, and uniqueness is required for each data domain). You build the validation pipeline (the 5-stage pipeline described above). Then you connect systems through the pipeline, so that every record passes quality gates before entering the integrated data store. Finally, you establish continuous quality monitoring with automated alerting when quality metrics degrade.
This approach delivers several critical advantages.
Earlier time to value: Because data quality issues are caught and resolved at ingestion, the integrated data is usable from day one rather than requiring months of remediation.
Lower total cost: Prevention is cheaper than remediation, and the pipeline is a reusable asset that handles new source systems without starting from scratch.
Clinical trust: When clinicians know that integrated data has passed quality gates, they trust and use the integrated view rather than reverting to source systems.
Regulatory compliance: A documented quality pipeline provides audit evidence for data governance, which is increasingly required by ONC, CMS, and state health information exchange regulations.
Architecture Blueprint
The quality-first integration architecture consists of these layers.
Source layer: Source systems connected via HL7v2 interfaces, FHIR APIs, or CDC (change data capture) connectors. Each source system is treated as untrusted until its data passes quality validation.
Quality layer: The 5-stage pipeline (ingest, normalize, deduplicate, validate, enrich) running on a stream processing platform. Quality metrics are computed in real-time and published to a monitoring dashboard.
Integration layer: A FHIR-based data store (HAPI FHIR server or cloud FHIR service) that receives only validated, normalized, deduplicated data. This is the single source of truth for integrated clinical data.
Consumption layer: Clinical applications (unified patient chart, clinical decision support), analytical applications (population health, quality measurement), and operational applications (revenue cycle, care coordination) all consume data from the integration layer.
Governance layer: Data stewardship tools for managing MPI exceptions, terminology mapping reviews, and quality rule maintenance. This layer ensures that the pipeline improves over time through systematic review of quality failures.


