The healthcare industry is moving fast on AI agents — autonomous systems that can triage patients, summarize clinical notes, flag drug interactions, and generate discharge summaries. The models are getting better every quarter. But there is a question that almost nobody is asking: once you deploy an agentic AI in a hospital, how do you know what it is actually doing?
Traditional software has decades of observability tooling — logging, metrics, distributed tracing. But agentic AI is fundamentally different. An agent does not just take an input and produce an output. It reasons, plans, calls tools, retrieves data, retries on failure, branches on conditions, and makes autonomous decisions — sometimes across dozens of steps, touching multiple patient records, before producing a final result.
In healthcare, an unobserved AI agent is not just a technical risk. It is a clinical, legal, and regulatory liability. This article lays out why observability for agentic AI in healthcare is a non-negotiable prerequisite, and the specific framework you should build before deploying any agent into production.
Why Agentic AI Is Different from Traditional AI
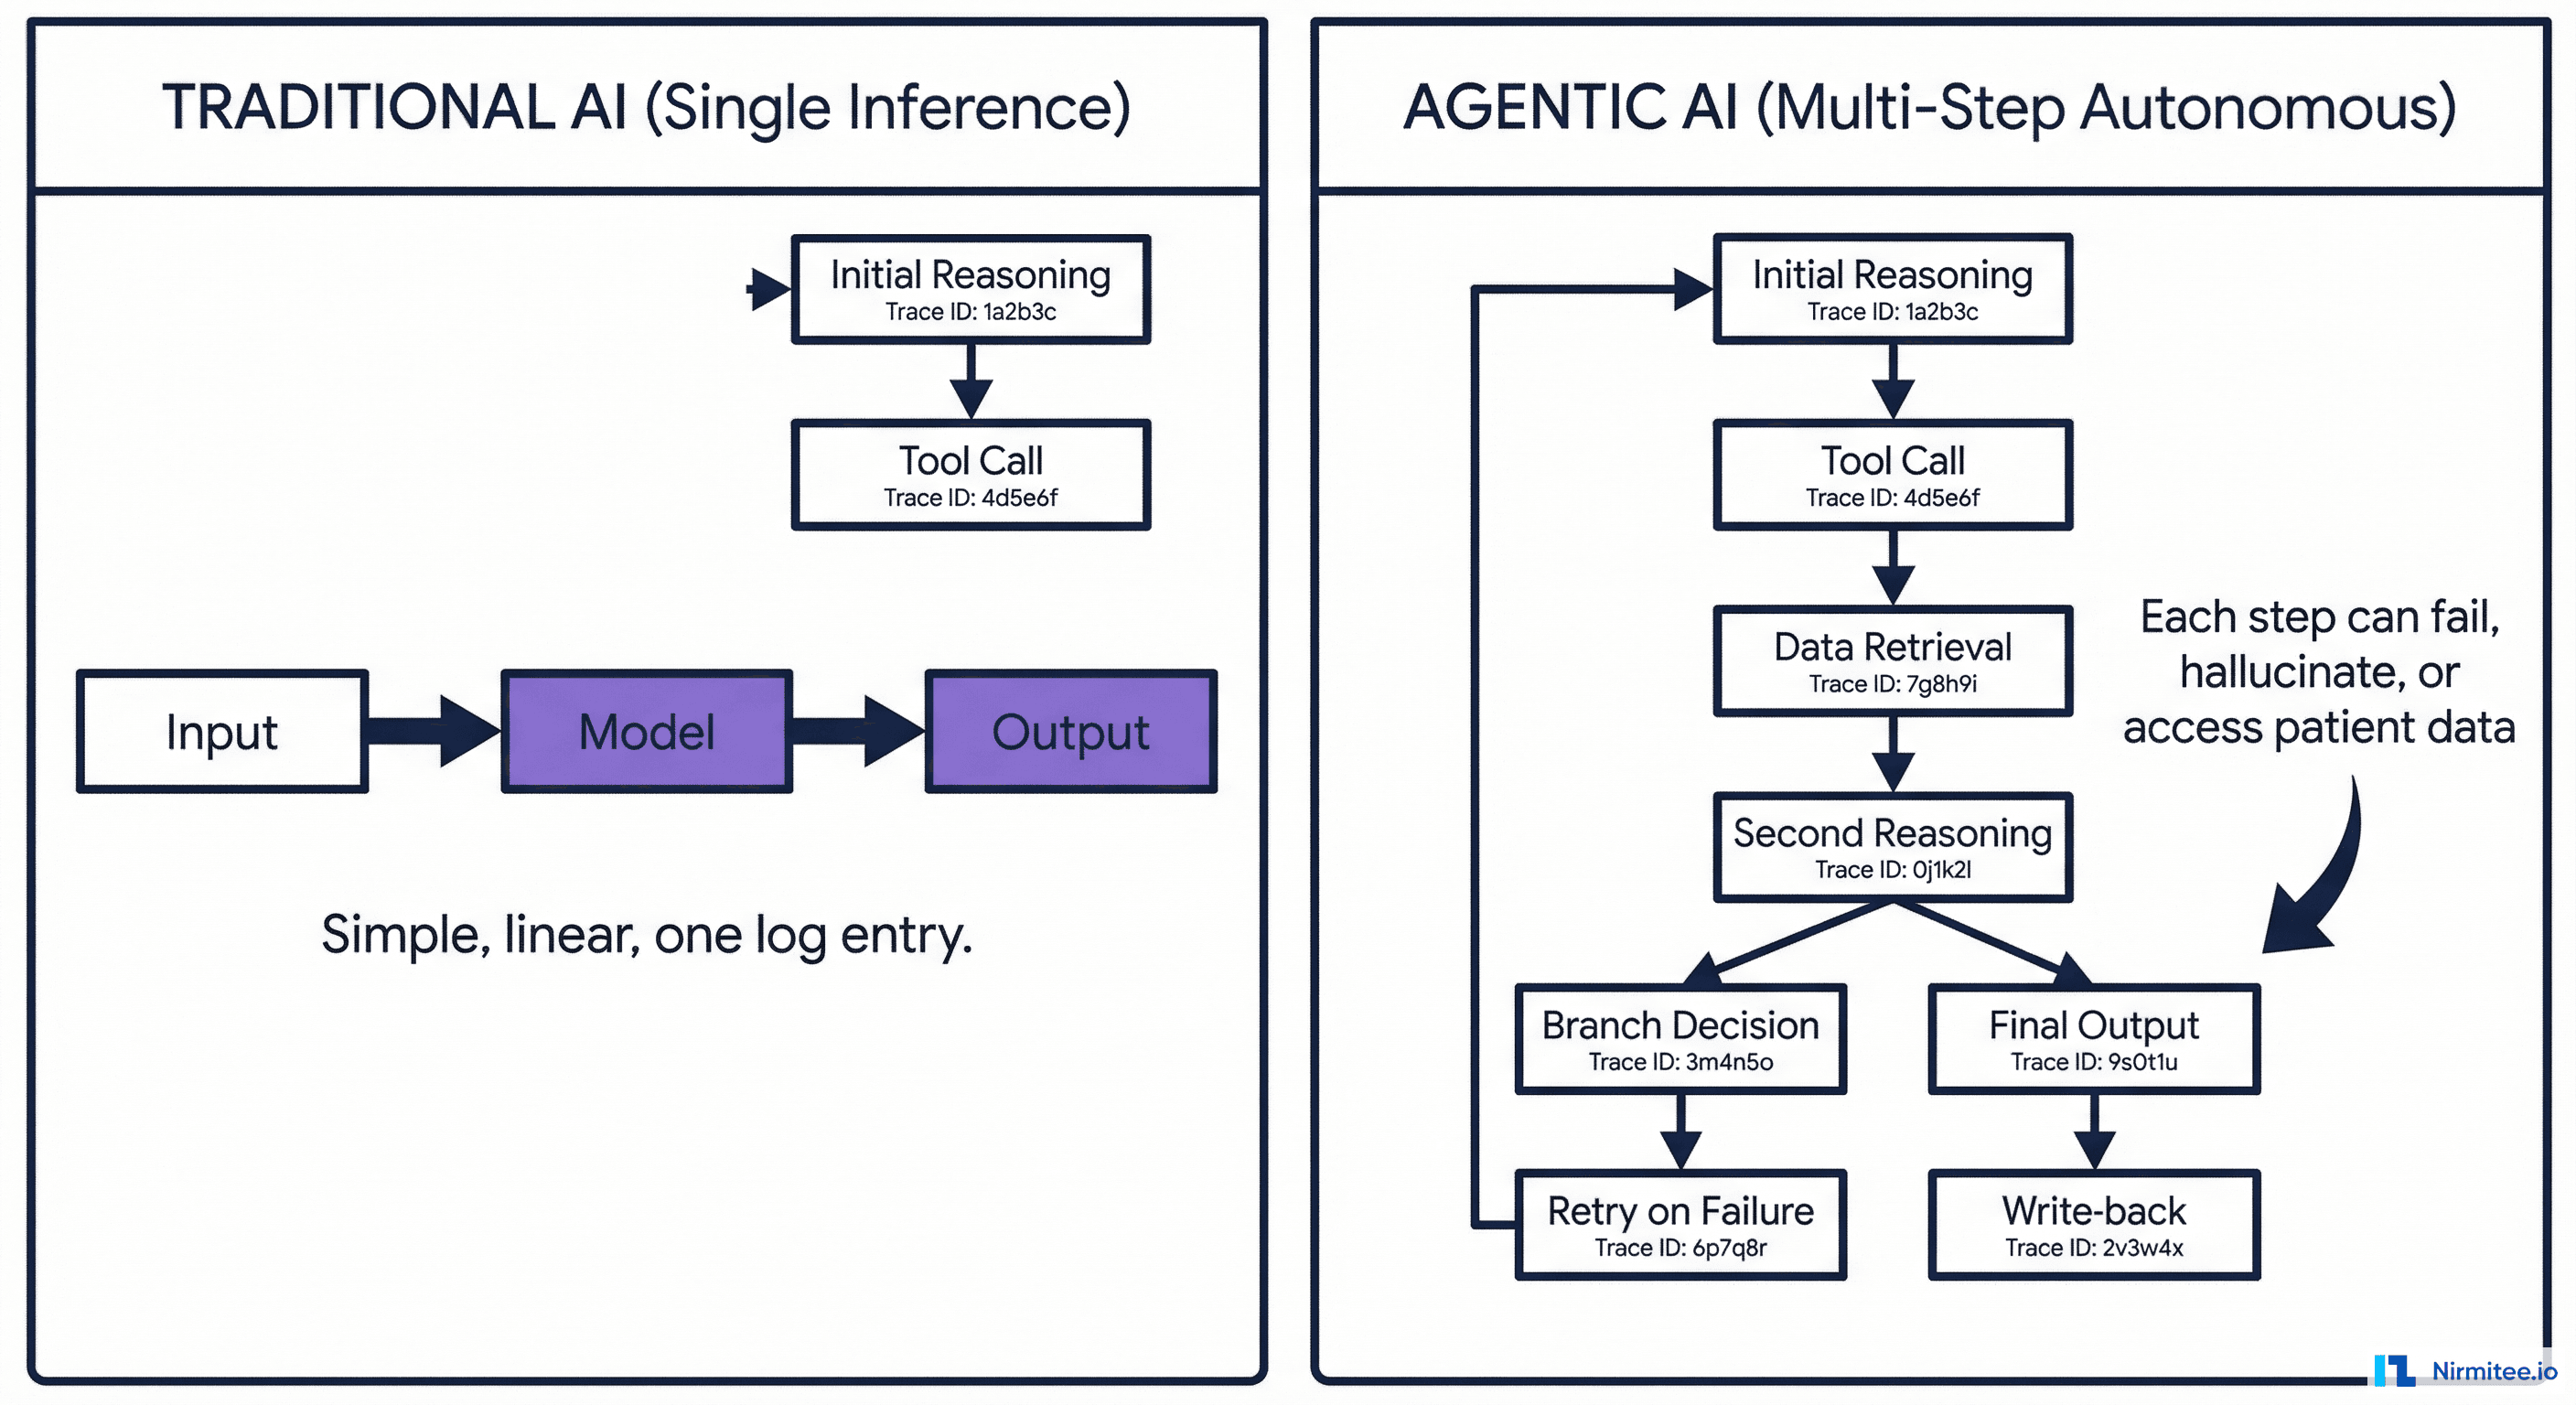
Understanding the distinction is critical because it determines the entire observability strategy.
Traditional AI (Single Inference)
- Input → Model → Output
- One call, one response, deterministic path
- Observability: log the input, output, latency, and confidence score. Done
Agentic AI (Multi-Step Autonomous)
- Receives a goal ("assess this patient for sepsis risk")
- Plans a sequence of steps autonomously
- Calls tools: queries the HIS for vitals, the LIMS for lab results, the pharmacy system for current medications
- Reasons over the retrieved data
- May branch: "lab results are 6 hours old — should I request a fresh draw or proceed with stale data?"
- May retry: "LIMS timed out, retrying..."
- May fall back: "LIMS still unreachable, using last known values"
- Generates a clinical assessment
- Writes the assessment back into the HIS
That is 8 to 15 autonomous decisions in a single agent run. Each step can succeed, fail, hallucinate, access patient data it should not, take too long, cost too much, or produce a subtly wrong intermediate result that compounds through the chain.
Traditional logging — "request in, response out" — captures none of this. You need a fundamentally different observability approach.
What Goes Wrong Without Observability
Here are real failure scenarios that happen in production agentic AI — all of which are invisible without proper observability:
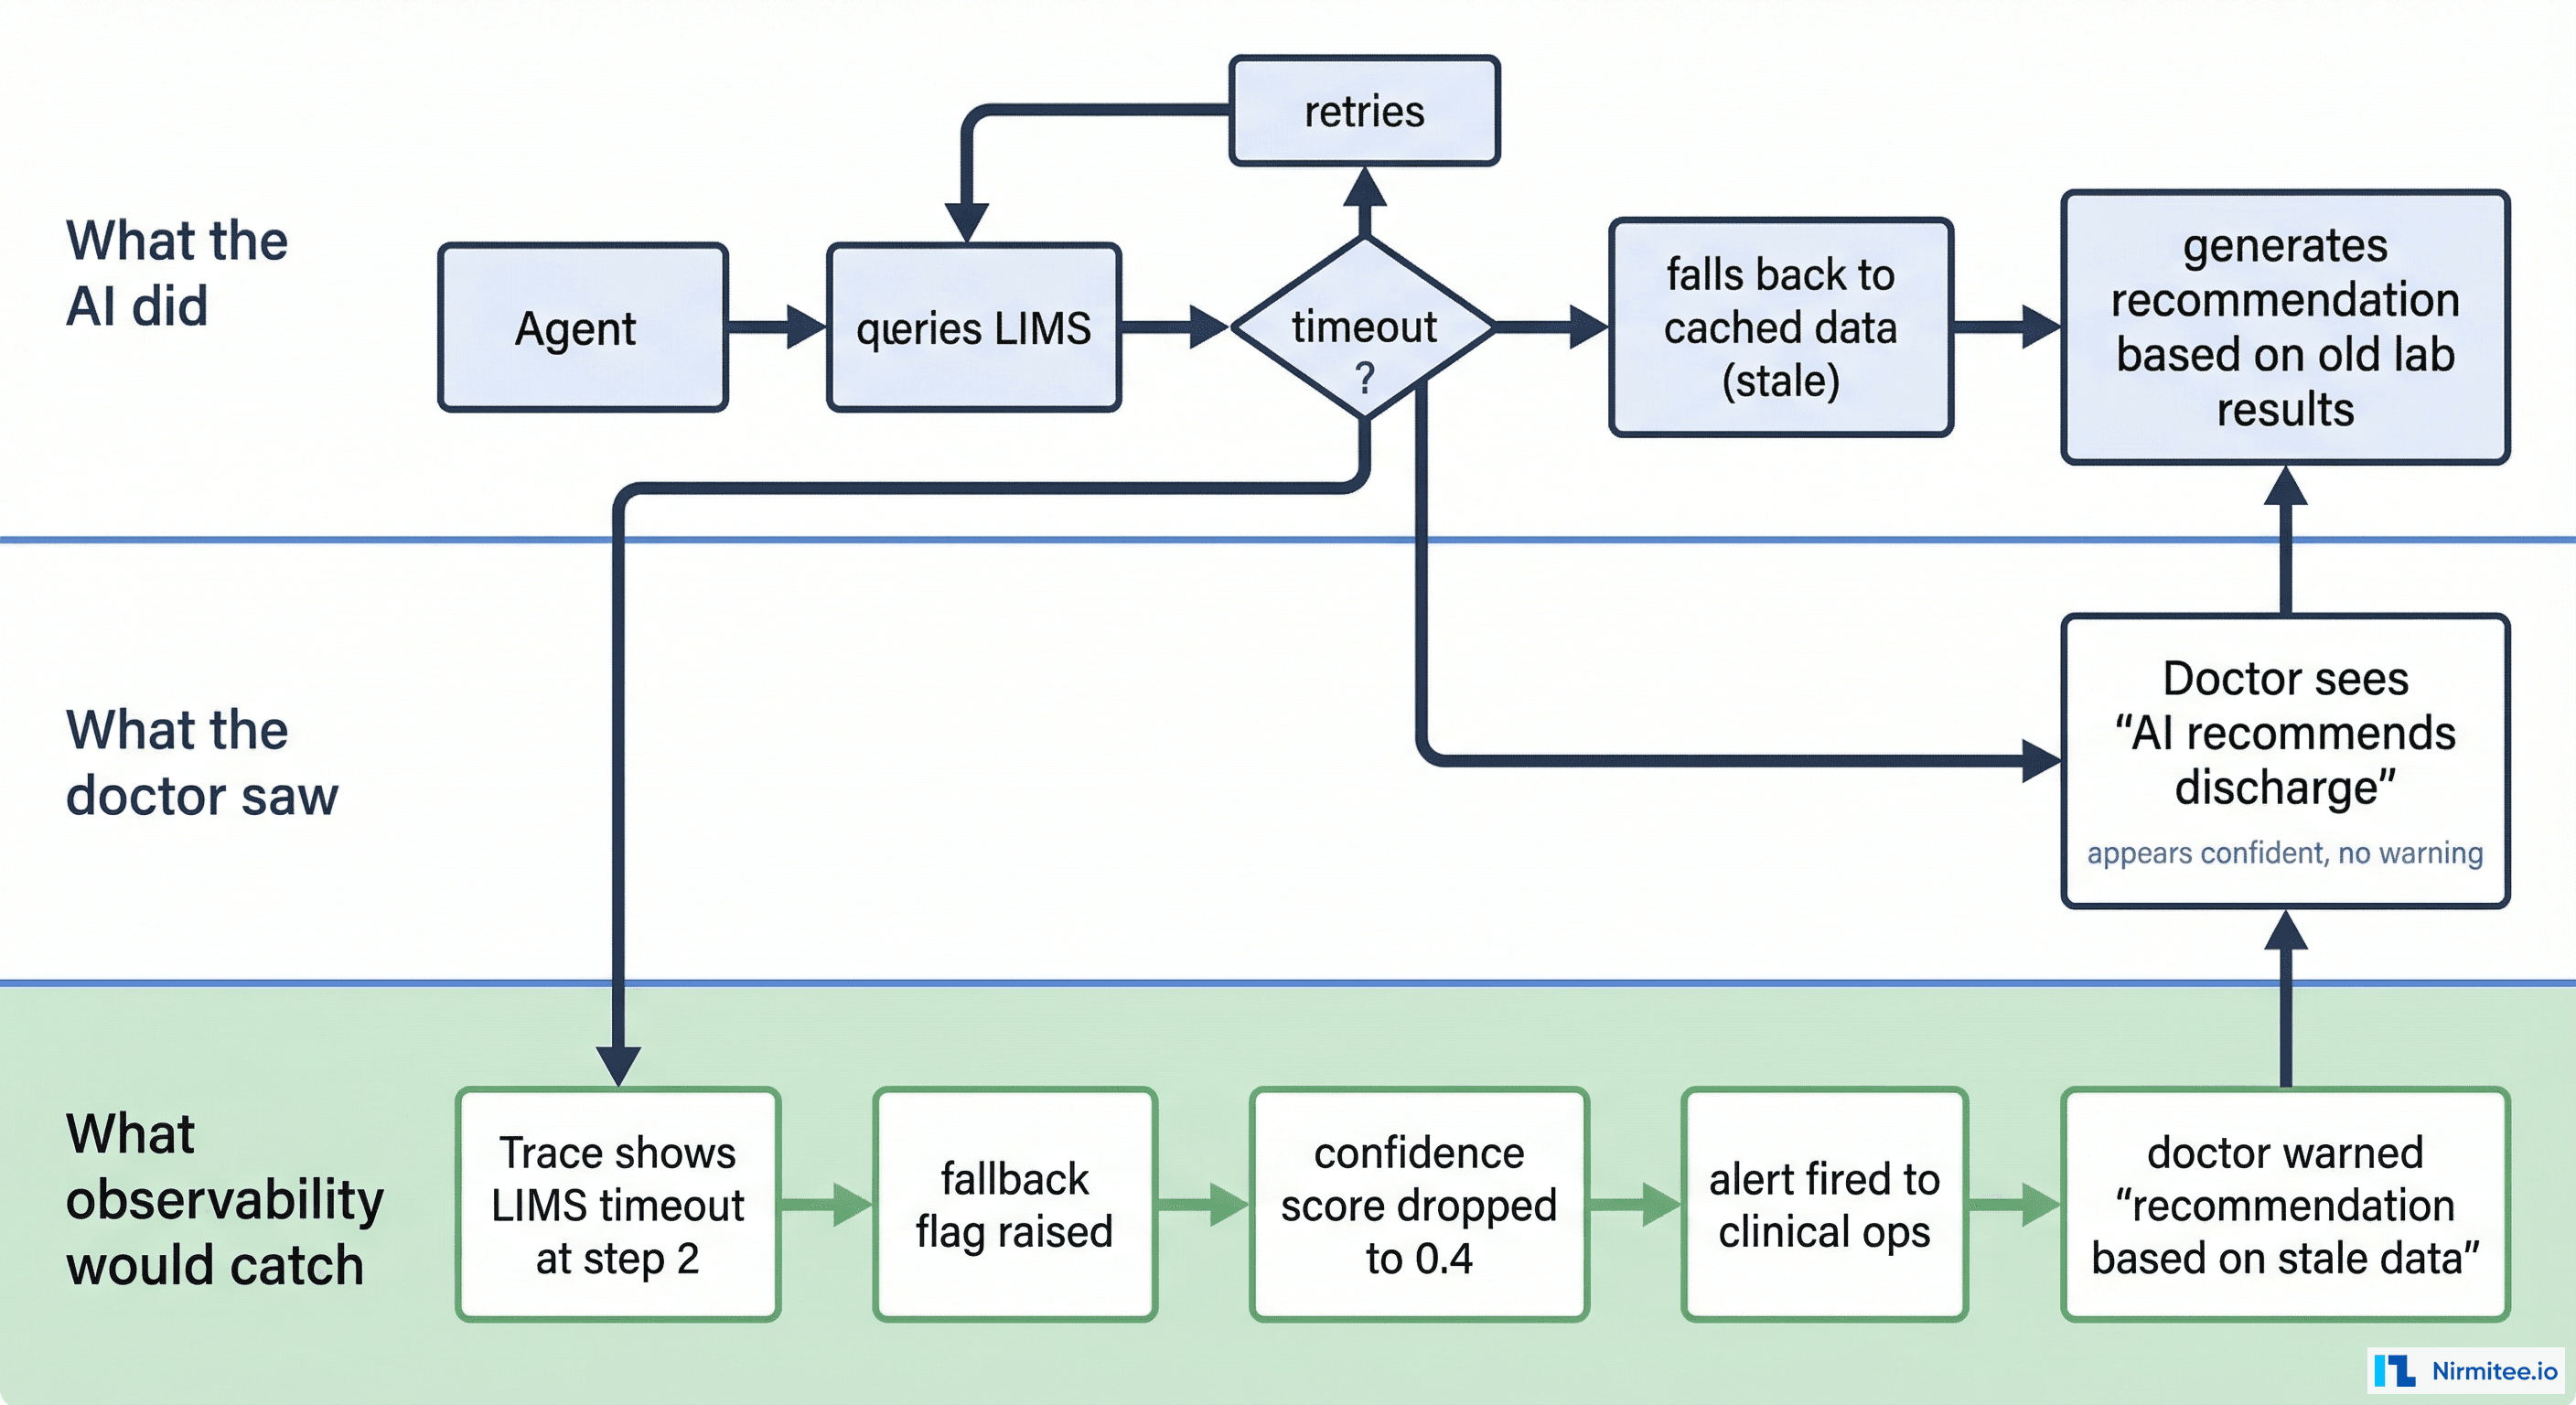
Scenario 1: The Silent Fallback
The agent queries the LIMS for the patient's latest CBC results. The LIMS is under load and times out. The agent retries twice, then silently falls back to cached lab results from 3 days ago. It generates a "patient stable, consider discharge" recommendation based on stale data.
What the doctor sees: A confident AI recommendation to discharge.
What actually happened: The recommendation is based on 72-hour-old lab values. The patient's current CBC might show a critical drop in hemoglobin.
What observability catches: The trace shows a LIMS timeout at step 3, a fallback flag, a data freshness warning, and an auto-generated alert: "recommendation based on stale data (72h old) — review manually."
Scenario 2: The Consent Overstep
The agent is assessing Patient A for drug interactions. During its reasoning, it decides it needs to check if Patient A was previously on a similar medication at another hospital. It calls the HIU fetch API and retrieves records from an external HIP. But the consent artefact only authorized access to data from this hospital, not external records.
Without observability: Nobody knows the agent accessed external records without proper consent scope.
With observability: Every data access is logged with the consent artefact ID, scope, and source. The consent monitoring layer flags the out-of-scope access in real-time.
Scenario 3: The Cost Spiral
A documentation agent is summarizing discharge notes. It encounters a complex case with 14 days of ICU notes and decides to process each day individually for accuracy. Each day requires 3 LLM calls. That is 42 LLM calls for one discharge summary. Across 50 discharges per day, the hospital is now burning 2,100 LLM calls daily — 10x the projected cost.
Without observability: The finance team notices the bill 30 days later.
With observability: Cost-per-decision tracking flags the anomaly within hours. The agent's step count per task is dashboarded, and the outlier is caught before it compounds.
Scenario 4: The Drift
A triage agent was calibrated to classify 15% of emergency patients as "critical." Over 6 weeks, the percentage gradually shifts to 25% because the underlying data distribution has changed (seasonal flu spike) but the agent's confidence thresholds have not been adjusted. More patients are being marked critical, overwhelming the ICU workflow.
Without observability: Staff notices "things feel busier" but attributes it to volume.
With observability: Distribution tracking detects the drift from 15% to 25% critical classifications and triggers an alert for model recalibration.
The Observability Framework for Healthcare AI Agents
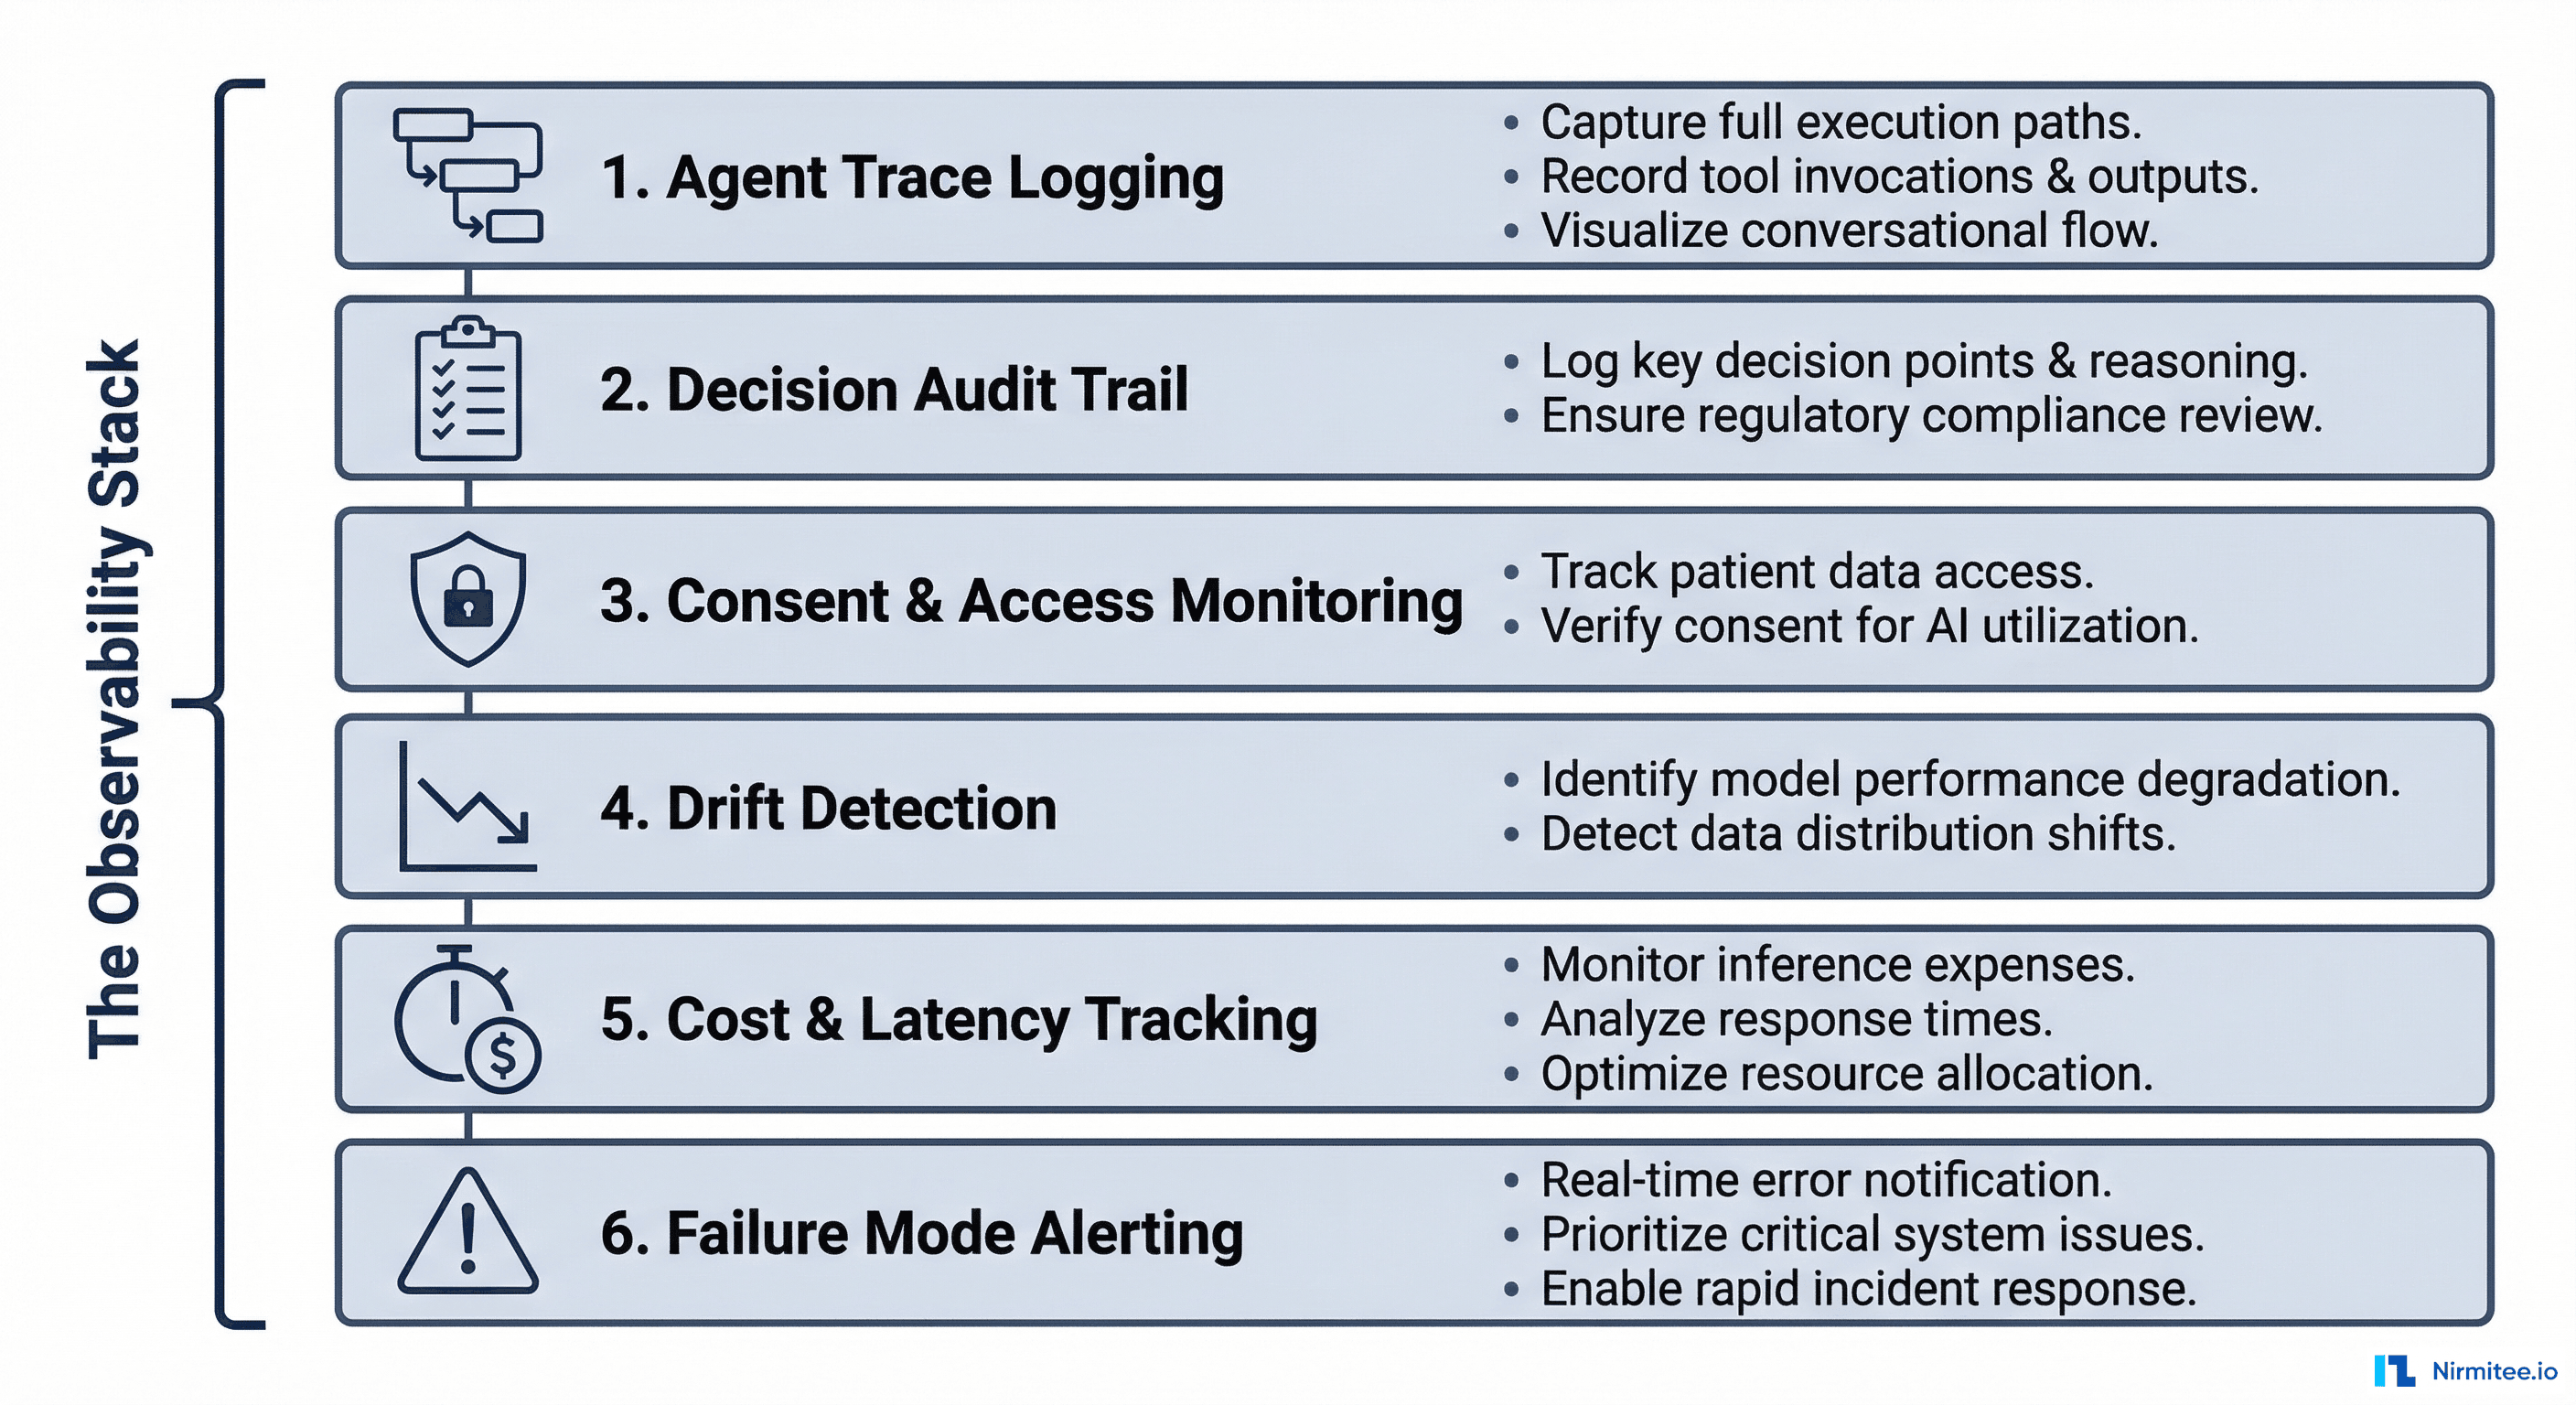
Here is the complete framework — six layers, each addressing a specific dimension of agentic AI observability in healthcare.
Layer 1: Agent Trace Logging
Just like distributed tracing for microservices (Jaeger, Zipkin), every agent execution should produce a trace composed of spans — one span per step in the agent's reasoning chain.
What each span must capture:
| Field | Purpose | Example |
|---|---|---|
trace_id | Links all spans in one agent execution | tr-a8f3c |
span_id | Unique ID for this step | sp-0042 |
parent_span_id | Which step triggered this one | sp-0041 |
step_type | What kind of action | tool_call, reasoning, data_retrieval, write_back |
system_accessed | Which hospital system was touched | LIMS, HIS, PACS |
patient_id | Which patient's data was involved | ABHA-1234-5678 |
consent_artefact_id | Under which consent this access happened | ca-9f8e7d |
latency_ms | How long this step took | 340 |
tokens_used | LLM tokens consumed (for reasoning steps) | 1,247 |
status | Success, failure, fallback, retry | fallback_stale_data |
output_summary | Brief description of what this step produced | "Retrieved 3 lab results, most recent 2h ago" |
Implementation: Use OpenTelemetry with custom span attributes. Every agent step emits a span. The trace collector aggregates them into a visual waterfall — identical to how you trace HTTP requests through microservices, but for AI reasoning chains.
// OpenTelemetry span for an agent step
span = tracer.start_span("query_lims_lab_results")
span.set_attribute("step_type", "data_retrieval")
span.set_attribute("system", "LIMS")
span.set_attribute("patient_id", "ABHA-1234-5678")
span.set_attribute("consent_id", "ca-9f8e7d")

try:
    results = lims_client.get_results(patient_id, date_range)
    span.set_attribute("status", "success")
    span.set_attribute("results_count", len(results))
    span.set_attribute("freshest_result_age_hours", calculate_age(results))
except TimeoutError:
    span.set_attribute("status", "timeout_fallback")
    span.set_attribute("fallback_data_age_hours", 72)
    results = cache.get_last_known(patient_id)
finally:
    span.end()
Layer 2: Decision Audit Trail
Beyond traces, healthcare requires a clinical decision audit trail — a record of not just what the AI decided, but why.
What the audit trail must include:
- Input data snapshot: Which specific data points influenced the decision (vitals values, lab results, medication list) — timestamped and versioned
- Reasoning chain: The agent's intermediate reasoning steps — "WBC count elevated (14,200), temperature 38.9°C, heart rate 112 → sepsis screening criteria met"
- Confidence score: How confident the agent is in its output (0.0 to 1.0)
- Alternatives considered: What other conclusions the agent evaluated and rejected — "considered viral infection (confidence 0.3), bacterial sepsis (confidence 0.8)"
- Human override record: If a clinician disagreed with the AI, what they chose instead and why
Why this matters legally: In a malpractice review, the question will not be "was the AI wrong?" — it will be "could the clinician have known the AI was unreliable for this specific decision?" The audit trail provides the answer. If the AI flagged low confidence and the clinician overrode it, the liability picture is completely different than if the AI presented a high-confidence wrong answer with no supporting evidence.
Layer 3: Consent and Access Monitoring
Under ABDM, every access to patient data must be tied to a valid consent artefact with specific scope, purpose, and expiry. An AI agent that autonomously accesses data must comply with the same rules as a human user.
The monitoring must track:
- Every patient record the agent accessed, with timestamp
- Which consent artefact authorized the access
- Whether the access was within the consent's scope (date range, data types, purpose)
- Whether the consent was valid (not expired, not revoked) at the time of access
- Alerts for any out-of-scope access attempt (even if blocked)
Implementation pattern: The integration middleware (between the agent and hospital systems) acts as a consent enforcement gateway. The agent never accesses data directly — it requests data through the middleware, which checks consent before forwarding.
// Consent-gated data access in middleware
func (m *Middleware) GetPatientData(agentID, patientID, dataType, consentID string) (FHIRBundle, error) {
    // 1. Validate consent
    consent, err := m.consentStore.Get(consentID)
    if err != nil || consent.IsExpired() {
        m.auditLog.Log(agentID, patientID, dataType, "BLOCKED_INVALID_CONSENT")
        return nil, ErrConsentInvalid
    }
    if !consent.CoversDataType(dataType) {
        m.auditLog.Log(agentID, patientID, dataType, "BLOCKED_OUT_OF_SCOPE")
        m.alertService.Fire("consent_scope_violation", agentID, patientID)
        return nil, ErrOutOfScope
    }

    // 2. Fetch data
    data, err := m.fetchFromSystem(patientID, dataType)

    // 3. Log access
    m.auditLog.Log(agentID, patientID, dataType, "ACCESS_GRANTED", consentID)
    return data, err
}
Layer 4: Drift Detection
AI models do not degrade with a bang — they drift silently. The data distribution changes, the model's behavior shifts, and clinical outcomes slowly worsen before anyone notices.
What to monitor:
| Metric | What It Detects | Alert Threshold Example |
|---|---|---|
| Output distribution | Is the agent classifying more patients as "critical" than baseline? | Greater than 20% deviation from 30-day rolling average |
| Confidence score distribution | Are confidence scores clustering lower? The model may be less certain | Median confidence drops below 0.65 |
| Human override rate | Are clinicians disagreeing with the AI more often? | Override rate exceeds 25% over 7 days |
| Input data characteristics | Has the incoming data changed (new lab test types, different coding standards)? | New ICD-10 codes appearing that were not in training data |
| Latency percentiles | Are agent runs taking longer? Could indicate more retries or larger data volumes | P95 latency exceeds 2x the 30-day baseline |
Implementation: Export agent metrics to a time-series database (Prometheus, InfluxDB). Build Grafana dashboards with automated alerting. Run weekly statistical tests (Kolmogorov-Smirnov, Population Stability Index) on output distributions.
Layer 5: Cost and Latency Tracking
Agentic AI is expensive. Each agent run may involve 5 to 20 LLM calls, each consuming thousands of tokens. Without tracking, costs spiral invisibly.
Track per agent run:
- Total tokens consumed (input + output, per model)
- Number of LLM calls (reasoning steps + retries)
- Number of tool calls (system queries, API calls)
- Total latency (wall clock time from start to final output)
- Cost in currency (tokens x per-token rate for the model used)
Track at aggregate level:
- Cost per patient interaction
- Cost per use case (triage vs. documentation vs. drug checking)
- Daily/weekly burn rate with trend forecasting
- Cost anomalies (single runs that cost 10x the median)
This is not just financial hygiene — it is an operational signal. A sudden spike in tokens-per-run often indicates the agent is struggling: retrying failed tool calls, processing unexpectedly large records, or stuck in reasoning loops.
Layer 6: Failure Mode Alerting
Agentic AI fails in ways that traditional software does not. Your alerting must cover:
| Failure Mode | How to Detect | Response |
|---|---|---|
| Hallucination | Agent references data that does not exist in the retrieved context (fact-checking layer) | Flag output as unverified, require human review |
| Infinite loop | Step count exceeds maximum (e.g., 30 steps for a task that normally takes 8) | Kill the run, alert ops, return safe default |
| Silent fallback | Agent used cached/stale data after a system timeout | Mark output with data freshness warning |
| Partial data | Agent could only reach 3 of 5 required systems | Flag confidence as reduced, list missing data sources |
| Consent violation attempt | Agent tried to access data outside consent scope (blocked by middleware) | Log the attempt, alert compliance team, review agent logic |
| Write-back failure | Agent generated output but failed to write it into the HIS | Queue for retry, alert if retry fails, ensure output is not lost |
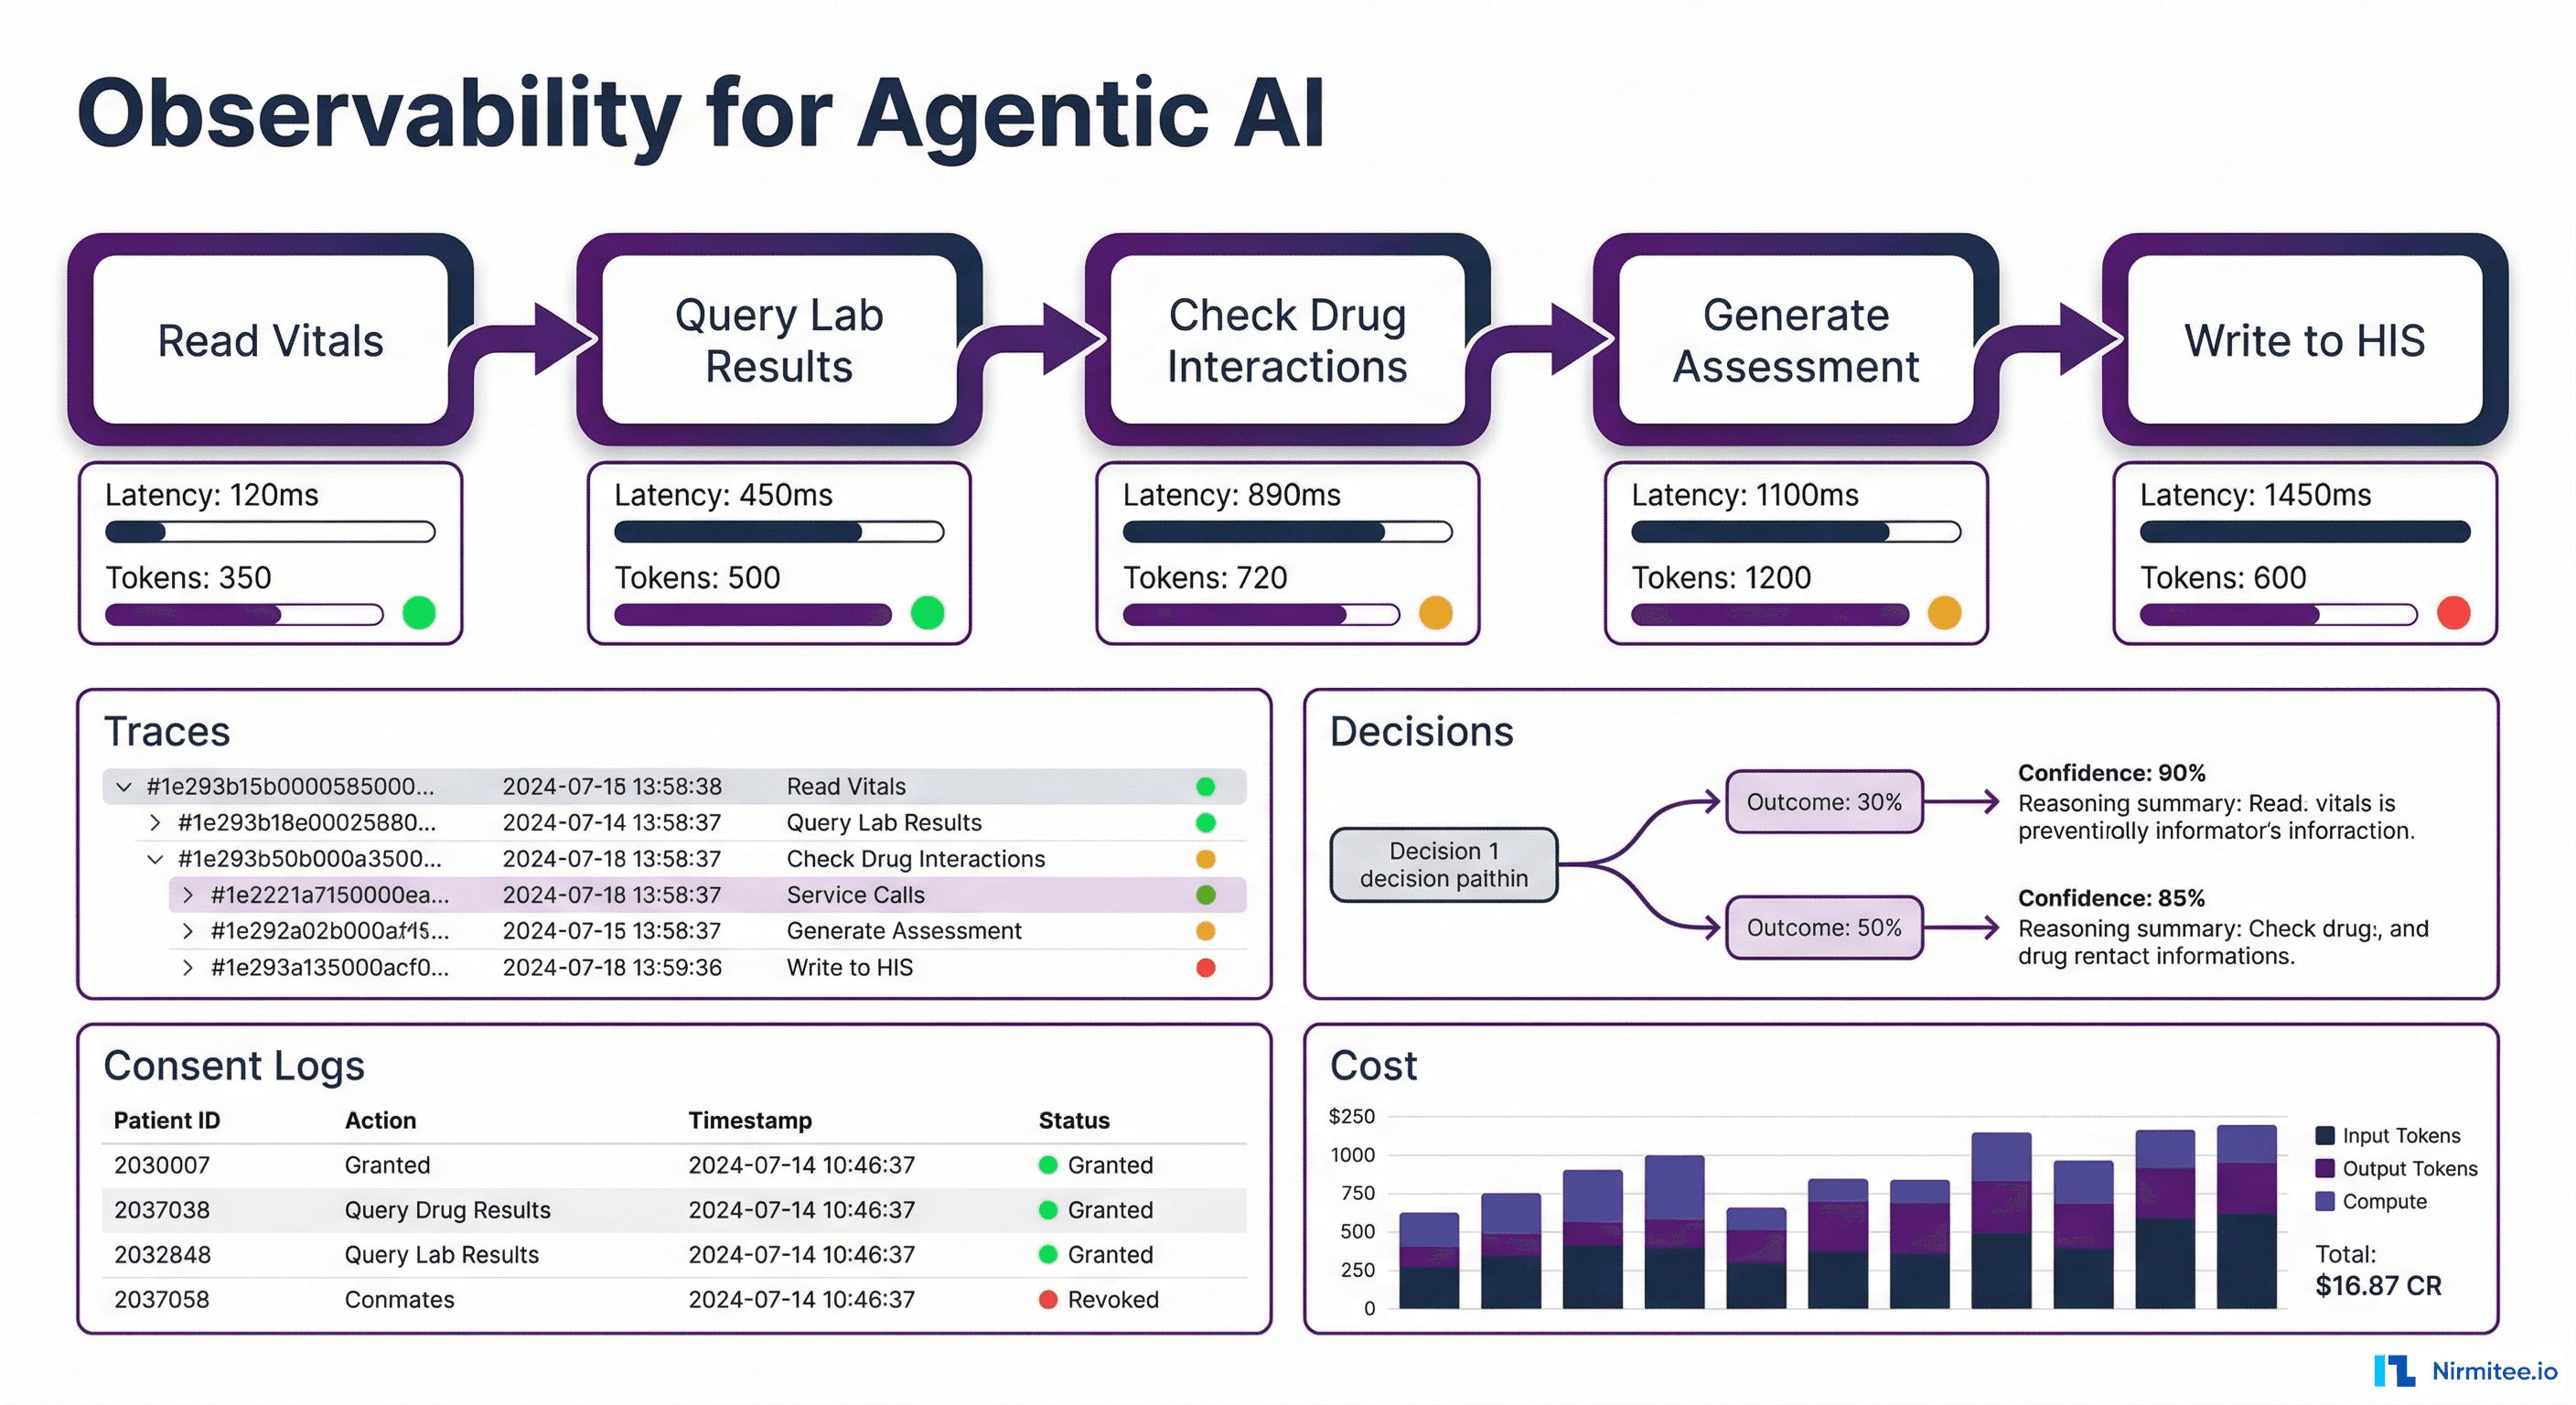
Putting It Together: The Healthcare AI Ops Dashboard
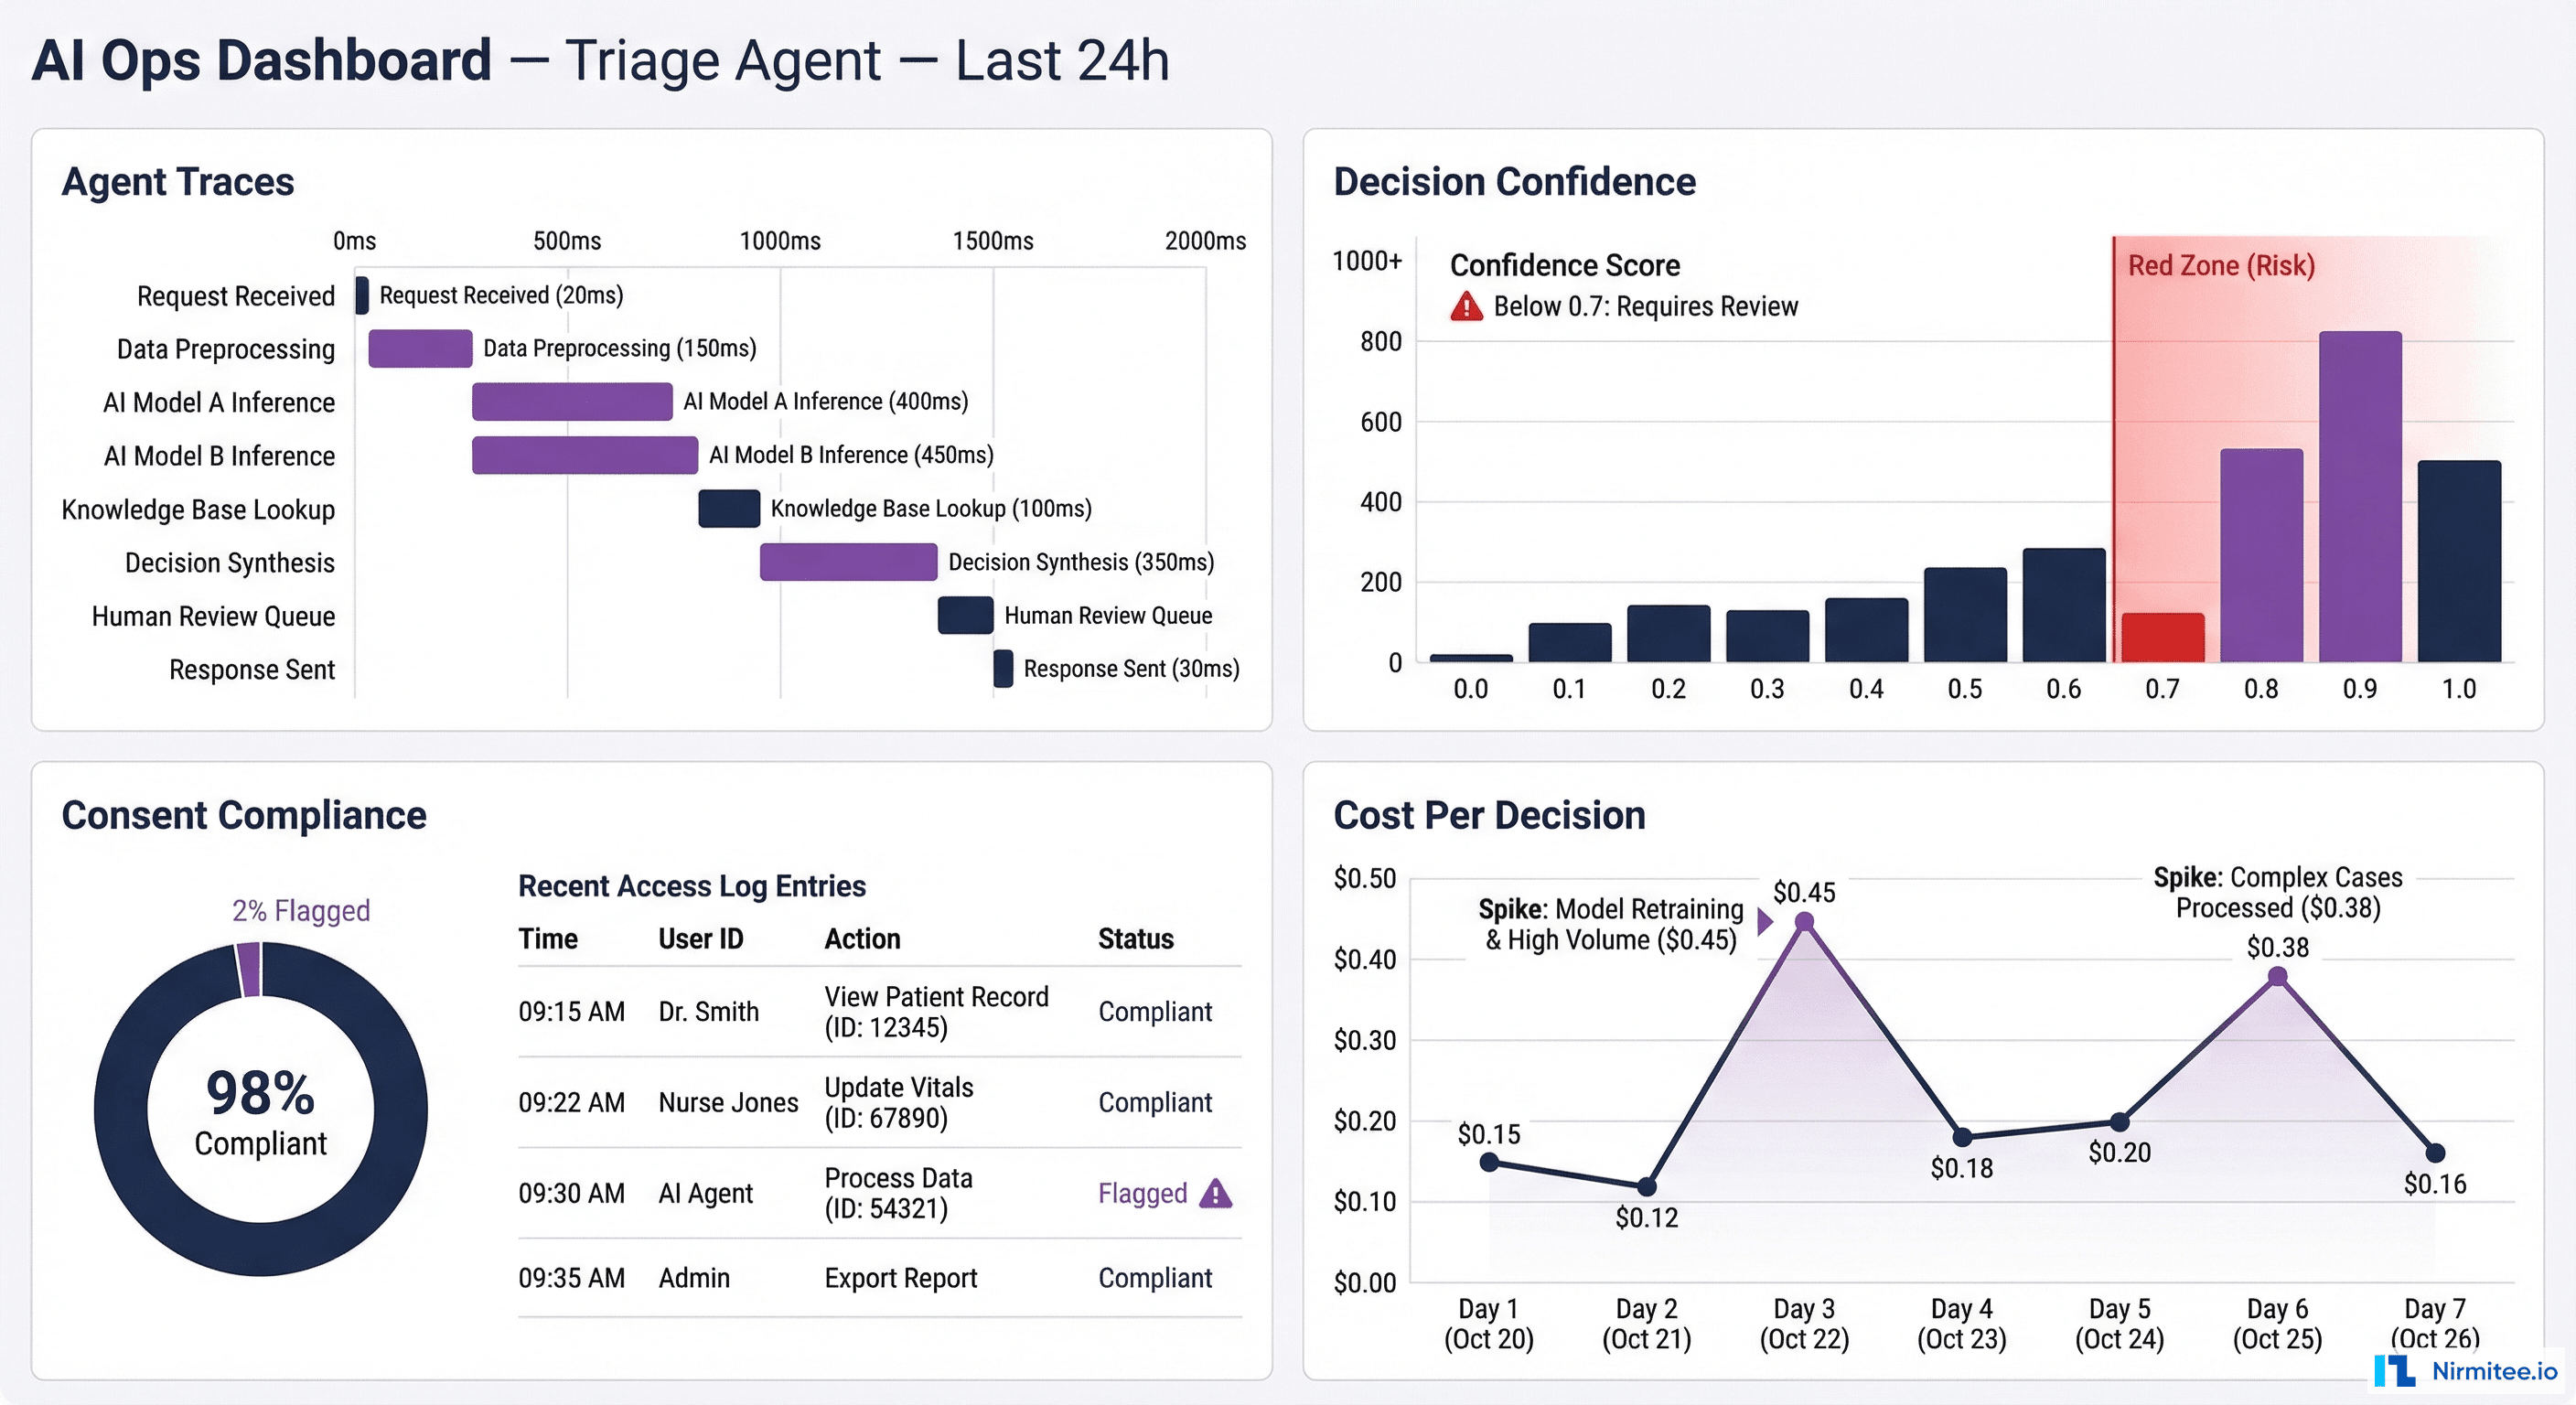
All six layers feed into a unified AI Operations Dashboard — the single pane of glass for clinical AI ops teams. Here is what it should show:
Real-time panel:
- Active agent runs (count, which use cases, which facilities)
- Current error rate and fallback rate
- Consent compliance status (any violations in last 24h?)
- System connectivity status (is LIMS responding? PACS? HIS?)
Trend panel:
- Decision distribution over time (drift detection)
- Human override rate trending
- Cost per decision trending
- Confidence score distribution shift
Drill-down panel:
- Click any agent run → see the full trace waterfall (every span, every tool call, every data access)
- Click any patient → see all AI interactions with that patient, under which consents
- Click any alert → see root cause, affected patients, recommended action
The Regulatory Non-Negotiables
In healthcare, observability is not optional engineering best practice — it is a regulatory requirement:
- ABDM mandates audit trails for all health data access. If your AI agent accesses patient records through ABDM flows (consent, data fetch, data push), every access must be logged with consent artefact ID, timestamp, and purpose
- Medical device regulations (if the AI qualifies as a software-as-medical-device or SaMD) require traceability of all decisions that influence clinical care
- Medicolegal protection requires that when an AI-influenced clinical decision is questioned, the hospital can produce a complete record of what the AI saw, what it recommended, how confident it was, and whether the clinician agreed or overrode it
- Data protection laws require logging of all personal data access with purpose, duration, and scope — the consent monitoring layer provides this automatically
Implementation Roadmap: Start Here
You do not need to build all six layers at once. Here is the phased approach:
| Phase | Layers | Timeline | Outcome |
|---|---|---|---|
| Phase 1 | Agent Trace Logging + Failure Mode Alerting | Week 1-2 | You can see what the agent is doing and know when it fails |
| Phase 2 | Consent Monitoring + Decision Audit Trail | Week 3-4 | Regulatory compliance, medicolegal protection |
| Phase 3 | Cost/Latency Tracking + Drift Detection | Week 5-6 | Operational efficiency, long-term model health |
| Phase 4 | Unified Dashboard + Automated Alerts | Week 7-8 | Single pane of glass for AI ops team |
Technology stack recommendation:
- Tracing: OpenTelemetry SDK (language-native) → Jaeger or Grafana Tempo for trace storage and visualization
- Metrics: Prometheus for time-series metrics → Grafana for dashboards and alerting
- Audit logs: Append-only structured log store (Elasticsearch or a dedicated audit database) — immutable, tamper-evident
- Consent tracking: Built into your ABDM integration middleware — not a separate system
- Drift detection: Scheduled statistical jobs (Python + scipy) comparing current vs. baseline distributions
How Nirmitee Builds Observable AI
At Nirmitee, observability is not a layer we add after deployment — it is built into the integration middleware from day one:
- Every data access through our middleware is traced and consent-checked — whether the requester is a human user or an AI agent, the same audit trail applies
- FHIR-based integration layer doubles as the observability boundary — since all data flows through our middleware, every access point is automatically instrumented
- ABDM compliance gives you half the framework for free — consent artefact management, encrypted data exchange, and audit logging are already built for M2/M3 compliance. Extending them to cover AI agent access is incremental, not greenfield
- Agent-agnostic design — whether you use GPT-4, Claude, an open-source clinical LLM, or a custom model, the observability layer wraps around the agent, not inside it
The hospitals that will succeed with AI are not the ones with the best models — they are the ones that can see what their AI is doing, prove it to regulators, and catch problems before patients are affected. That starts with observability. Talk to us about building it into your healthcare AI stack from the ground up.
Share
Related Posts
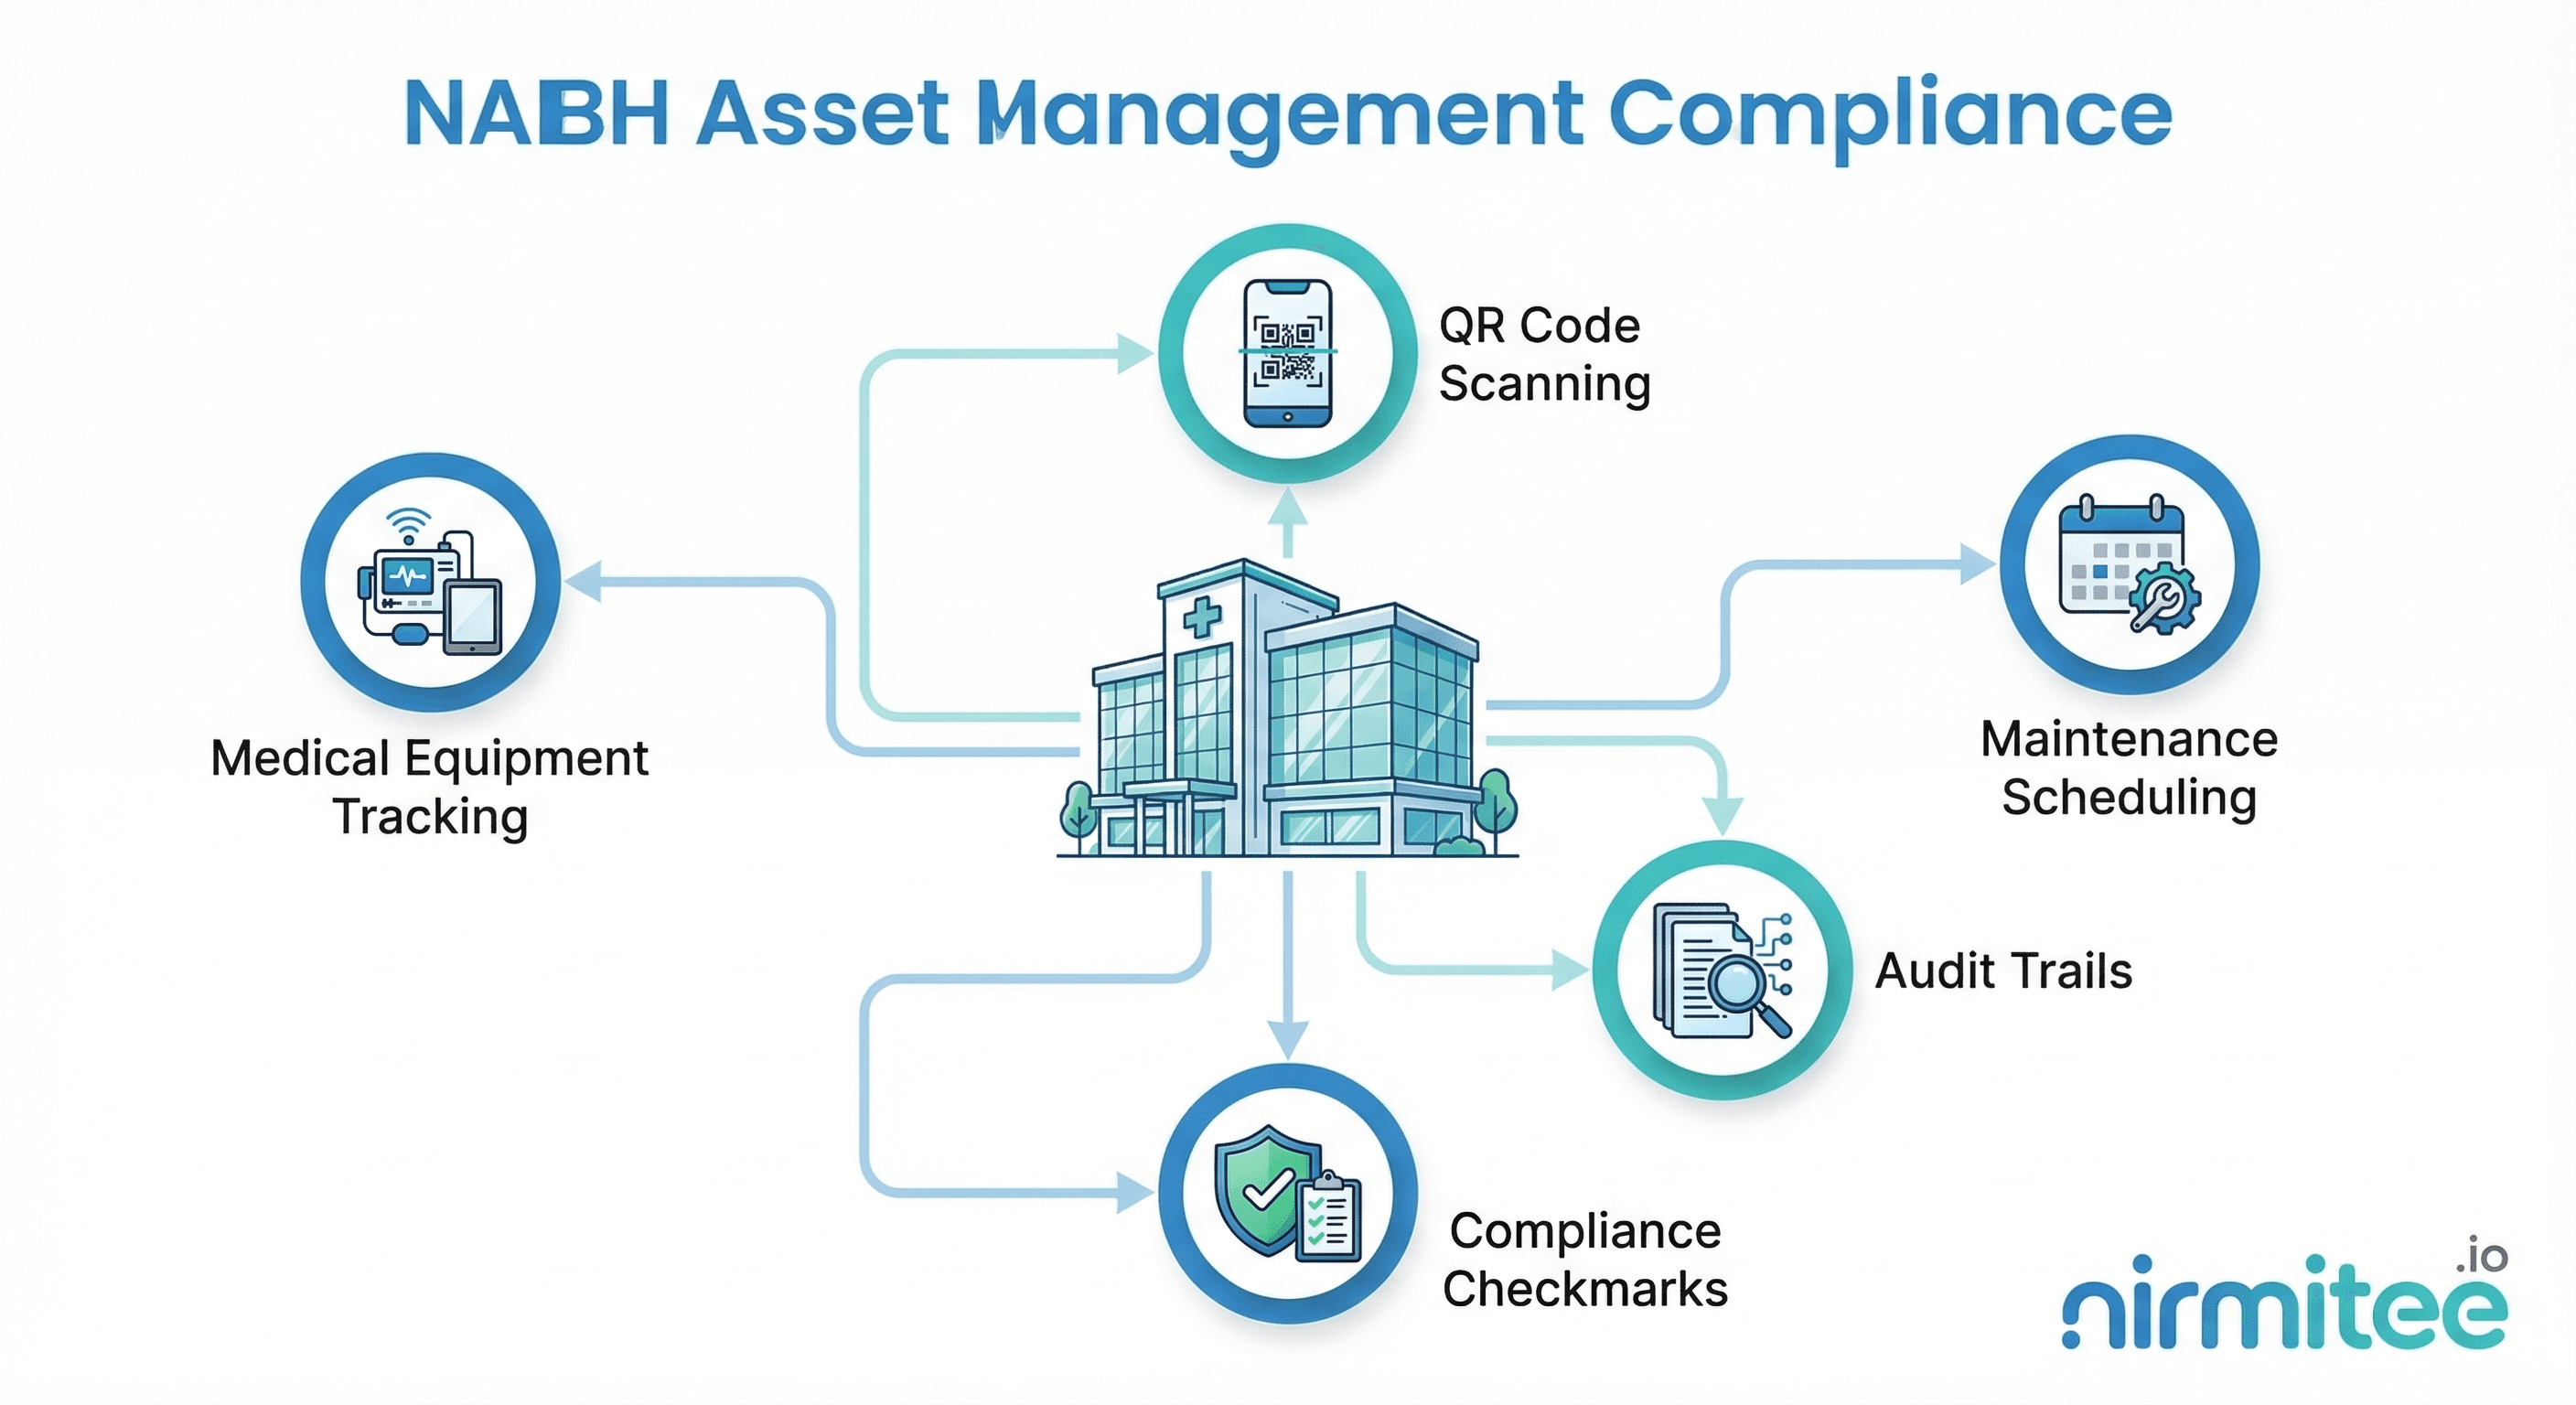
NABH Asset Management Compliance: A Complete Guide for Indian Hospitals
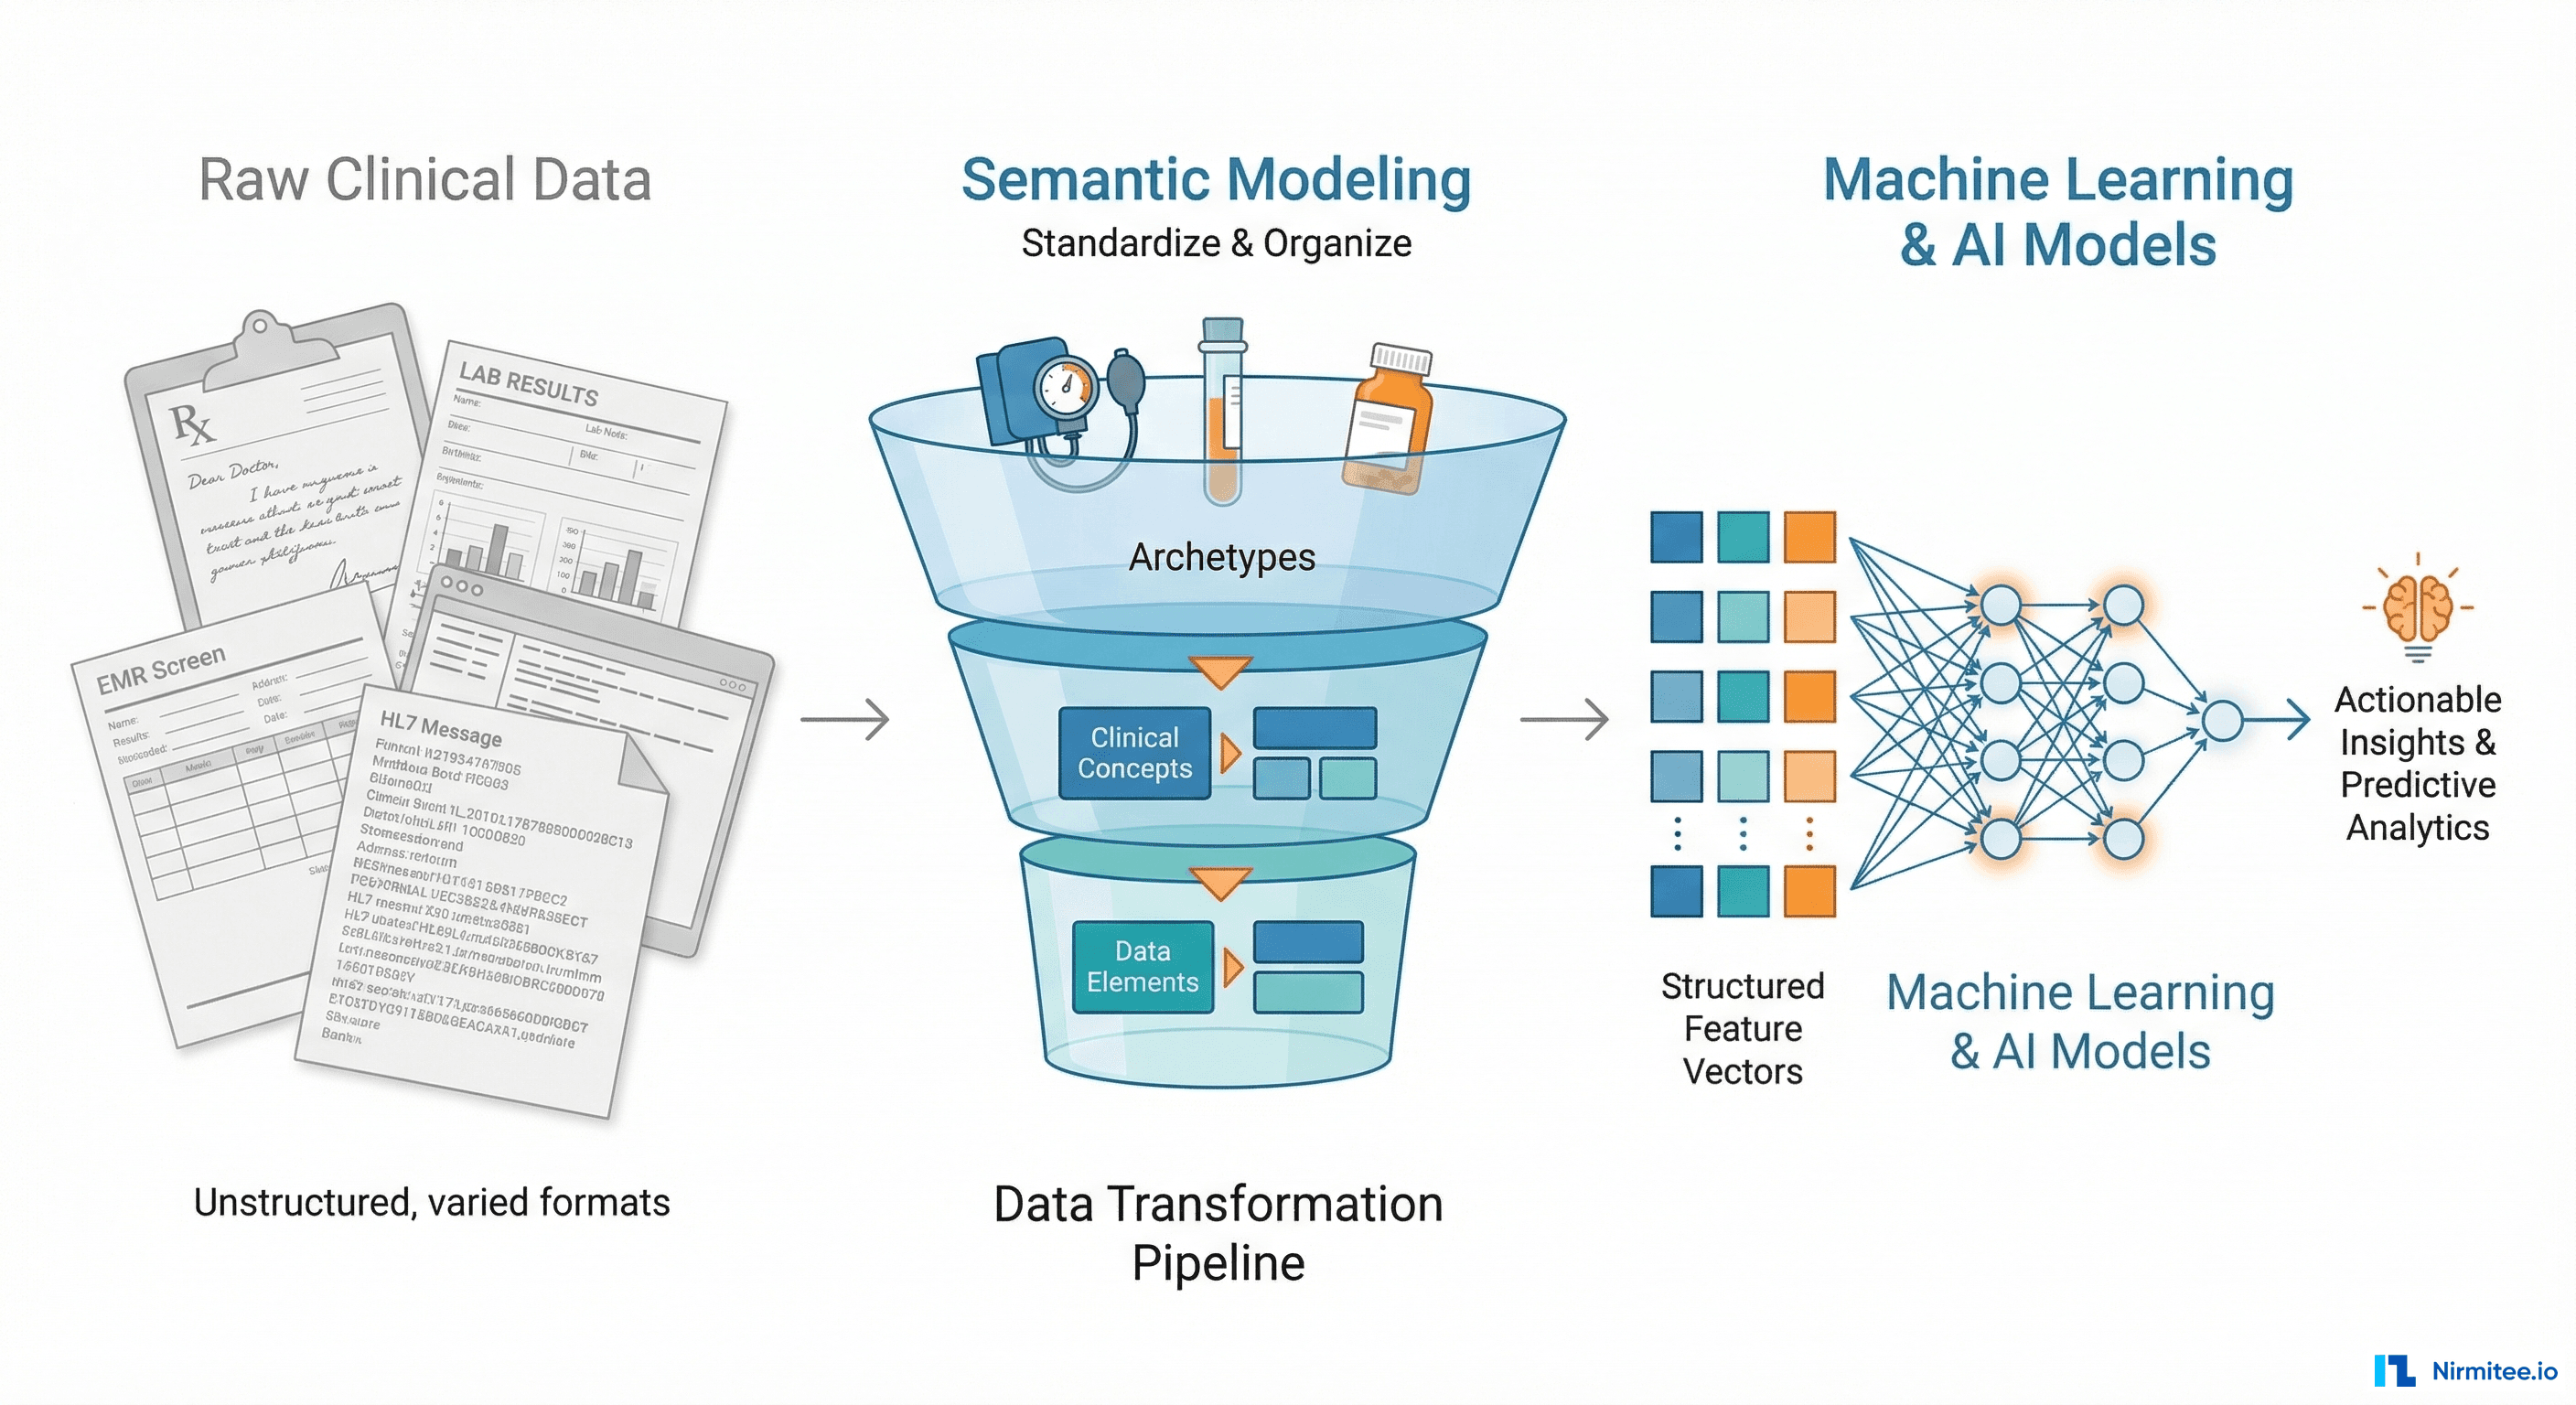
Why openEHR Makes Your Clinical Data AI-Ready (And Most EHR Architectures Don't)