The End-User Payoff: From Data Pipeline to Clinical Insight
Every data engineering effort — the FHIR-to-OMOP ETL pipelines, the Snowflake data warehouses, the governance frameworks — ultimately exists to serve one purpose: putting actionable clinical insights in front of the people who need them. That means dashboards. Not static PDF reports emailed monthly, but interactive, near real-time visualizations that a chief medical officer, a quality director, or a care manager can use to make decisions today.
Apache Superset is the leading open-source BI platform for healthcare analytics. It connects directly to your clinical data warehouse (Snowflake, PostgreSQL, Delta Lake via Trino), supports row-level security for PHI, embeds cleanly into clinical applications, and costs nothing to license. This guide covers the full implementation: deploying Superset, connecting to FHIR-derived data, building the six essential clinical dashboards, and embedding analytics into clinical workflows.
Architecture: FHIR Data to Interactive Dashboards
Pipeline Overview
The end-to-end architecture connects your EHR systems to interactive dashboards through a series of well-defined layers:
- EHR Systems (Epic, Oracle Health, MEDITECH) expose data via FHIR Bulk Export and FHIR Subscriptions
- Data Lake / Warehouse (Snowflake, Delta Lake, PostgreSQL) stores, transforms, and serves the data
- Semantic Layer defines the clinical KPIs, aggregation rules, and access controls
- Apache Superset renders interactive charts, dashboards, and embedded analytics
Deploying Apache Superset for Healthcare
Docker Compose Setup
# docker-compose-superset.yaml
# Production-ready Apache Superset for clinical dashboards
version: '3.8'

x-superset-common: &superset-common
  image: apache/superset:3.1.0
  environment:
    - SUPERSET_SECRET_KEY=your-secret-key-min-42-chars-change-in-production
    - SQLALCHEMY_DATABASE_URI=postgresql://superset:superset_pwd@superset-db:5432/superset
    - REDIS_URL=redis://superset-redis:6379/0
    - SUPERSET_LOAD_EXAMPLES=false
    # Security settings for healthcare
    - ROW_LEVEL_SECURITY=true
    - TALISMAN_ENABLED=true
    - SESSION_COOKIE_HTTPONLY=true
    - SESSION_COOKIE_SECURE=true
    - WTF_CSRF_ENABLED=true
  volumes:
    - ./superset_config.py:/app/pythonpath/superset_config.py

services:
  superset-db:
    image: postgres:16
    environment:
      POSTGRES_DB: superset
      POSTGRES_USER: superset
      POSTGRES_PASSWORD: superset_pwd
    volumes:
      - superset-db-data:/var/lib/postgresql/data
    healthcheck:
      test: ["CMD-SHELL", "pg_isready -U superset"]
      interval: 10s
      timeout: 5s
      retries: 5

  superset-redis:
    image: redis:7
    volumes:
      - superset-redis-data:/data
    healthcheck:
      test: ["CMD", "redis-cli", "ping"]
      interval: 10s

  superset:
    <<: *superset-common
    ports:
      - "8088:8088"
    depends_on:
      superset-db:
        condition: service_healthy
      superset-redis:
        condition: service_healthy
    command: >
      bash -c "
        superset db upgrade &&
        superset fab create-admin --username admin --firstname Admin
          --lastname User --email admin@hospital.org --password admin123 &&
        superset init &&
        superset run -h 0.0.0.0 -p 8088
      "

  superset-worker:
    <<: *superset-common
    depends_on:
      superset-db:
        condition: service_healthy
      superset-redis:
        condition: service_healthy
    command: celery --app=superset.tasks.celery_app:app worker
      --pool=prefork --concurrency=4

  superset-beat:
    <<: *superset-common
    depends_on:
      superset-db:
        condition: service_healthy
      superset-redis:
        condition: service_healthy
    command: celery --app=superset.tasks.celery_app:app beat
      --schedule=/tmp/celerybeat-schedule

volumes:
  superset-db-data:
  superset-redis-data:
Superset Configuration for Healthcare
# superset_config.py
# Healthcare-specific Superset configuration

import os
from datetime import timedelta

# Security
SECRET_KEY = os.environ.get("SUPERSET_SECRET_KEY")
SESSION_COOKIE_HTTPONLY = True
SESSION_COOKIE_SECURE = True
SESSION_COOKIE_SAMESITE = "Lax"
PERMANENT_SESSION_LIFETIME = timedelta(hours=8)  # shift-based timeout

# Row-Level Security (critical for PHI)
ROW_LEVEL_SECURITY = True

# Authentication: SAML SSO for enterprise
AUTH_TYPE = 5  # AUTH_OAUTH
OAUTH_PROVIDERS = [
    {
        "name": "hospital_sso",
        "icon": "fa-hospital",
        "token_key": "access_token",
        "remote_app": {
            "client_id": os.environ.get("OAUTH_CLIENT_ID"),
            "client_secret": os.environ.get("OAUTH_CLIENT_SECRET"),
            "api_base_url": "https://sso.hospital.org/",
            "access_token_url": "https://sso.hospital.org/oauth/token",
            "authorize_url": "https://sso.hospital.org/oauth/authorize",
            "client_kwargs": {"scope": "openid profile email groups"},
        },
    }
]

# Database connections
SQLALCHEMY_DATABASE_URI = os.environ.get("SQLALCHEMY_DATABASE_URI")

# Caching for dashboard performance
CACHE_CONFIG = {
    "CACHE_TYPE": "RedisCache",
    "CACHE_DEFAULT_TIMEOUT": 300,
    "CACHE_KEY_PREFIX": "superset_",
    "CACHE_REDIS_URL": os.environ.get("REDIS_URL"),
}

DATA_CACHE_CONFIG = {
    "CACHE_TYPE": "RedisCache",
    "CACHE_DEFAULT_TIMEOUT": 600,  # 10 min for clinical data
    "CACHE_KEY_PREFIX": "superset_data_",
    "CACHE_REDIS_URL": os.environ.get("REDIS_URL"),
}

# Query limits for PHI safety
ROW_LIMIT = 50000
SQL_MAX_ROW = 100000
SUPERSET_WEBSERVER_TIMEOUT = 120

# Embedding configuration
FEATURE_FLAGS = {
    "EMBEDDED_SUPERSET": True,
    "DASHBOARD_RBAC": True,
    "ENABLE_TEMPLATE_PROCESSING": True,
    "ALERT_REPORTS": True,
}
The Six Essential Clinical Dashboards
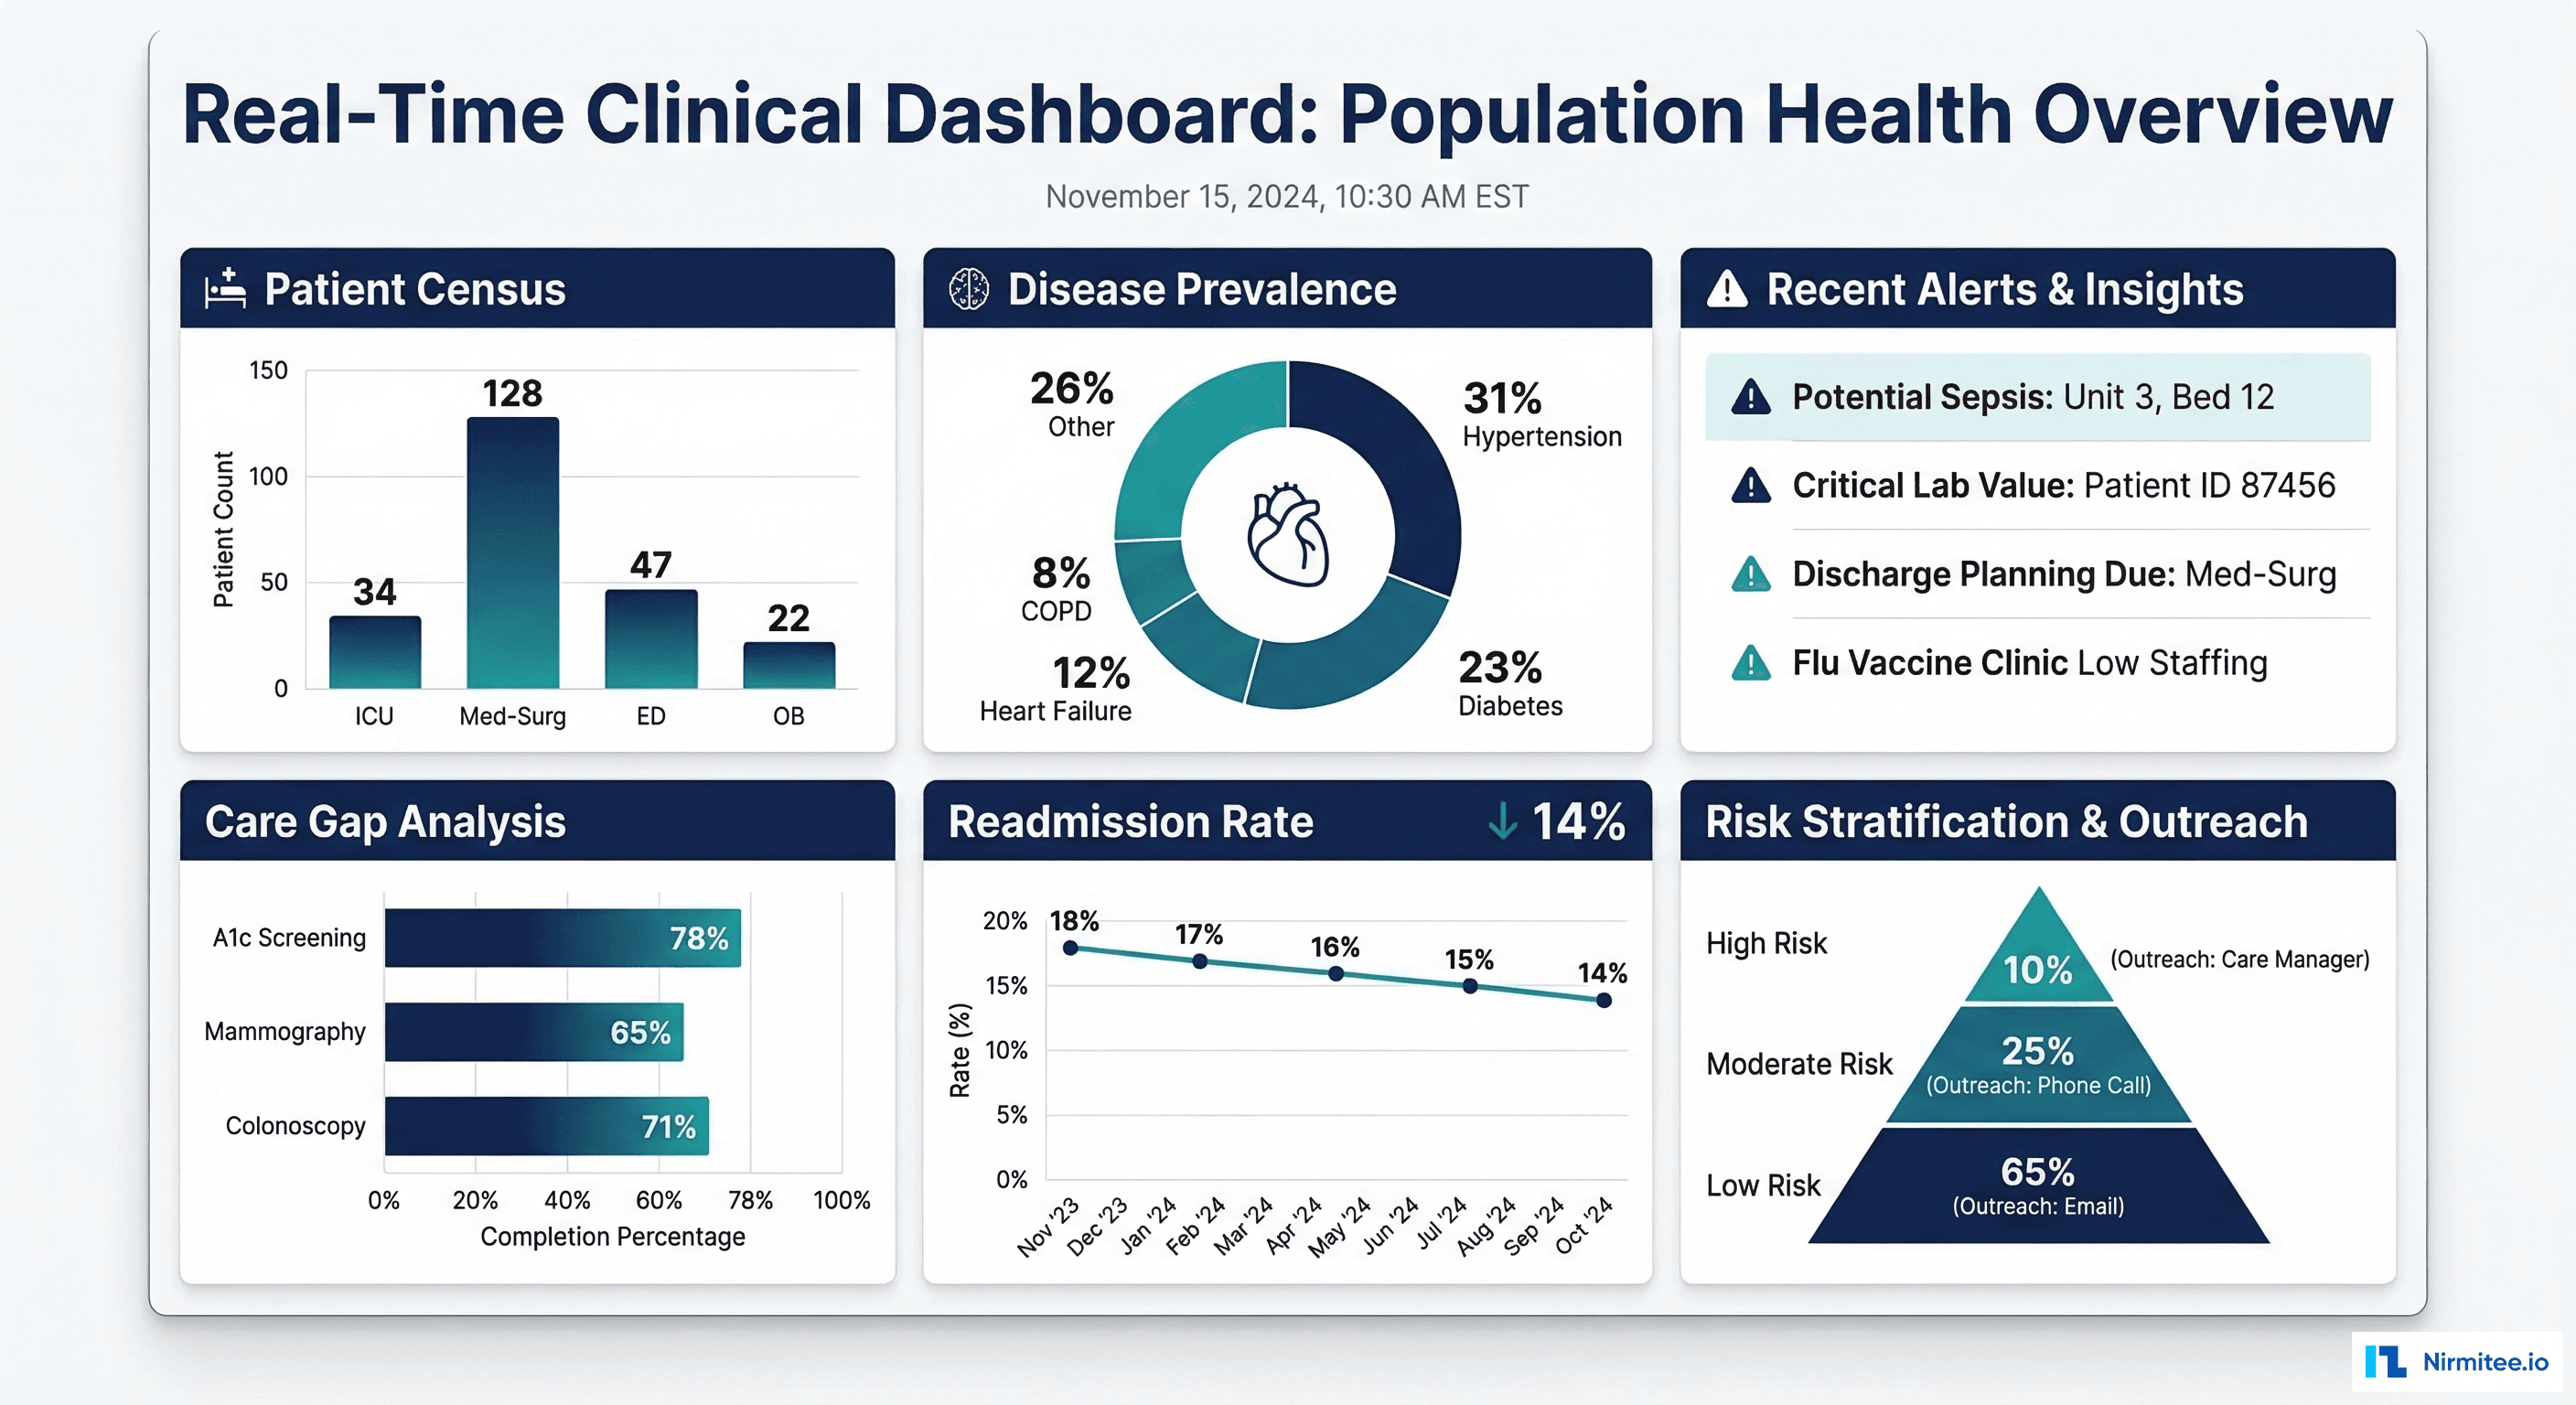
1. Patient Census (Real-Time from ADT Events)
-- Patient Census Dashboard: Current inpatients by unit
-- Data source: ADT (Admit-Discharge-Transfer) events via FHIR Encounter

-- Current census by nursing unit
SELECT
    e.location_display AS nursing_unit,
    COUNT(*) AS current_patients,
    SUM(CASE WHEN e.encounter_class = 'IMP' THEN 1 ELSE 0 END) AS inpatient,
    SUM(CASE WHEN e.encounter_class = 'OBSENC' THEN 1 ELSE 0 END) AS observation,
    ROUND(COUNT(*) * 100.0 / u.bed_capacity, 1) AS occupancy_pct
FROM clinical.active_encounters e
LEFT JOIN reference.unit_capacity u
    ON e.location_display = u.unit_name
WHERE e.status = 'in-progress'
GROUP BY e.location_display, u.bed_capacity
ORDER BY occupancy_pct DESC;

-- Census trend (hourly for last 7 days)
SELECT
    DATE_TRUNC('HOUR', census_timestamp) AS hour,
    SUM(patient_count) AS total_census,
    SUM(CASE WHEN unit_type = 'ICU' THEN patient_count ELSE 0 END) AS icu_census,
    SUM(CASE WHEN unit_type = 'ED' THEN patient_count ELSE 0 END) AS ed_census,
    SUM(CASE WHEN unit_type = 'MED_SURG' THEN patient_count ELSE 0 END) AS medsurg_census
FROM clinical.hourly_census_snapshot
WHERE census_timestamp >= DATEADD('DAY', -7, CURRENT_TIMESTAMP())
GROUP BY 1
ORDER BY 1;
2. Disease Prevalence (Chronic Conditions by Geography)
-- Disease Prevalence Dashboard: Chronic conditions by ZIP code
SELECT
    p.zip_code,
    p.state,
    c.diagnosis_display AS condition,
    COUNT(DISTINCT c.patient_ref) AS patient_count,
    COUNT(DISTINCT c.patient_ref) * 100.0 /
        NULLIF(COUNT(DISTINCT p.patient_id) OVER (PARTITION BY p.zip_code), 0)
        AS prevalence_pct
FROM clinical.conditions c
JOIN clinical.patient_demographics p
    ON c.patient_ref = CONCAT('Patient/', p.patient_id)
WHERE c.clinical_status = 'active'
    AND c.diagnosis_code IN (
        'E11.9',  -- Type 2 Diabetes
        'I10',    -- Hypertension
        'I50.9',  -- Heart Failure
        'J44.1',  -- COPD
        'N18.9'   -- CKD
    )
GROUP BY p.zip_code, p.state, c.diagnosis_display
HAVING COUNT(DISTINCT c.patient_ref) >= 11  -- suppress small cells
ORDER BY prevalence_pct DESC;
3. Care Gap Analysis (Overdue Screenings)
-- Care Gap Dashboard: Patients overdue for preventive screenings
WITH screening_status AS (
    SELECT
        p.patient_id,
        p.date_of_birth,
        DATEDIFF('YEAR', p.date_of_birth, CURRENT_DATE()) AS age,
        p.gender,
        p.insurance_type,
        -- Breast cancer screening (mammogram): women 50-74, every 2 years
        MAX(CASE
            WHEN o.loinc_code IN ('24606-6', '24610-8')  -- Mammogram LOINC
            THEN o.effective_date
        END) AS last_mammogram,
        -- Colorectal screening: age 45-75
        MAX(CASE
            WHEN o.loinc_code IN ('29298-7', '57803-4')  -- Colonoscopy LOINC
            THEN o.effective_date
        END) AS last_colonoscopy,
        -- HbA1c for diabetics: every 6 months
        MAX(CASE
            WHEN o.loinc_code = '4548-4'  -- HbA1c
            THEN o.effective_date
        END) AS last_hba1c,
        -- Blood pressure check: annually
        MAX(CASE
            WHEN o.loinc_code = '85354-9'  -- BP panel
            THEN o.effective_date
        END) AS last_bp_check
    FROM clinical.patient_demographics p
    LEFT JOIN clinical.lab_results o
        ON CONCAT('Patient/', p.patient_id) = o.patient_ref
    GROUP BY p.patient_id, p.date_of_birth, p.gender, p.insurance_type
)
SELECT
    CASE
        WHEN age BETWEEN 18 AND 34 THEN '18-34'
        WHEN age BETWEEN 35 AND 49 THEN '35-49'
        WHEN age BETWEEN 50 AND 64 THEN '50-64'
        WHEN age >= 65 THEN '65+'
    END AS age_group,
    insurance_type,
    COUNT(*) AS total_patients,
    -- Mammogram gaps
    SUM(CASE
        WHEN gender = 'female' AND age BETWEEN 50 AND 74
            AND (last_mammogram IS NULL
                 OR last_mammogram < DATEADD('YEAR', -2, CURRENT_DATE()))
        THEN 1 ELSE 0
    END) AS mammogram_gap,
    -- Colonoscopy gaps
    SUM(CASE
        WHEN age BETWEEN 45 AND 75
            AND (last_colonoscopy IS NULL
                 OR last_colonoscopy < DATEADD('YEAR', -10, CURRENT_DATE()))
        THEN 1 ELSE 0
    END) AS colonoscopy_gap,
    -- HbA1c gaps (diabetic patients only)
    SUM(CASE
        WHEN patient_id IN (SELECT DISTINCT REPLACE(patient_ref, 'Patient/', '')
                            FROM clinical.conditions
                            WHERE diagnosis_code LIKE 'E11%')
            AND (last_hba1c IS NULL
                 OR last_hba1c < DATEADD('MONTH', -6, CURRENT_DATE()))
        THEN 1 ELSE 0
    END) AS hba1c_gap
FROM screening_status
GROUP BY 1, 2
ORDER BY 1, 2;
4. Quality Measures (HEDIS/CMS Star Ratings)
-- Quality Measures Dashboard: HEDIS performance tracking
SELECT
    m.measure_id,
    m.measure_name,
    m.measure_category,
    m.target_rate,
    COUNT(DISTINCT CASE WHEN m.numerator = TRUE THEN m.patient_id END)
        AS numerator_count,
    COUNT(DISTINCT m.patient_id) AS denominator_count,
    ROUND(
        COUNT(DISTINCT CASE WHEN m.numerator = TRUE THEN m.patient_id END)
        * 100.0 / NULLIF(COUNT(DISTINCT m.patient_id), 0), 1
    ) AS performance_rate,
    m.target_rate - ROUND(
        COUNT(DISTINCT CASE WHEN m.numerator = TRUE THEN m.patient_id END)
        * 100.0 / NULLIF(COUNT(DISTINCT m.patient_id), 0), 1
    ) AS gap_to_target,
    CASE
        WHEN ROUND(
            COUNT(DISTINCT CASE WHEN m.numerator = TRUE THEN m.patient_id END)
            * 100.0 / NULLIF(COUNT(DISTINCT m.patient_id), 0), 1
        ) >= m.target_rate THEN 'Meeting Target'
        WHEN ROUND(
            COUNT(DISTINCT CASE WHEN m.numerator = TRUE THEN m.patient_id END)
            * 100.0 / NULLIF(COUNT(DISTINCT m.patient_id), 0), 1
        ) >= m.target_rate - 5 THEN 'Near Target'
        ELSE 'Below Target'
    END AS status
FROM clinical.hedis_measures m
WHERE m.measurement_year = 2026
GROUP BY m.measure_id, m.measure_name, m.measure_category, m.target_rate
ORDER BY gap_to_target DESC;
5. 30-Day Readmission Rates
-- Readmission Dashboard: 30-day all-cause readmission by DRG
WITH index_admissions AS (
    SELECT
        e.patient_ref,
        e.encounter_id,
        e.drg_code,
        e.drg_description,
        e.discharge_date,
        e.facility_name
    FROM clinical.encounters e
    WHERE e.encounter_class = 'IMP'  -- inpatient
        AND e.status = 'finished'
        AND e.discharge_date BETWEEN
            DATEADD('MONTH', -6, CURRENT_DATE())
            AND DATEADD('DAY', -30, CURRENT_DATE())
),
readmissions AS (
    SELECT
        ia.encounter_id AS index_encounter,
        ia.drg_code,
        ia.drg_description,
        ia.facility_name,
        re.encounter_id AS readmit_encounter,
        DATEDIFF('DAY', ia.discharge_date, re.admit_date) AS days_to_readmit
    FROM index_admissions ia
    LEFT JOIN clinical.encounters re
        ON ia.patient_ref = re.patient_ref
        AND re.encounter_class = 'IMP'
        AND re.admit_date BETWEEN ia.discharge_date
            AND DATEADD('DAY', 30, ia.discharge_date)
        AND re.encounter_id != ia.encounter_id
)
SELECT
    drg_code,
    drg_description,
    facility_name,
    COUNT(DISTINCT index_encounter) AS total_discharges,
    COUNT(DISTINCT readmit_encounter) AS readmissions,
    ROUND(
        COUNT(DISTINCT readmit_encounter) * 100.0 /
        NULLIF(COUNT(DISTINCT index_encounter), 0), 1
    ) AS readmission_rate,
    AVG(days_to_readmit) AS avg_days_to_readmit
FROM readmissions
GROUP BY drg_code, drg_description, facility_name
HAVING COUNT(DISTINCT index_encounter) >= 20  -- statistical significance
ORDER BY readmission_rate DESC;
6. ED Utilization (Wait Times and LWBS)
-- ED Dashboard: Door-to-provider time and LWBS rates
SELECT
    DATE_TRUNC('HOUR', e.arrival_time) AS hour,
    COUNT(*) AS ed_volume,
    -- Door-to-provider time
    ROUND(AVG(
        DATEDIFF('MINUTE', e.arrival_time, e.provider_contact_time)
    ), 0) AS avg_door_to_provider_min,
    PERCENTILE_CONT(0.5) WITHIN GROUP (
        ORDER BY DATEDIFF('MINUTE', e.arrival_time, e.provider_contact_time)
    ) AS median_door_to_provider_min,
    -- LWBS (Left Without Being Seen) rate
    ROUND(
        SUM(CASE WHEN e.disposition = 'LWBS' THEN 1 ELSE 0 END)
        * 100.0 / COUNT(*), 1
    ) AS lwbs_rate,
    -- Admission rate from ED
    ROUND(
        SUM(CASE WHEN e.disposition = 'ADMITTED' THEN 1 ELSE 0 END)
        * 100.0 / COUNT(*), 1
    ) AS admission_rate,
    -- Average length of stay in ED
    ROUND(AVG(
        DATEDIFF('MINUTE', e.arrival_time, e.departure_time)
    ) / 60.0, 1) AS avg_ed_los_hours
FROM clinical.ed_encounters e
WHERE e.arrival_time >= DATEADD('DAY', -30, CURRENT_TIMESTAMP())
GROUP BY 1
ORDER BY 1;
Row-Level Security in Superset
Restricting Data by User Department
Superset supports row-level security (RLS) to ensure that dashboard users see only the patients and data they are authorized to access. This is critical for HIPAA compliance when embedding dashboards across departments:
# Superset RLS configuration
# Applied via Admin -> Security -> Row Level Security

# Example RLS rules:

# Rule 1: Cardiologists see only cardiology patients
# Table: clinical.encounters
# Clause: department = 'Cardiology'
# Roles: Cardiology_Users

# Rule 2: Facility-scoped access
# Table: clinical.patient_demographics
# Clause: facility_id IN (SELECT facility_id FROM user_facility_access
#          WHERE user_email = '{{ current_username() }}')
# Roles: Facility_Scoped_Users

# Rule 3: Research role sees only consented patients
# Table: clinical.patient_demographics
# Clause: patient_id IN (SELECT patient_id FROM consent_records
#          WHERE research_consent = TRUE AND consent_status = 'active')
# Roles: Research_Users
Embedding Dashboards in Clinical Applications
Guest Token API for Secure Embedding
# embed_dashboard.py
# Generate guest tokens for embedding Superset dashboards
# in clinical applications (patient portal, care manager app)
import requests

SUPERSET_URL = "http://superset:8088"

def get_guest_token(
    dashboard_id: str,
    user_email: str,
    user_department: str,
    rls_filters: list
) -> str:
    """Generate a guest token for embedded dashboard access."""

    # Step 1: Get admin access token
    login_resp = requests.post(
        f"{SUPERSET_URL}/api/v1/security/login",
        json={"username": "embed_service", "password": "service_pwd",
              "provider": "db"}
    )
    admin_token = login_resp.json()["access_token"]

    # Step 2: Generate guest token with RLS
    guest_resp = requests.post(
        f"{SUPERSET_URL}/api/v1/security/guest_token/",
        headers={"Authorization": f"Bearer {admin_token}"},
        json={
            "user": {
                "username": user_email,
                "first_name": user_email.split("@")[0],
                "last_name": ""
            },
            "resources": [
                {"type": "dashboard", "id": dashboard_id}
            ],
            "rls": [
                {"clause": f"department = '{user_department}'"},
                *[{"clause": f} for f in rls_filters]
            ]
        }
    )

    return guest_resp.json()["token"]


# Example: Embed census dashboard for a nurse manager
token = get_guest_token(
    dashboard_id="census-dashboard-uuid",
    user_email="nurse.manager@hospital.org",
    user_department="Med-Surg 4W",
    rls_filters=["facility_id = 'MAIN_CAMPUS'"]
)

# Frontend embeds using @superset-ui/embedded-sdk:
# embedDashboard({
#   id: "census-dashboard-uuid",
#   supersetDomain: "https://analytics.hospital.org",
#   mountPoint: document.getElementById("dashboard-container"),
#   fetchGuestToken: () => token,
#   dashboardUiConfig: {
#     hideTitle: true,
#     filters: { expanded: false }
#   }
# });
Alerting on Clinical KPIs
# superset_alerts.py
# Configure automated alerts on clinical KPI thresholds
# Uses Superset's built-in Alert & Report feature

CLINICAL_ALERTS = [
    {
        "name": "ED LWBS Rate Above 5%",
        "description": "Alert when Left Without Being Seen rate exceeds 5%",
        "sql": """
            SELECT lwbs_rate FROM (
                SELECT
                    SUM(CASE WHEN disposition='LWBS' THEN 1 ELSE 0 END)
                    * 100.0 / COUNT(*) AS lwbs_rate
                FROM clinical.ed_encounters
                WHERE arrival_time >= DATEADD('HOUR', -4, CURRENT_TIMESTAMP())
            ) WHERE lwbs_rate > 5.0
        """,
        "validator_type": "not null",
        "recipients": ["ed.director@hospital.org"],
        "schedule": "*/15 * * * *",  # every 15 minutes
        "channel": "email"
    },
    {
        "name": "ICU Occupancy Above 90%",
        "description": "Alert when ICU occupancy exceeds 90%",
        "sql": """
            SELECT occupancy_pct FROM clinical.unit_census
            WHERE unit_type = 'ICU'
            AND occupancy_pct > 90
        """,
        "validator_type": "not null",
        "recipients": ["bed.management@hospital.org"],
        "schedule": "*/30 * * * *",  # every 30 minutes
        "channel": "slack"
    },
    {
        "name": "30-Day Readmission Spike",
        "description": "Alert when readmission rate exceeds 15% threshold",
        "sql": """
            SELECT readmission_rate FROM clinical.weekly_readmission_summary
            WHERE measurement_week = DATE_TRUNC('WEEK', CURRENT_DATE())
            AND readmission_rate > 15.0
        """,
        "validator_type": "not null",
        "recipients": ["quality.director@hospital.org"],
        "schedule": "0 8 * * MON",  # Monday at 8am
        "channel": "email"
    }
]
Frequently Asked Questions
Why Apache Superset instead of Tableau or Power BI?
For healthcare organizations, Superset offers three advantages: (1) no per-user licensing cost — critical when you want to provide dashboards to hundreds of clinicians; (2) native embedding with guest tokens — embed dashboards directly in clinical apps with row-level security; (3) self-hosted control — PHI never leaves your infrastructure. Tableau and Power BI are excellent tools, but their per-user pricing (typically $35-70/user/month) makes broad clinical deployment expensive. Superset is free and handles the same analytical workloads.
How do we handle real-time data in Superset?
Superset is a visualization layer, not a streaming engine. For "real-time" dashboards, the trick is in the data pipeline: use Snowflake Streams/Tasks or Spark Structured Streaming to keep your analytical tables current within 5-15 minutes. Superset queries these tables with a short cache TTL (60-300 seconds). For true sub-second updates (monitor boards), use a dedicated real-time dashboard tool and reserve Superset for analytical dashboards.
How do we ensure HIPAA compliance with embedded dashboards?
Three controls:
(1) Authentication — use SSO (SAML/OIDC) so users authenticate through your enterprise identity provider
(2) Row-level security — RLS rules ensure users see only patients in their department/facility/care team
(3) Audit logging — Superset logs all queries and dashboard access, which feeds into your data governance audit trail. Additionally, self-host Superset within your HIPAA-compliant infrastructure — do not use Superset Cloud for PHI workloads.
What data refresh rate is appropriate for clinical dashboards?
It depends on the dashboard's purpose. Patient census: every 5-15 minutes (driven by ADT events). Lab results: every 15-30 minutes (matches lab result delivery cadence). Quality measures: daily or weekly (HEDIS calculations are batch). Readmission rates: weekly (metric inherently lagged by 30 days). ED utilization: every 15 minutes (operational decision-making). Match the data refresh to the decision cadence — refreshing faster than the user checks the dashboard wastes compute resources.
Can we use Superset for patient-facing analytics?
Yes, with careful design. Use Superset's embedded SDK with guest tokens that apply strict RLS (each patient sees only their own data). The dashboard should show patient-friendly visualizations: lab result trends, medication history timeline, and upcoming screening reminders. Ensure the embedding application handles authentication and passes the patient context to the guest token generator. Several health systems use this pattern for their patient portal analytics — it is more flexible and cost-effective than building custom chart components.