Executive Summary
A US endocrinology practice managing 480 diabetes patients was struggling with the gap between continuous glucose monitor (CGM) data and their EHR. Patients wore Dexcom G7 and Libre 3 sensors generating 288 glucose readings per day, but this data lived in separate vendor apps — disconnected from the clinical workflow. Providers reviewed CGM data on one screen and the patient chart on another, unable to correlate glucose patterns with medications, meals, labs, or lifestyle factors.
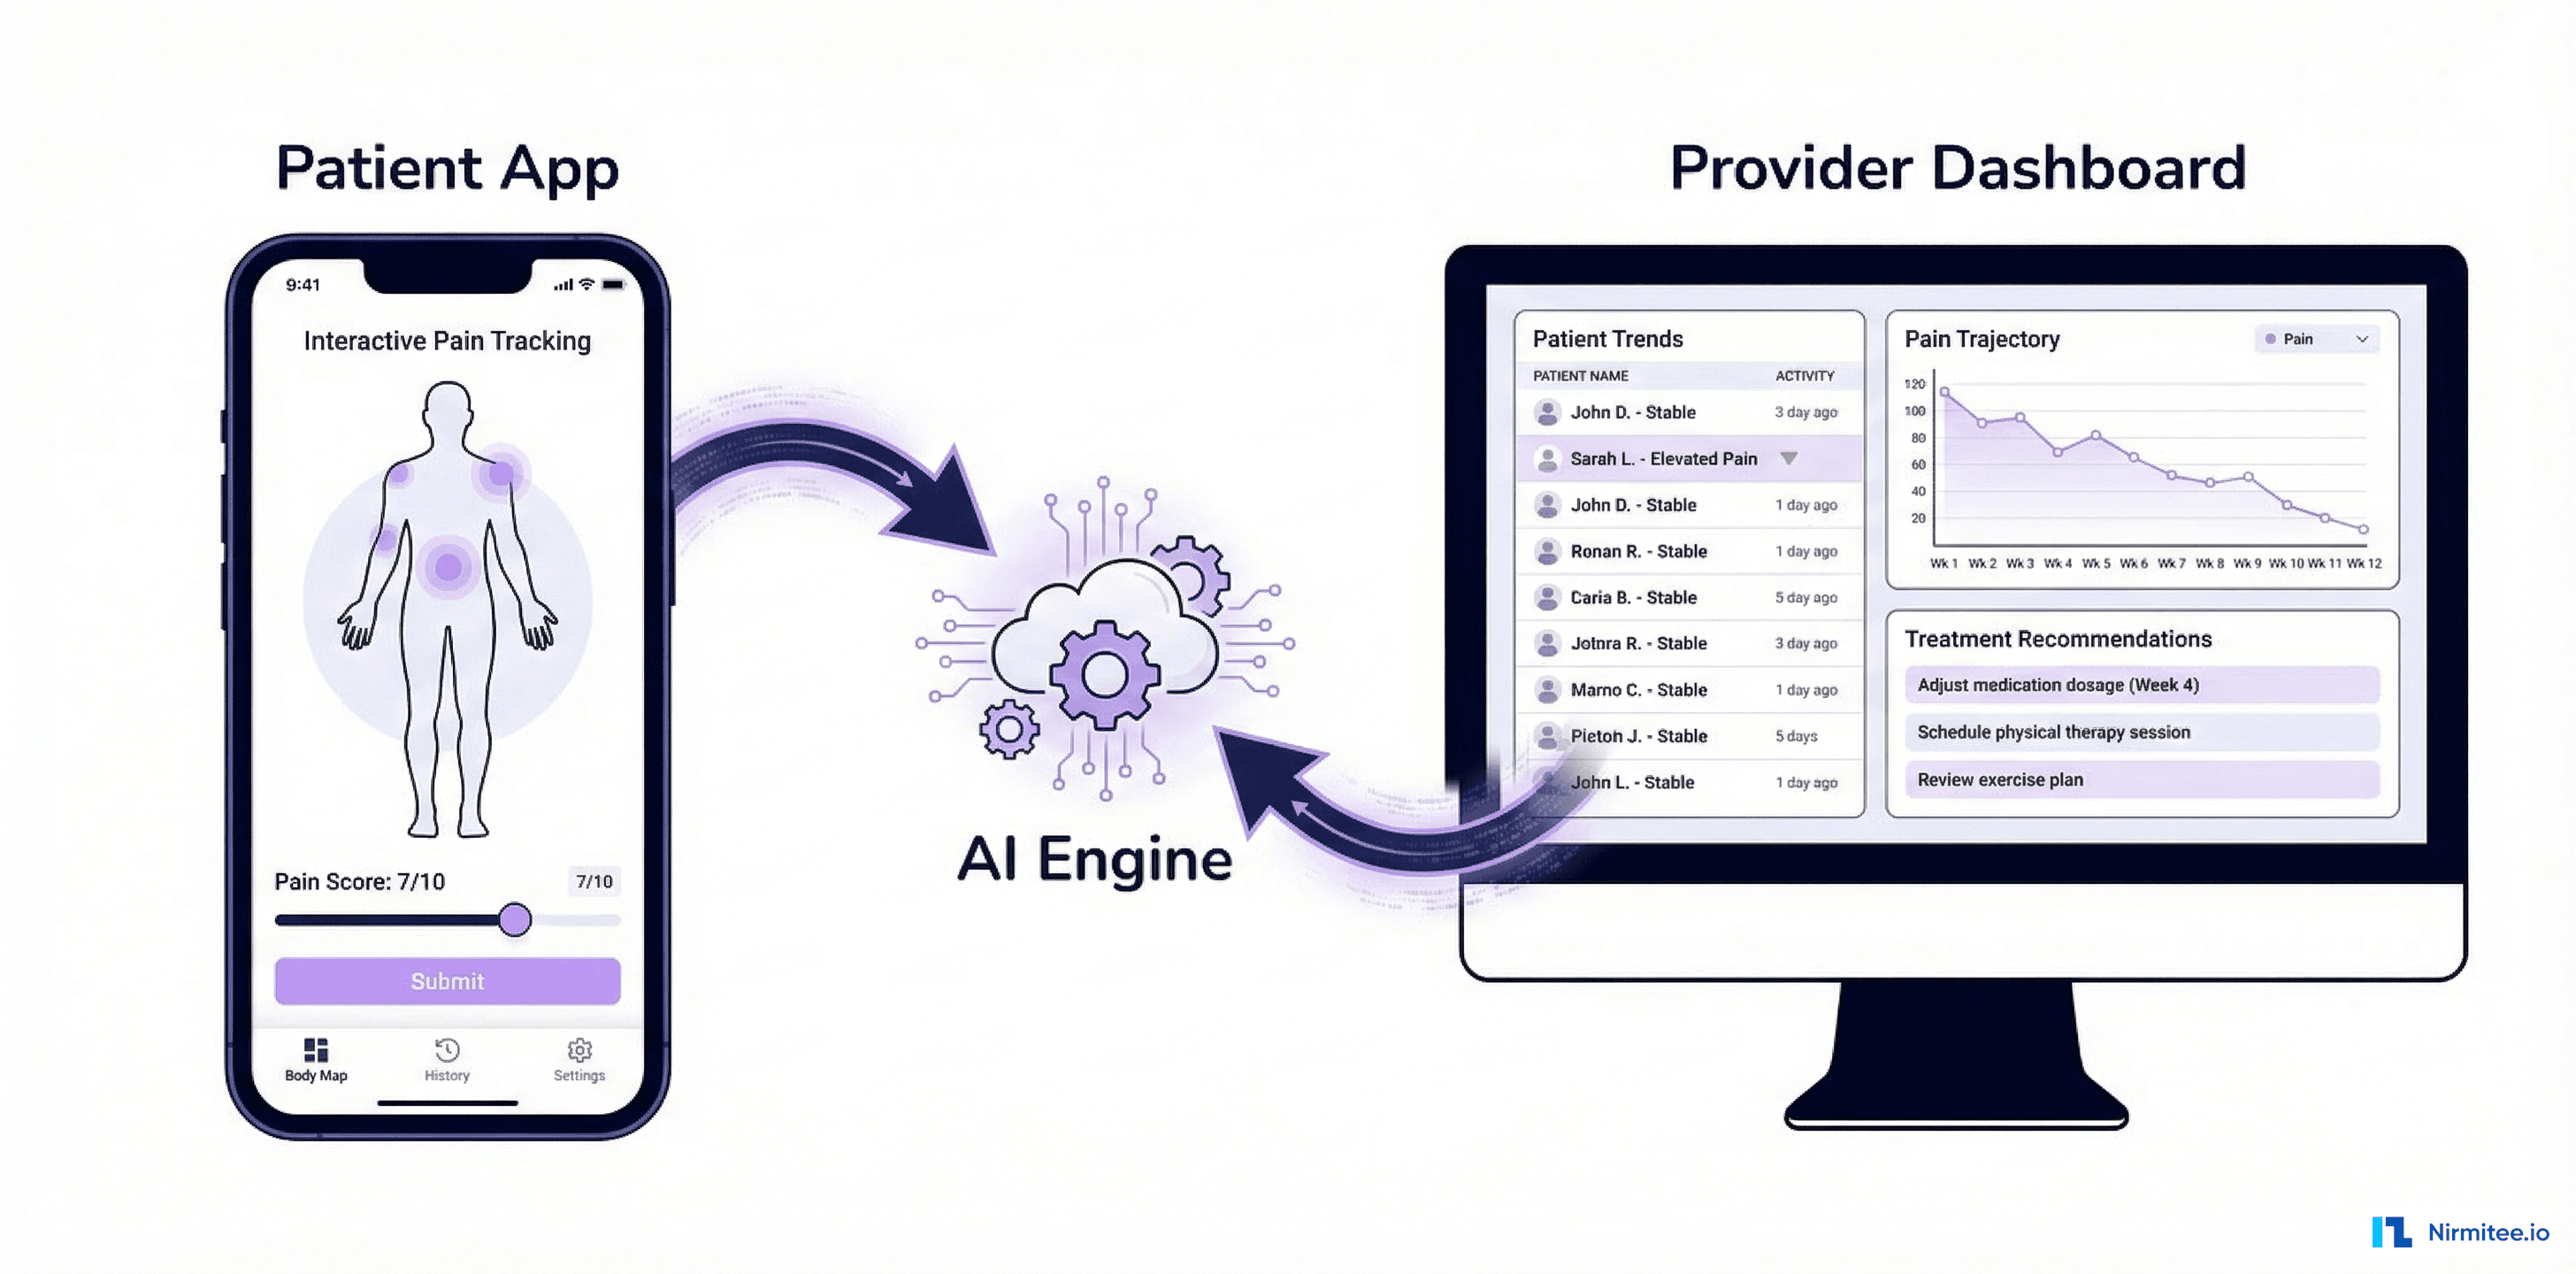
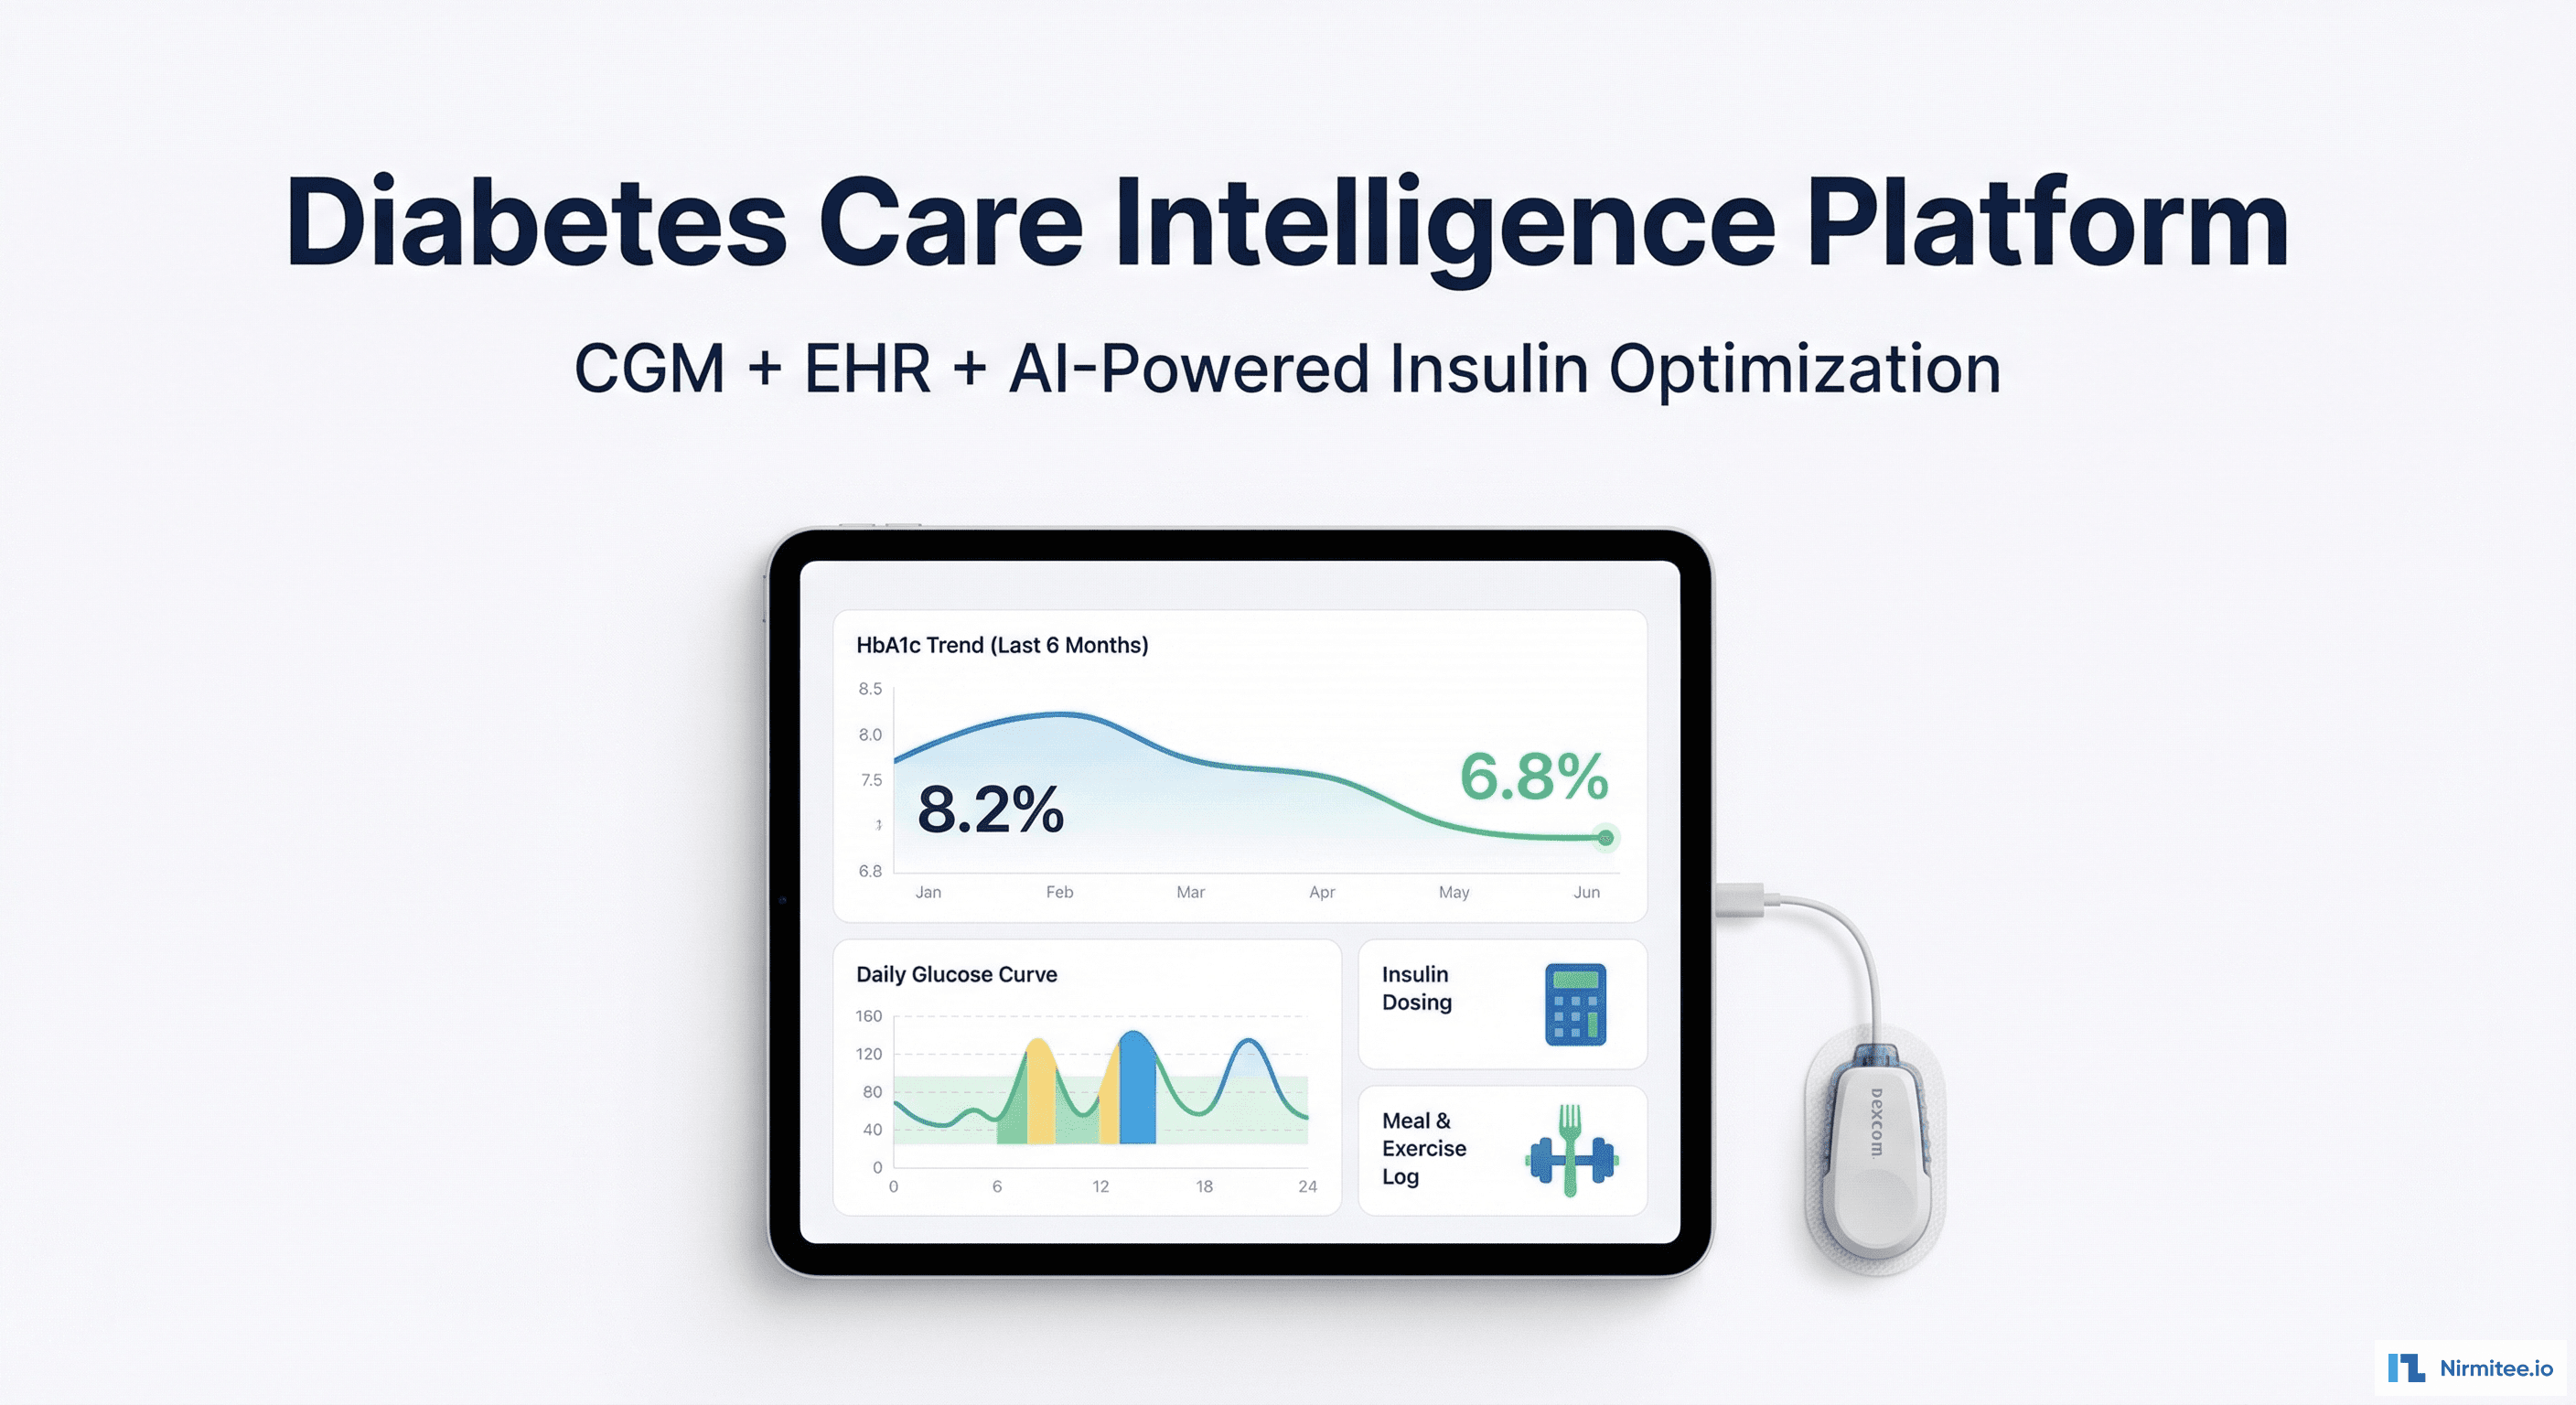
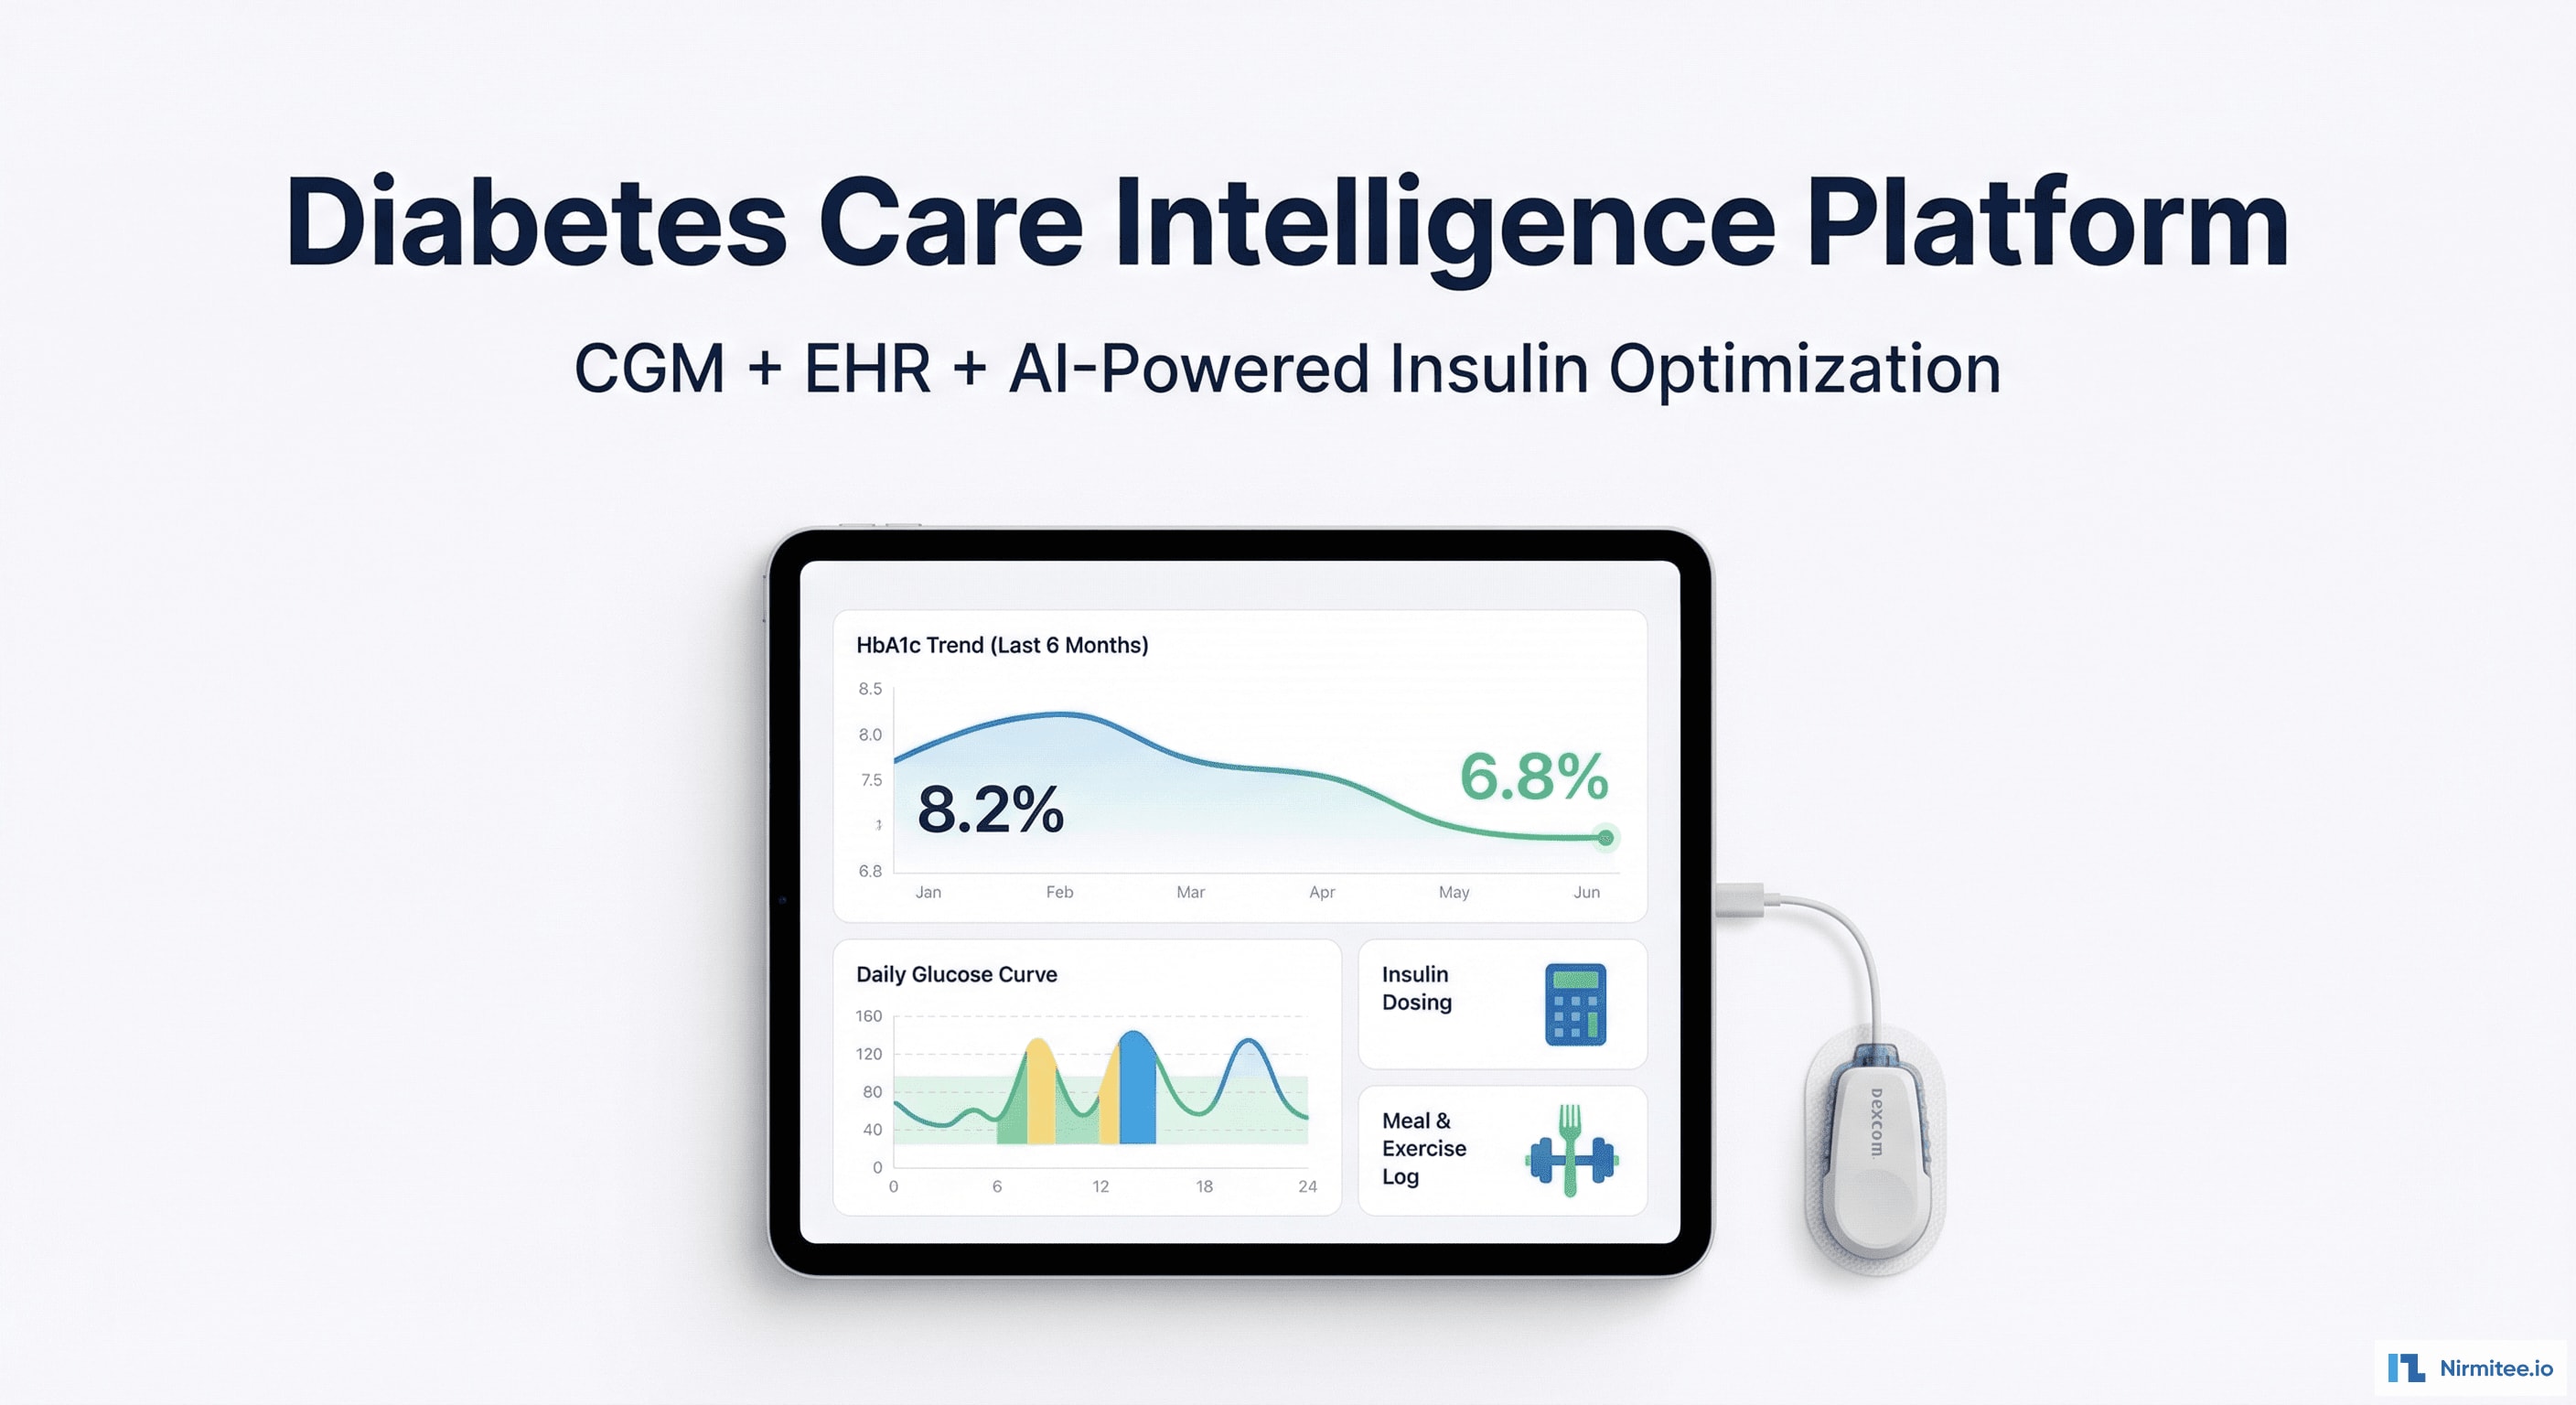
We built a diabetes care intelligence platform that integrates CGM data streams, EHR clinical data via FHIR R4, and patient-logged meals and exercise into a unified diabetes management dashboard. AI-powered insulin optimization analyzes 14-day glucose patterns and recommends dosing adjustments. Population health tools identify high-risk patients before they deteriorate.
Results: average HbA1c improved from 8.2% to 6.5% across the patient cohort, time-in-range increased from 48% to 72%, and the AI insulin optimization engine's recommendations were accepted by endocrinologists 84% of the time.
The Problem: 288 Data Points Per Day, Zero Integration
Modern diabetes management generates more data than any other chronic condition. A single CGM sensor produces a glucose reading every 5 minutes — 288 per day, 2,016 per week, 8,064 per month. Yet this wealth of data is trapped in vendor silos.
The Disconnect
- CGM data in one app: Dexcom Clarity or LibreView show glucose traces but know nothing about the patient's medications, labs, or comorbidities
- EHR data in another: Epic/Cerner has the medication list, HbA1c history, and kidney function but no CGM data integration
- Meal and activity nowhere: the two biggest glucose influencers — food and exercise — are in the patient's memory (unreliable) or a separate logging app
- Insulin adjustments by gut feel: endocrinologists review 2 weeks of CGM data in a 15-minute visit and make dosing changes based on pattern recognition and experience. No algorithmic support.
- Quarterly visits only: patients see their endocrinologist every 3-4 months. Between visits, glucose management is unsupervised. Problems compound for months before the next review.
Continuous Glucose Monitor Dashboard

The CGM dashboard is the clinical centerpiece — a unified view of glucose data overlaid with clinical context:
- 24-hour glucose trace: smooth curve showing continuous readings with color-coded target range (70-180 mg/dL green zone)
- Event markers: meals (fork icon with carb count), insulin doses (syringe icon with units), exercise (running icon with duration/intensity) — all overlaid on the glucose curve to show cause-and-effect
- Key metrics: Time in Range (72%), Average Glucose (142 mg/dL), Glucose Management Indicator (GMI 6.8%), Coefficient of Variation (32%)
- Ambulatory Glucose Profile (AGP): 14-day composite showing the median glucose curve with 25th-75th percentile band — the gold standard for identifying consistent patterns vs. random variation
- Hypo/hyperglycemia alerts: flagged episodes with duration and nadir/peak values — critical for safety monitoring
AI-Powered Insulin Optimization
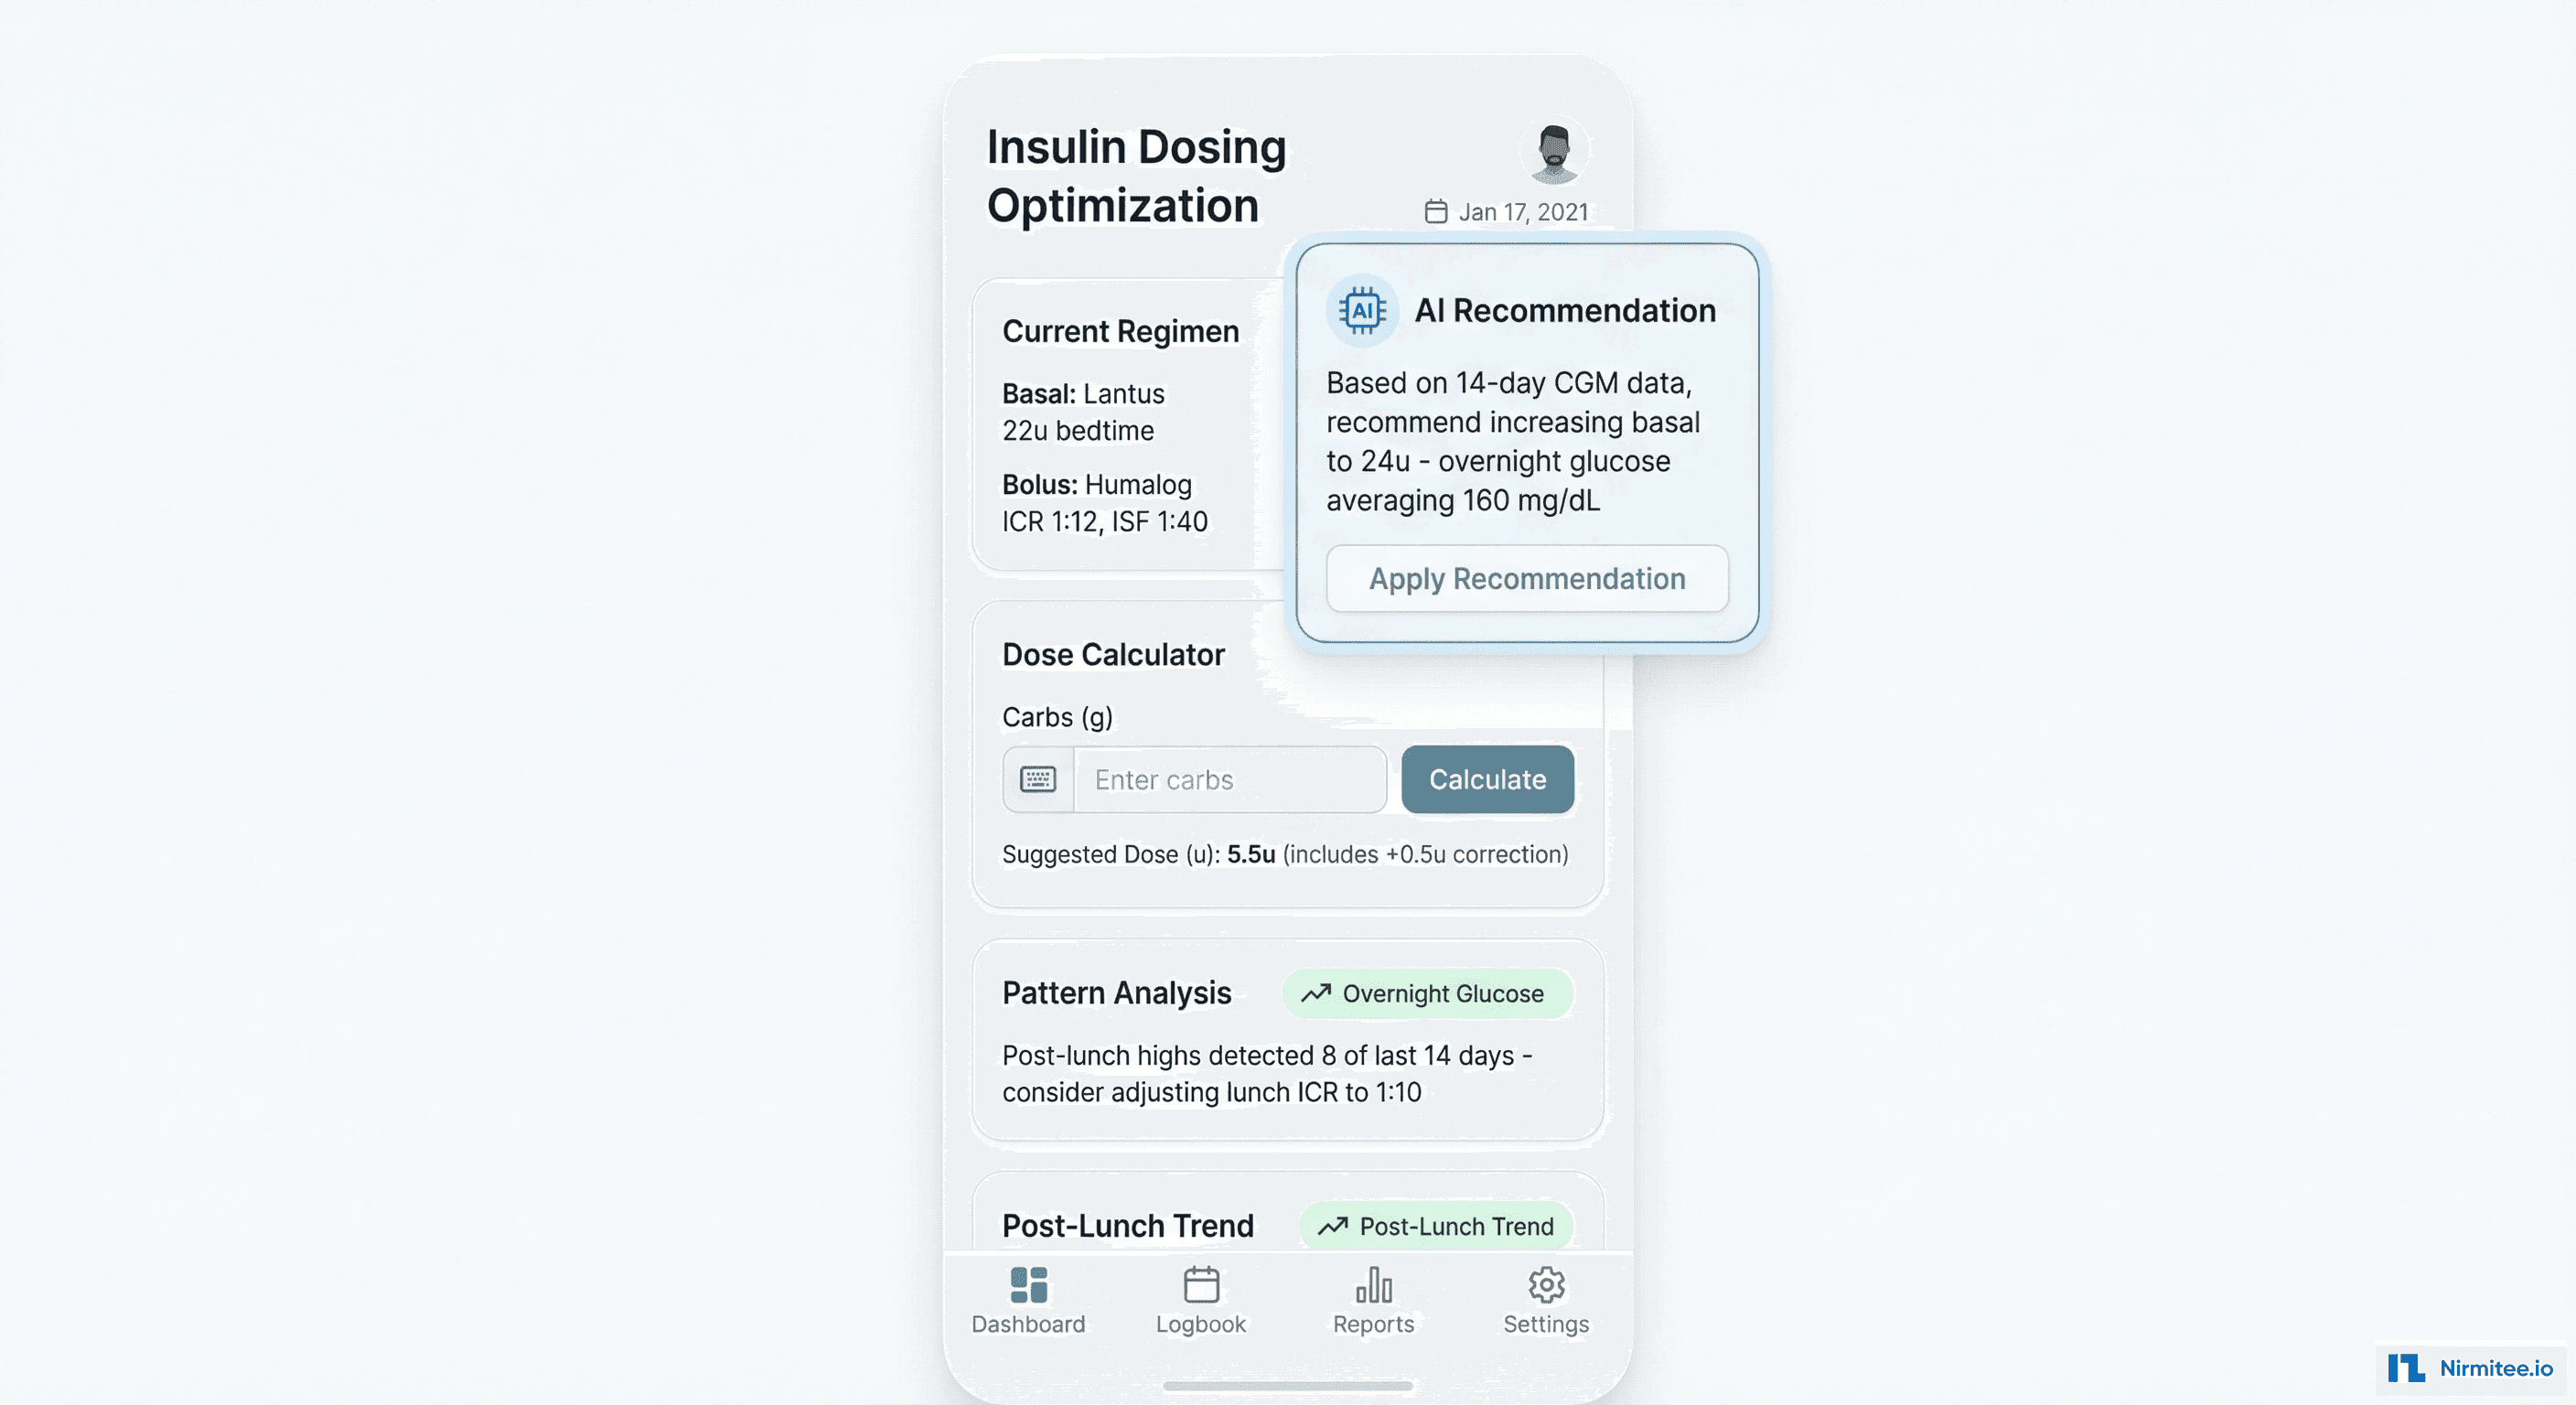
The AI engine analyzes 14-day CGM patterns correlated with insulin doses, meal timing, and activity to generate specific dosing recommendations:
- Basal rate optimization: "Overnight glucose averaging 160 mg/dL over 14 days. Current basal Lantus 22u. Recommend increasing to 24u." — with the supporting data visualization
- Bolus ratio tuning: "Post-lunch glucose exceeds 200 mg/dL in 8 of 14 days. Current lunch ICR 1:12. Recommend adjusting to 1:10." — with the specific meal-glucose correlation data
- Correction factor adjustment: "Correction doses at ISF 1:40 are under-correcting. Glucose returns to target 65% of the time. Recommend ISF 1:35."
- Pattern recognition: "Dawn phenomenon detected — glucose rises 40 mg/dL between 4-7 AM on 11 of 14 days despite adequate overnight control."
- Safety guardrails: the AI never recommends changes that would increase hypoglycemia risk. All recommendations include a safety analysis.
Endocrinologists accepted AI recommendations 84% of the time — the remaining 16% were modified based on clinical factors the AI couldn't see (patient preference, upcoming lifestyle changes, cost considerations).
Architecture
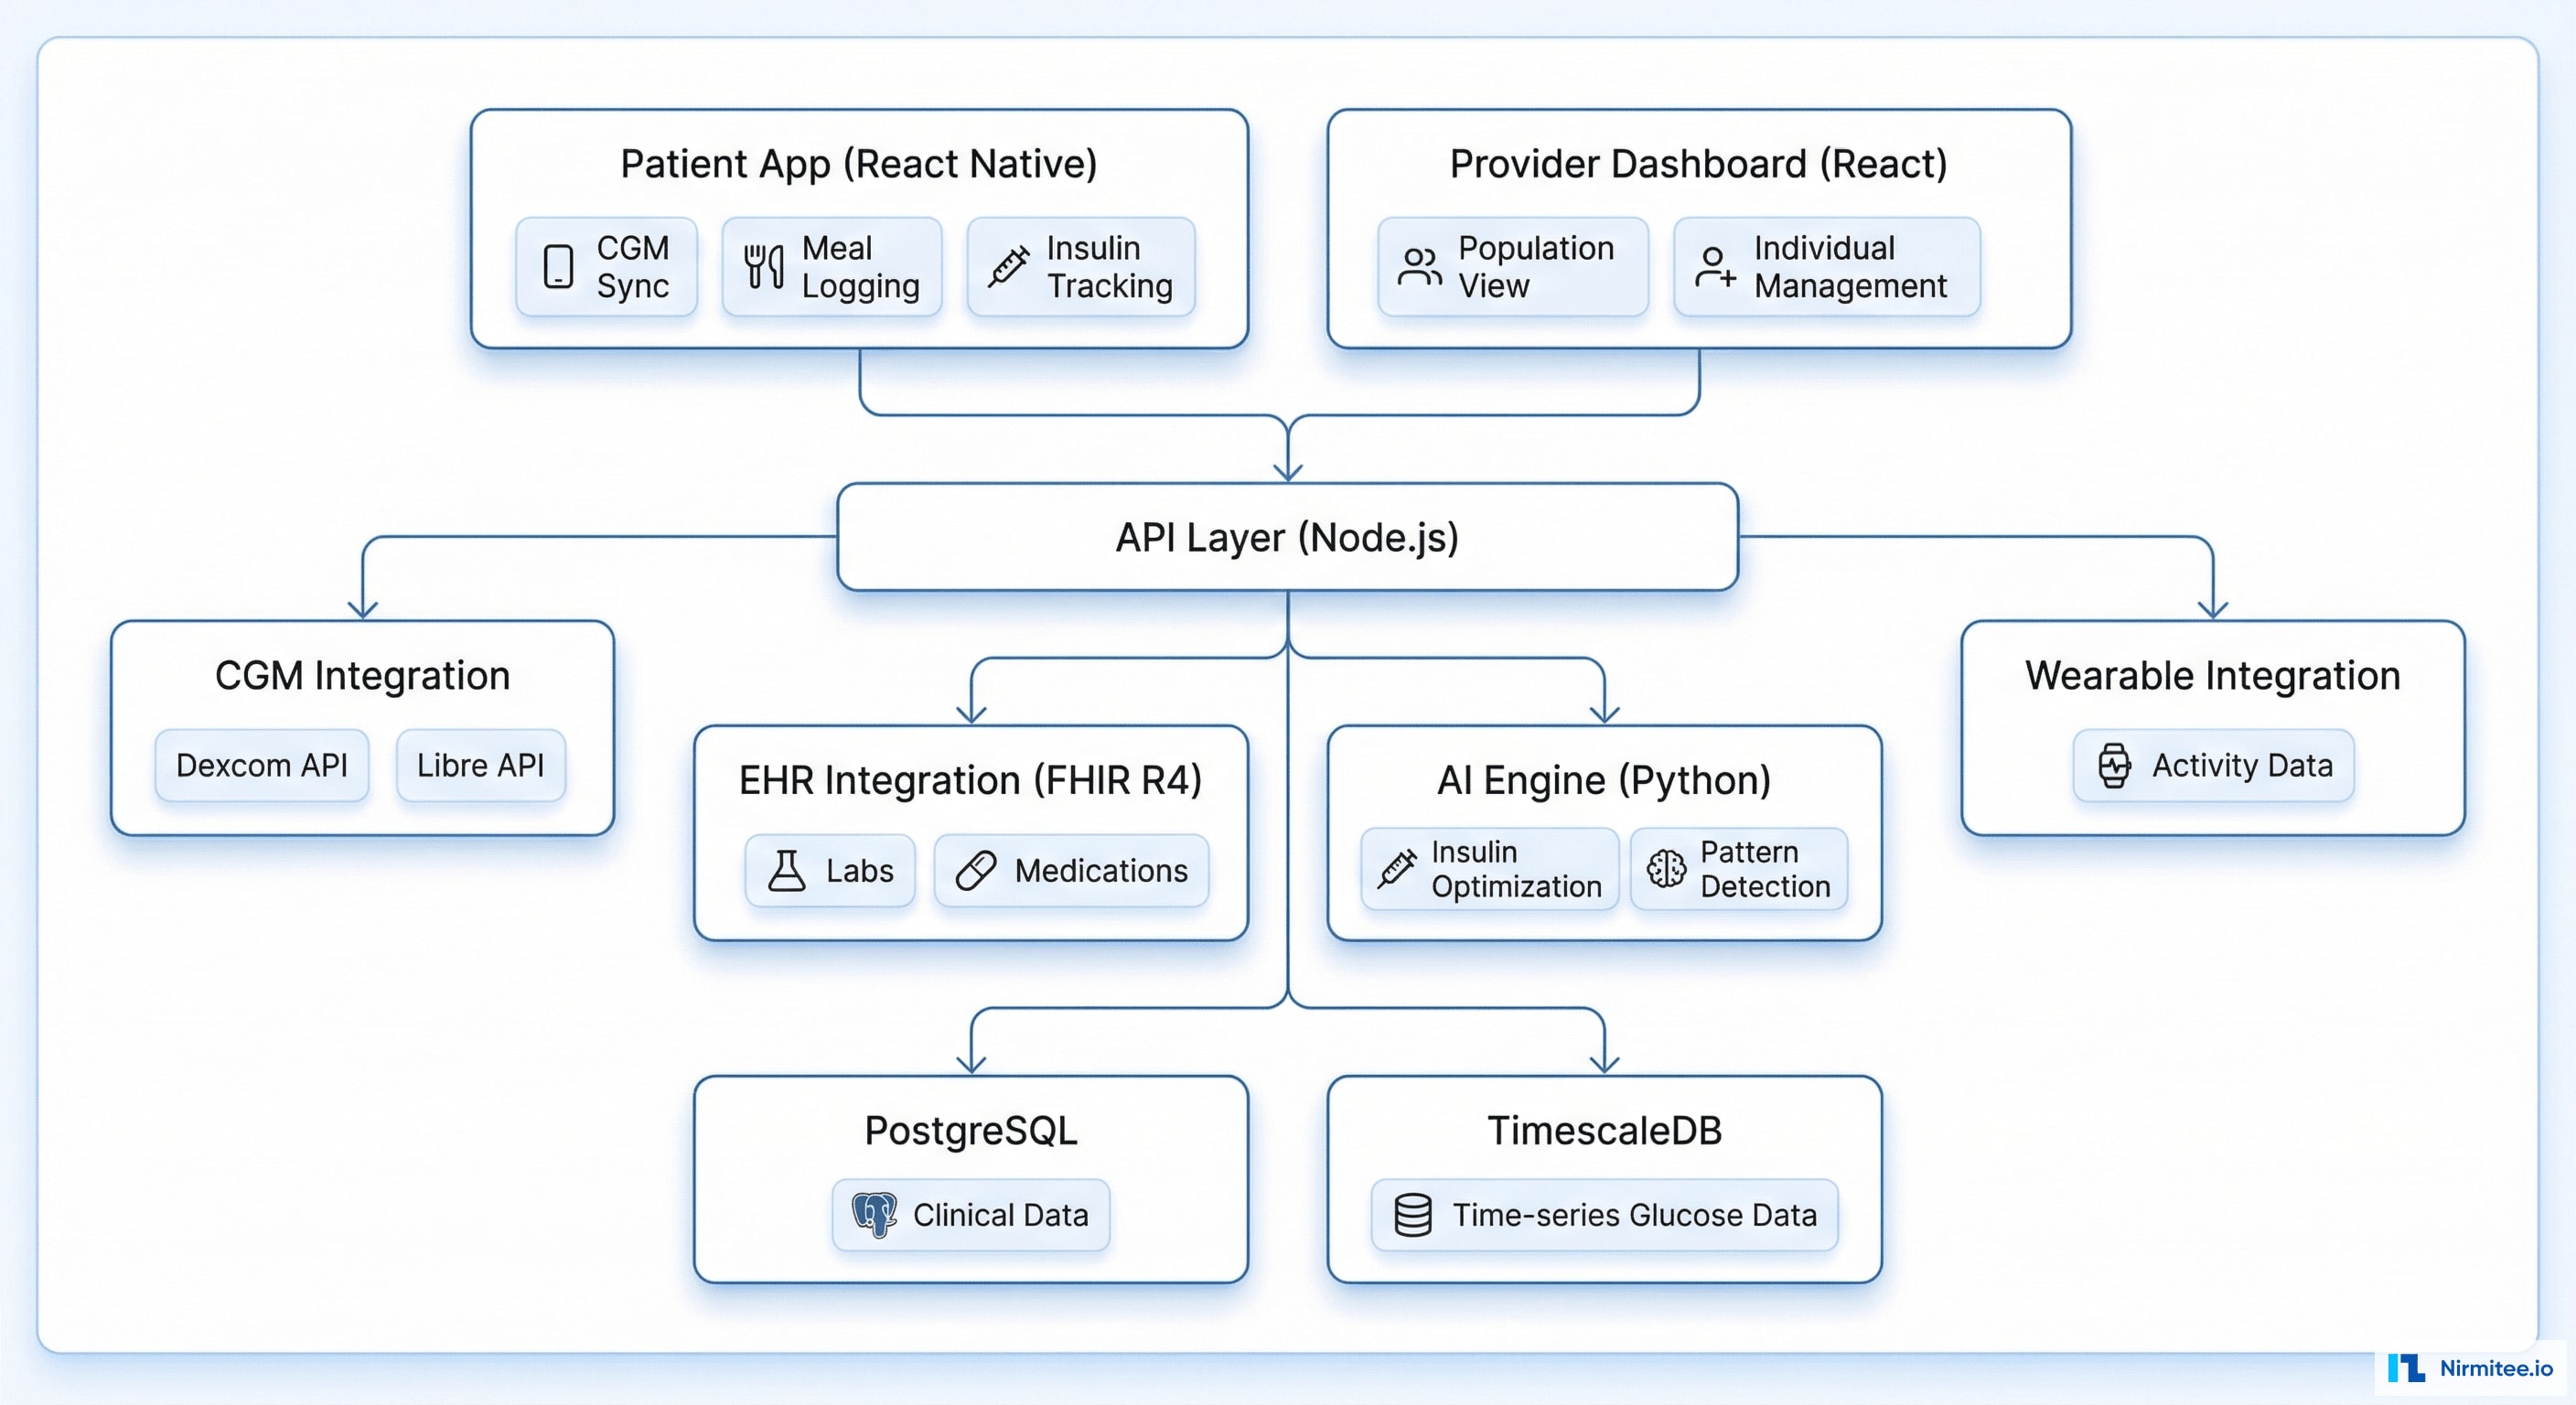
Technology Stack
| Layer | Technology | Purpose |
|---|---|---|
| Patient App | React Native | Meal logging, exercise tracking, CGM viewer, insulin log |
| Provider Dashboard | React + D3.js | CGM analysis, insulin optimization, population health |
| Backend | Node.js (Express) | API gateway, CGM data ingestion, business logic |
| Time-Series DB | TimescaleDB | 288 glucose readings/day × 480 patients = high-volume time-series |
| Clinical DB | PostgreSQL | Patient profiles, medications, care plans, labs |
| AI/ML | Python (scikit-learn, XGBoost) | Insulin optimization, pattern detection, risk prediction |
| CGM Integration | Dexcom API + Libre API | Real-time glucose data streaming |
| EHR Integration | FHIR R4 (Epic, Cerner) | Medications, labs (HbA1c, eGFR), conditions |
| Wearables | HealthKit, Fitbit API | Activity, sleep, heart rate data |
HbA1c Tracking & Care Plan
The longitudinal HbA1c view shows the patient's diabetes control over years — with treatment change markers showing which interventions drove improvements. The integrated care plan tracks all preventive care requirements: annual eye exams, foot exams, kidney function monitoring, lipid panels, and blood pressure management.
Meal & Exercise Logging
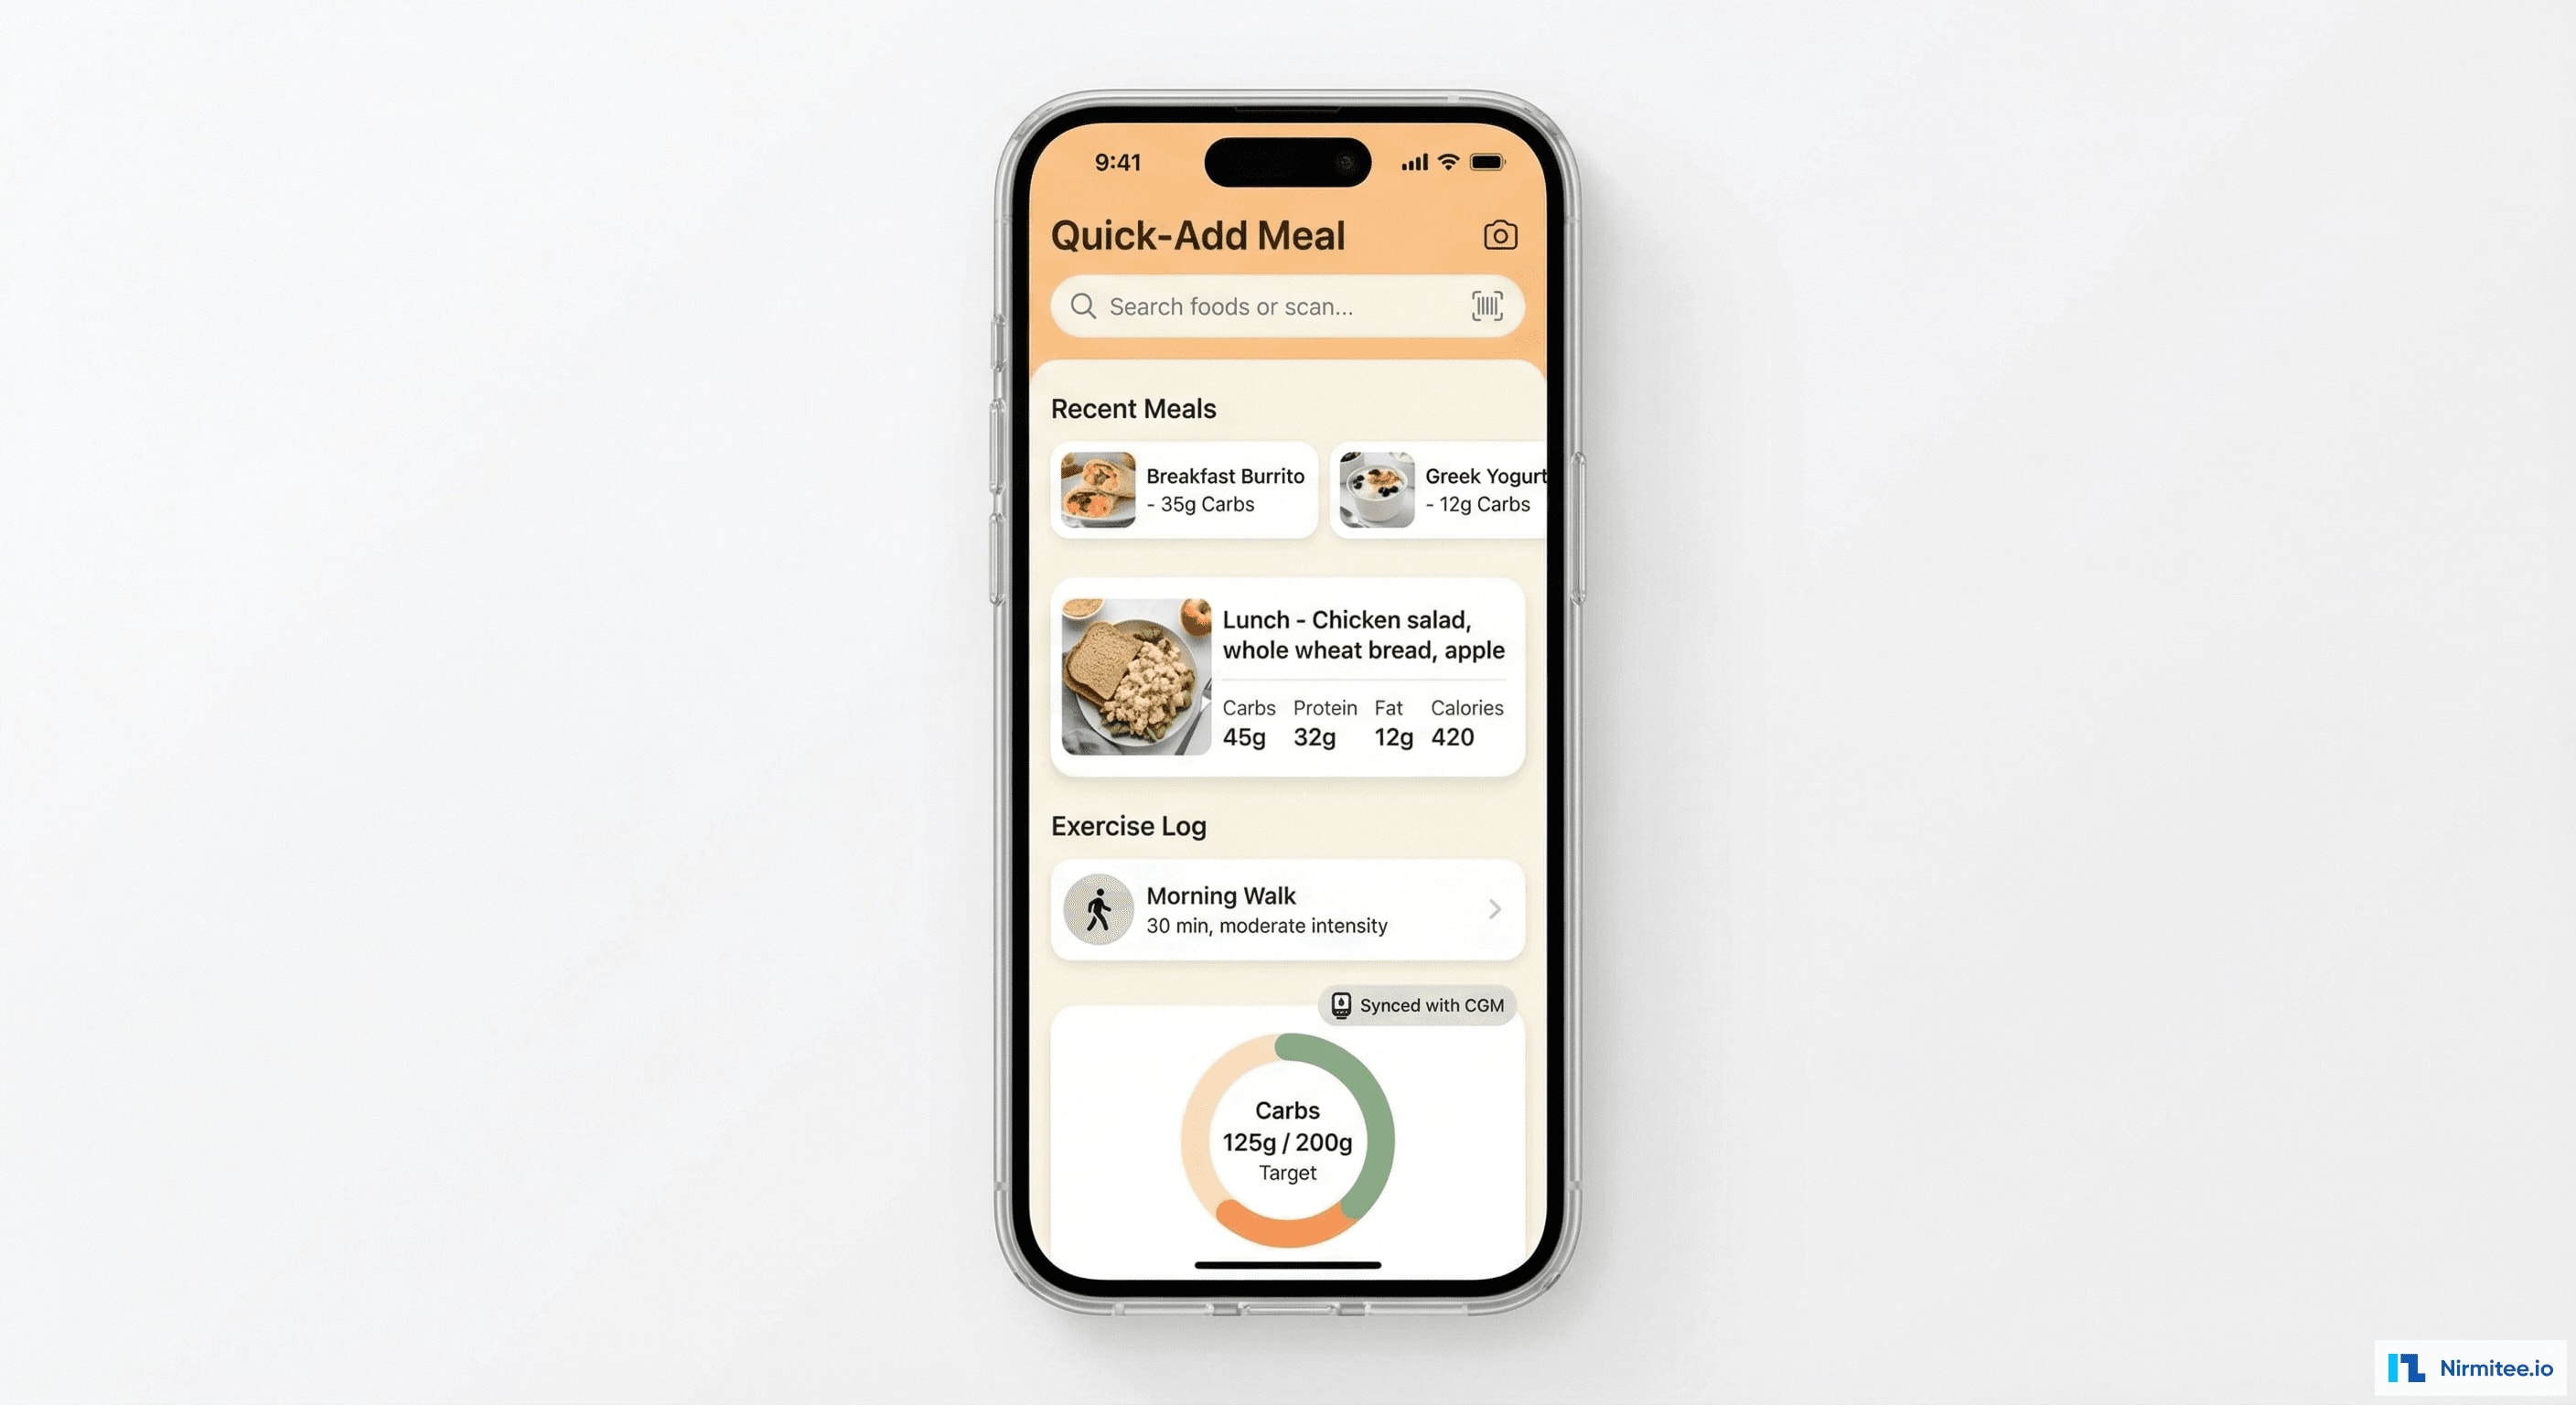
The patient app makes meal and exercise logging fast and frictionless:
- Photo-based meal logging: snap a photo → AI estimates carb content (with manual override) → logged with timestamp
- Food database search: 1M+ foods with nutritional data, recent meals one-tap re-log, custom meals saved
- Exercise auto-detection: Apple Watch/Fitbit activity data syncs automatically — walks, runs, gym sessions with duration and intensity
- Insulin dose logging: quick-entry for bolus doses with carb-to-insulin calculator built in
- CGM sync: real-time glucose value always visible in the app — the patient sees their current glucose alongside what they're eating
Population Health Dashboard
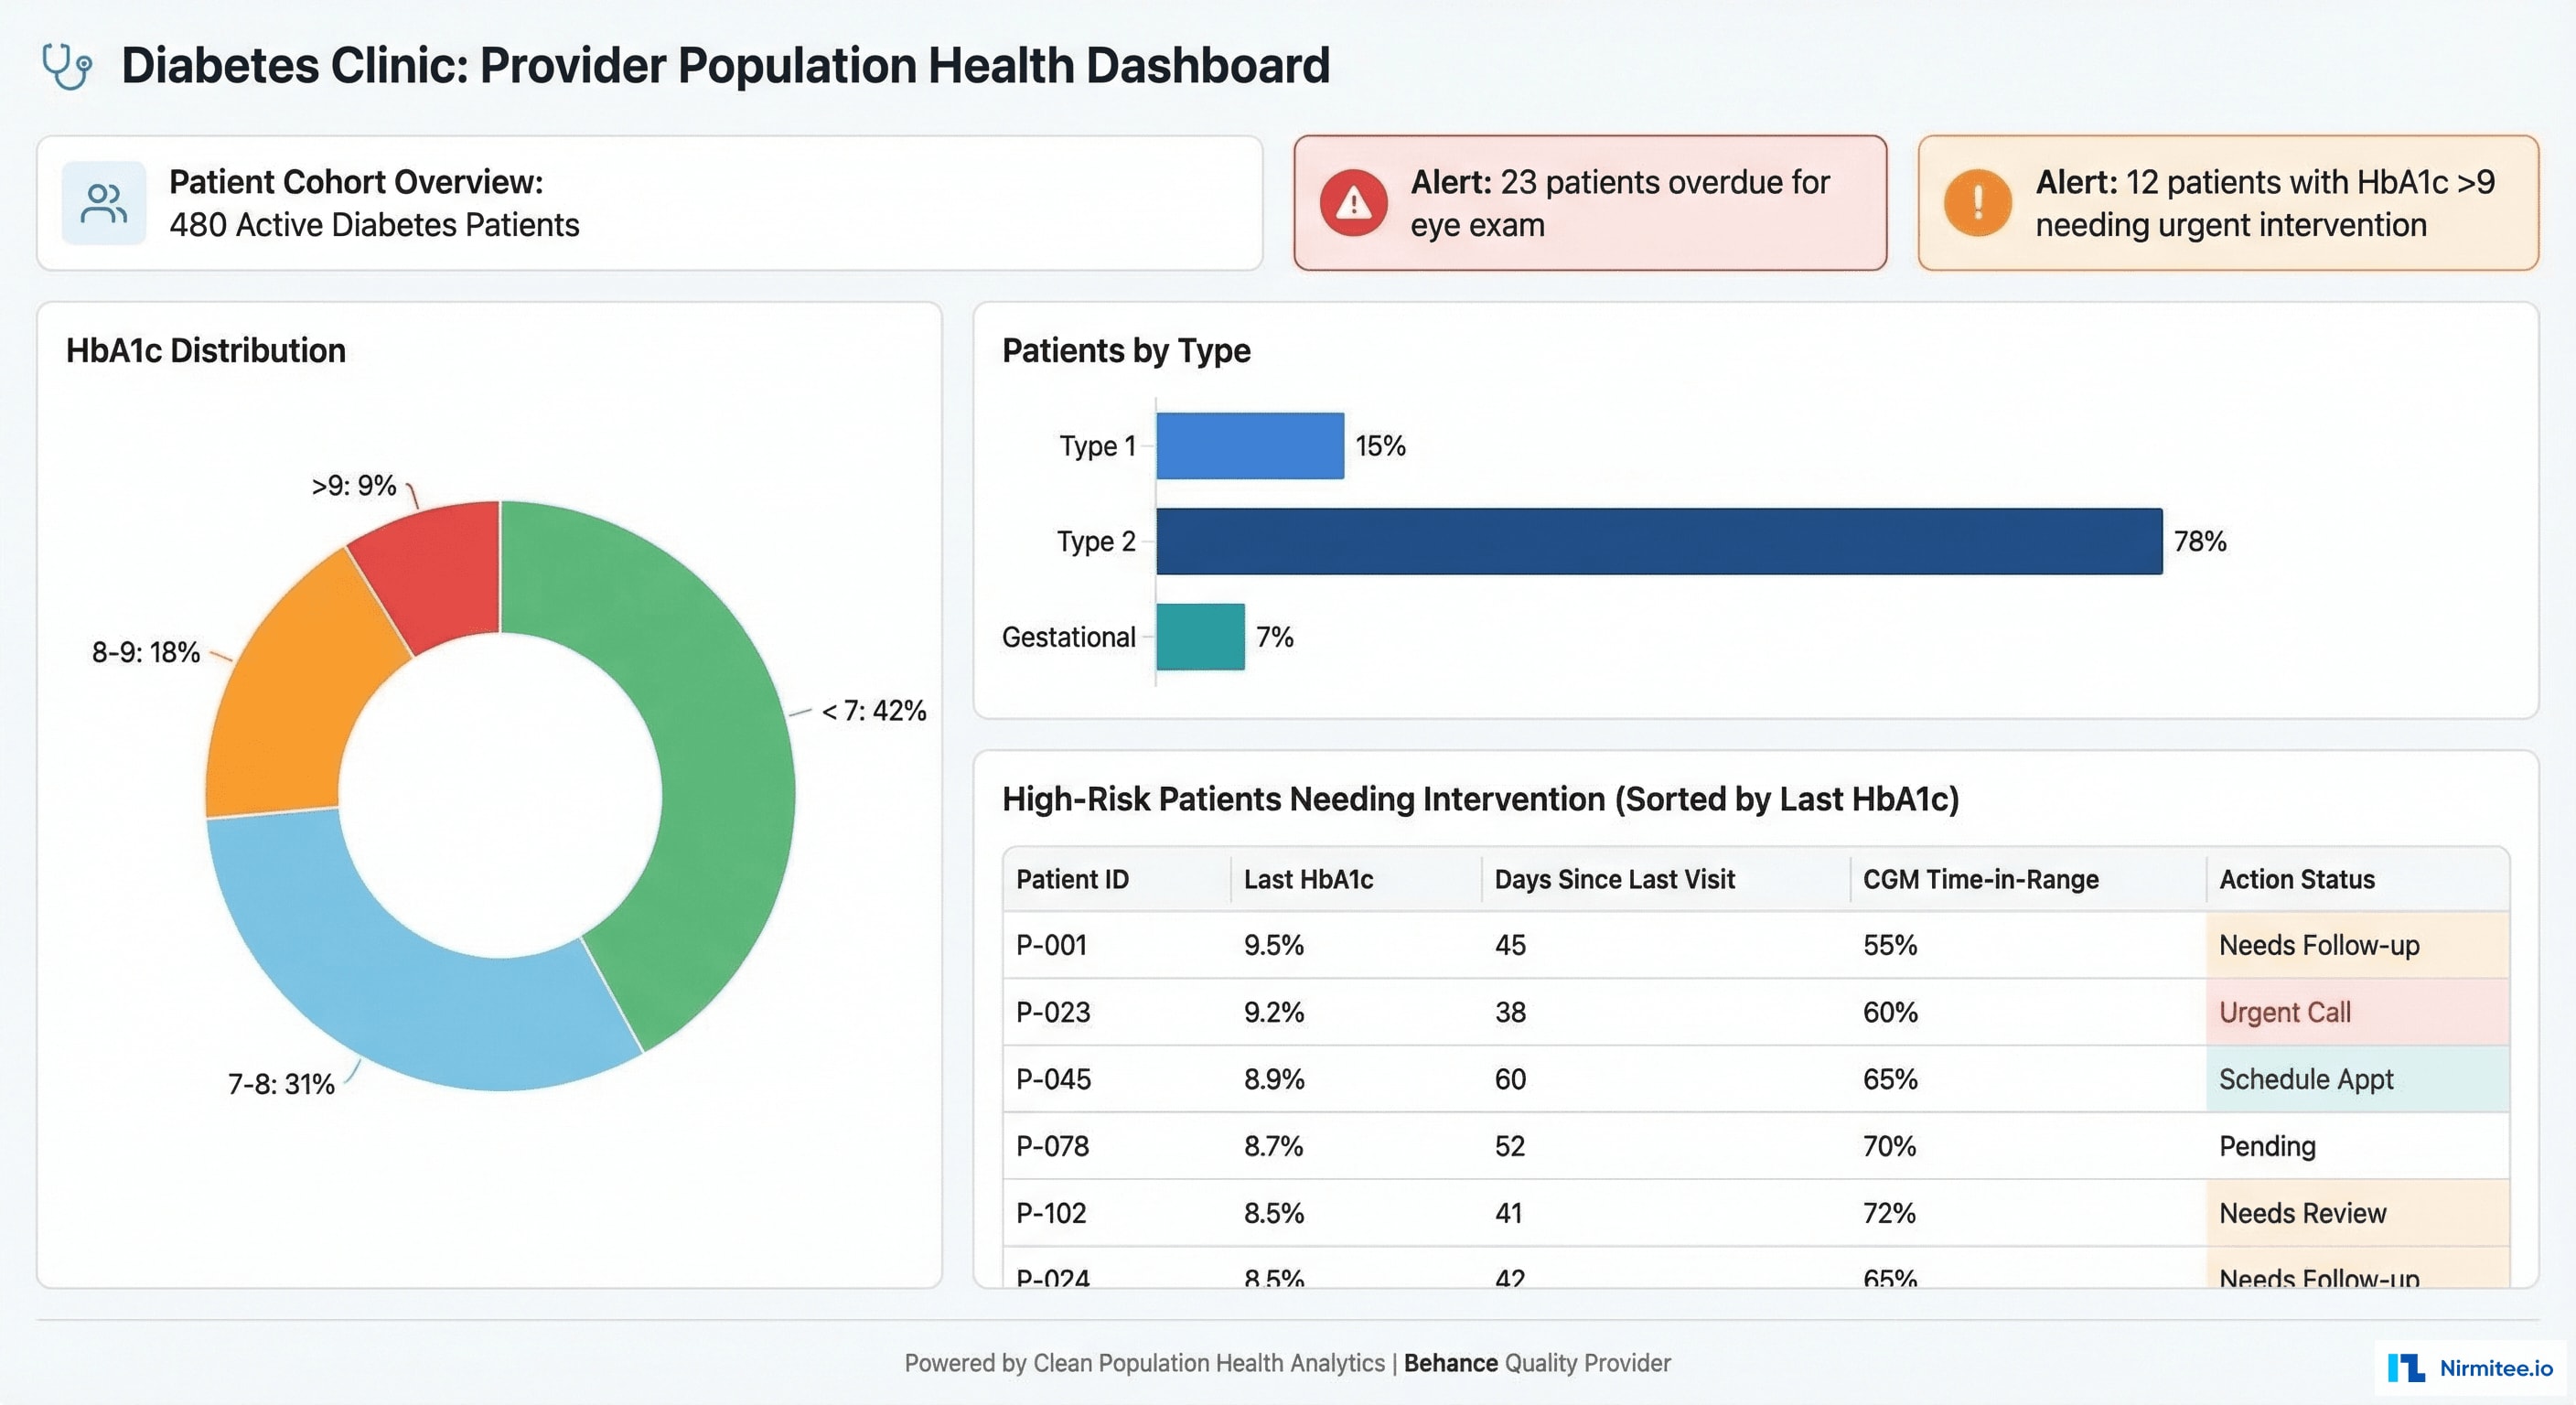
The endocrinology practice can now manage their entire diabetes cohort proactively:
- HbA1c distribution: how many patients are at target (<7%), borderline (7-8%), poorly controlled (8-9%), and critical (>9%)
- Risk stratification: patients sorted by composite risk score combining HbA1c trend, time-in-range, hypoglycemia frequency, and preventive care compliance
- Overdue screenings: automated alerts for patients needing eye exams, foot exams, or lab work
- High-priority interventions: "12 patients with HbA1c > 9% needing urgent insulin adjustment" — clickable to open individual patient dashboards
CGM + EHR Data Integration
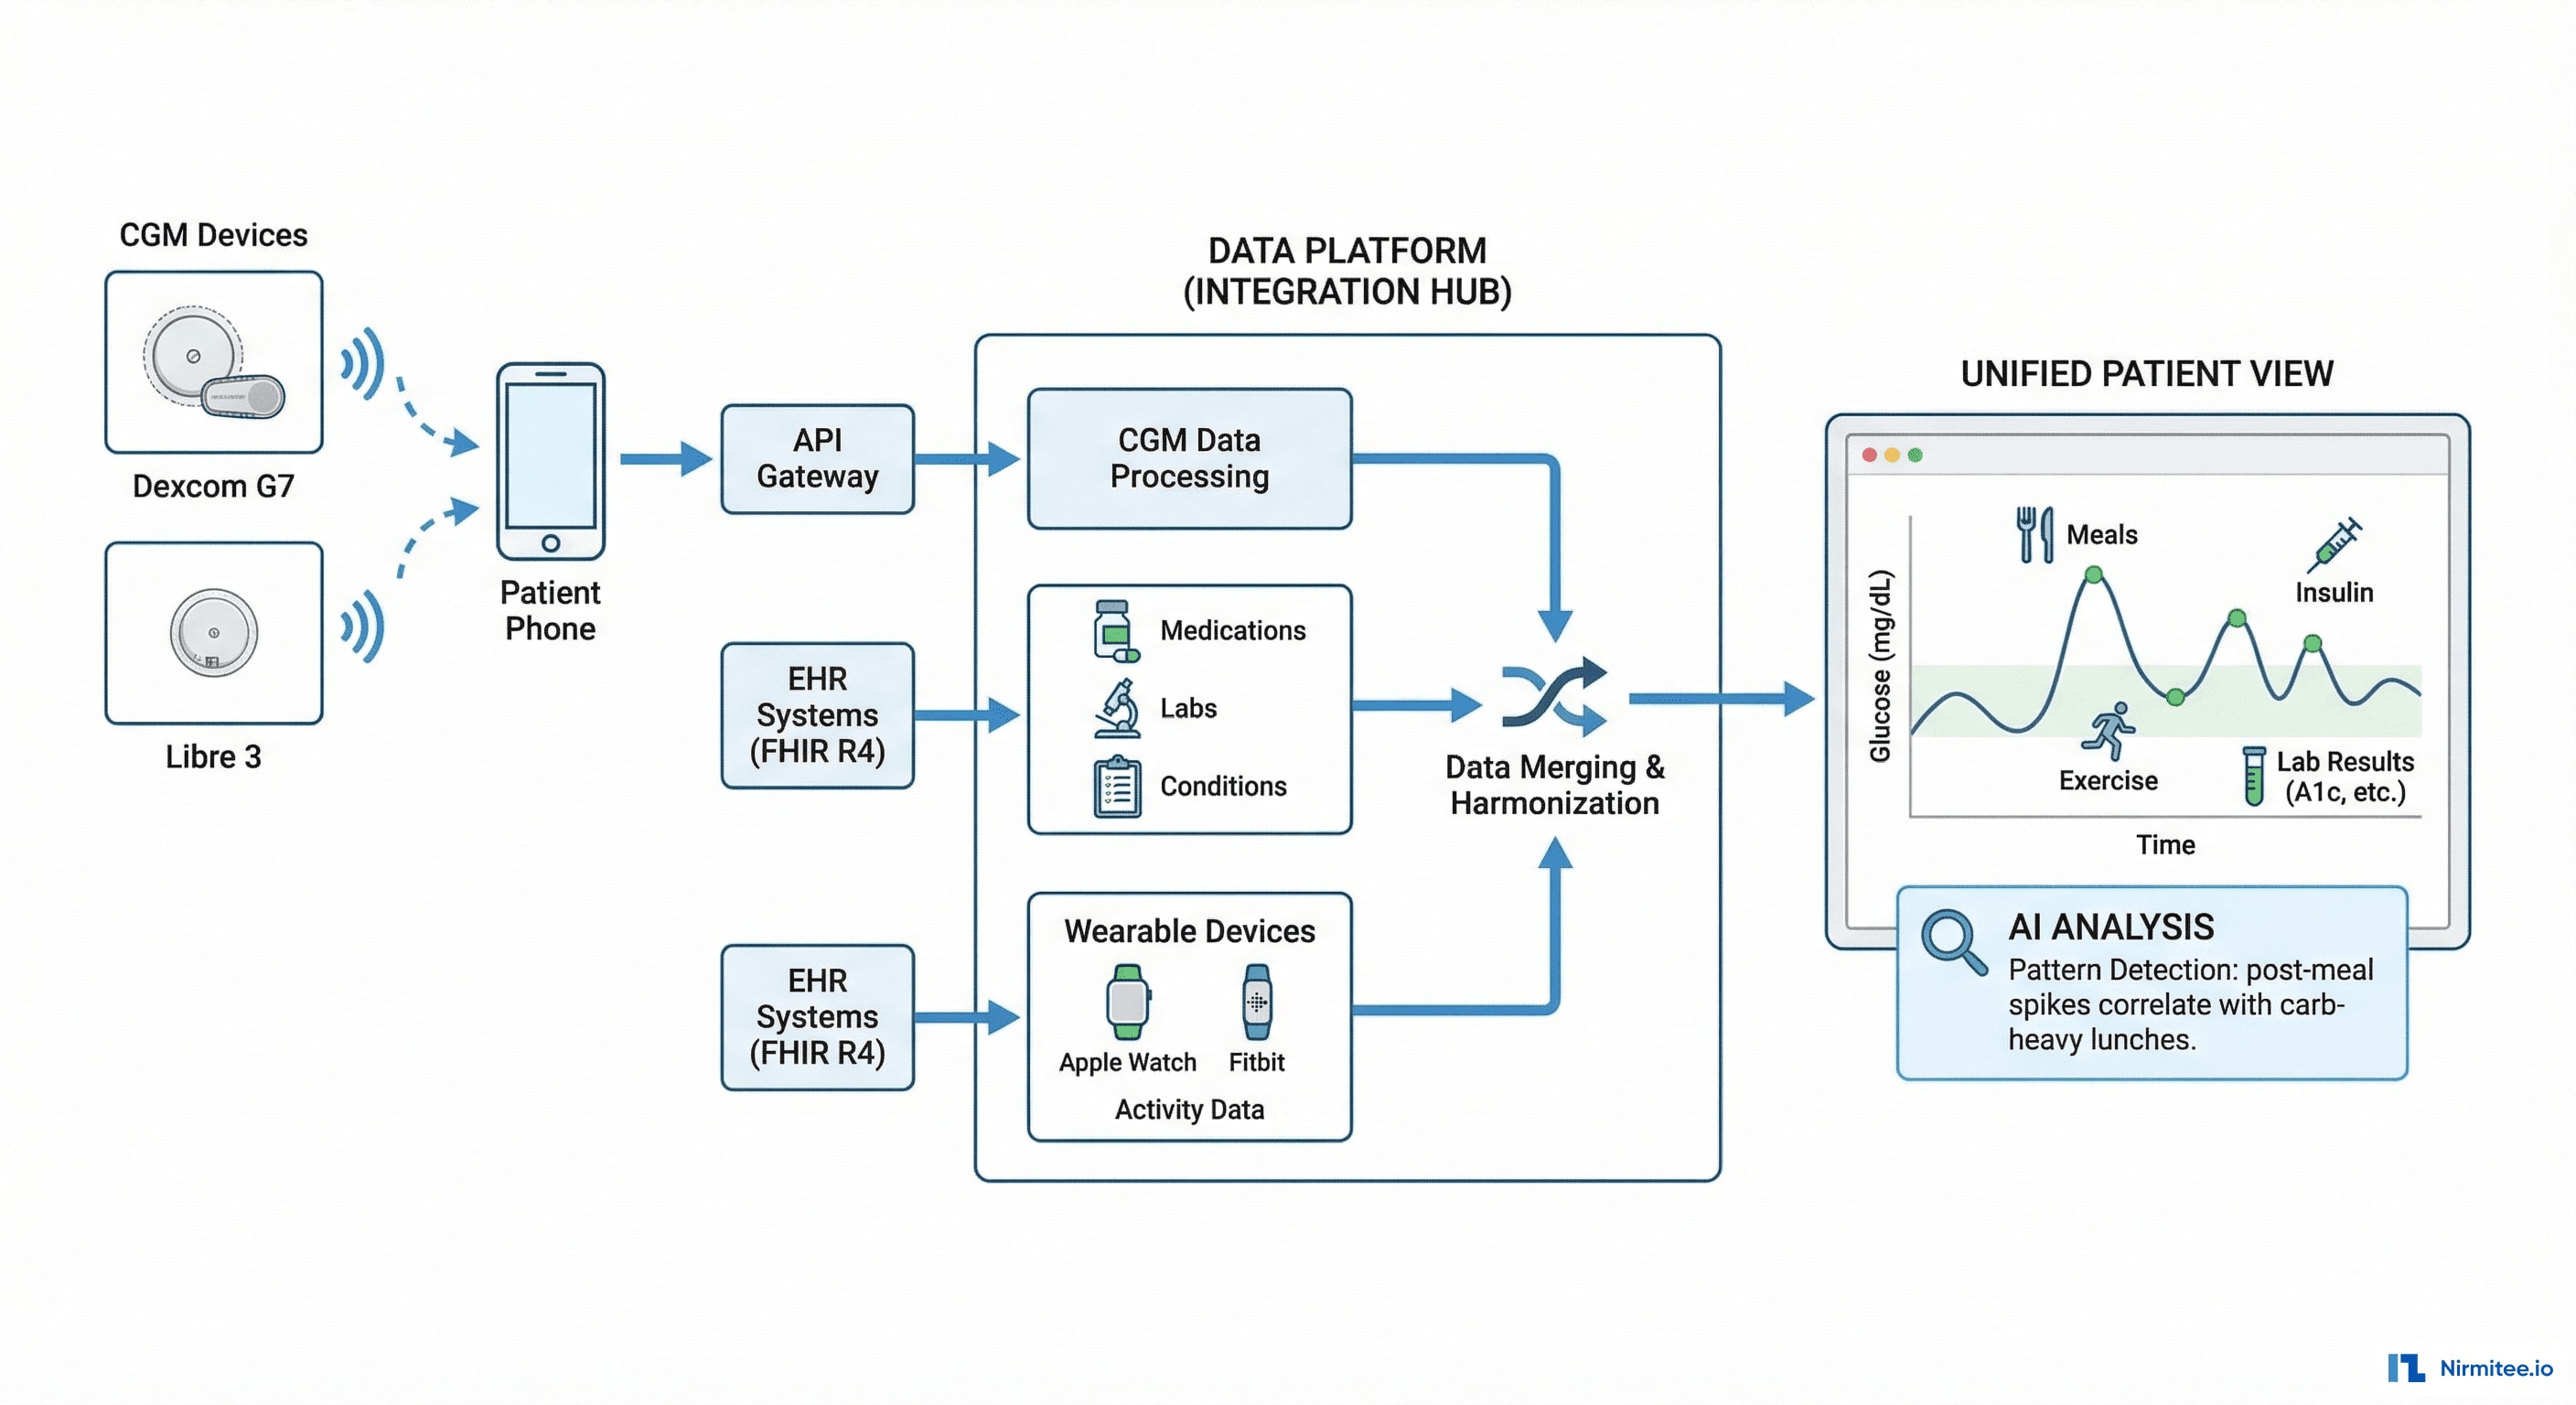
The platform merges three data streams that were previously siloed:
- CGM data (Dexcom/Libre): 288 glucose readings/day via manufacturer API, stored in TimescaleDB for time-series analysis
- EHR data (Epic/Cerner via FHIR): medications (insulin regimen, oral agents), labs (HbA1c, lipids, kidney function), conditions (type 1/2, complications)
- Patient-logged data: meals (carbs, timing), exercise (type, duration), insulin doses (bolus amounts, timing)
The AI engine correlates all three streams on a unified timeline — revealing patterns that no single data source can show.
Results

| Metric | Before | After (6 months) | Impact |
|---|---|---|---|
| Average HbA1c (cohort) | 8.2% | 6.5% | 21% improvement |
| Time in Range (70-180) | 48% | 72% | 50% improvement |
| Hypoglycemia events/month | 3.8 | 1.2 | 68% reduction |
| Data points per patient/day | 4 (finger sticks) | 288 (CGM) | 72x more data |
| Insulin adjustment frequency | Quarterly (at visit) | Weekly (AI-recommended) | 12x more responsive |
| AI recommendation acceptance | N/A | 84% | High physician trust |
| Patients at HbA1c target (<7%) | 28% | 58% | Doubled target achievement |
| ER visits for diabetes-related | 18/year (cohort) | 6/year | 67% reduction |
Clinical Impact
The 1.7% average HbA1c reduction across 480 patients translates to significant long-term outcomes based on DCCT/UKPDS evidence:
- 37% reduction in microvascular complications (retinopathy, nephropathy, neuropathy)
- 21% reduction in diabetes-related death
- 14% reduction in myocardial infarction risk
- Estimated $2.4M in avoided complications over 10 years for this patient cohort
Timeline
| Phase | Duration | Deliverables |
|---|---|---|
| Phase 1 | 6 weeks | CGM integration (Dexcom + Libre APIs), glucose dashboard, TimescaleDB setup, patient mobile app MVP |
| Phase 2 | 6 weeks | EHR integration (FHIR R4), insulin optimization AI, meal/exercise logging, provider dashboard |
| Phase 3 | 4 weeks | Population health tools, care plan tracking, AI training on historical data, wearable integration |
| Phase 4 | 4 weeks | Clinical validation with endocrinologists, pilot deployment, staff training, go-live with 480 patients |
Total: 5 months with 3 engineers + 1 data scientist + 1 clinical advisor (endocrinologist).
Lessons Learned
- TimescaleDB for glucose data was essential. 288 readings/day × 480 patients × 365 days = 50M+ rows/year. Standard PostgreSQL choked on time-range queries. TimescaleDB's hypertables + continuous aggregates made AGP charts render in under 200ms.
- AI recommendations must show their work. "Increase basal to 24u" alone gets questioned. "Increase basal to 24u because overnight glucose averaged 160 mg/dL across 14 nights with this specific pattern" gets accepted. Show the data behind every recommendation.
- Meal logging is the hardest engagement problem. CGM data flows automatically. Lab data syncs via FHIR. But meal logging requires patient action — and only 60% of patients log consistently. Photo-based logging improved compliance to 72%. Still a gap we're working on.
- The endocrinologist is in the loop, always. The AI recommends, the physician approves. This isn't just regulatory — it's clinical. The AI doesn't know about the patient's upcoming vacation, their insurance formulary, or their fear of needles. The physician adds the human context that makes recommendations actionable.
Share
Related Case Studies
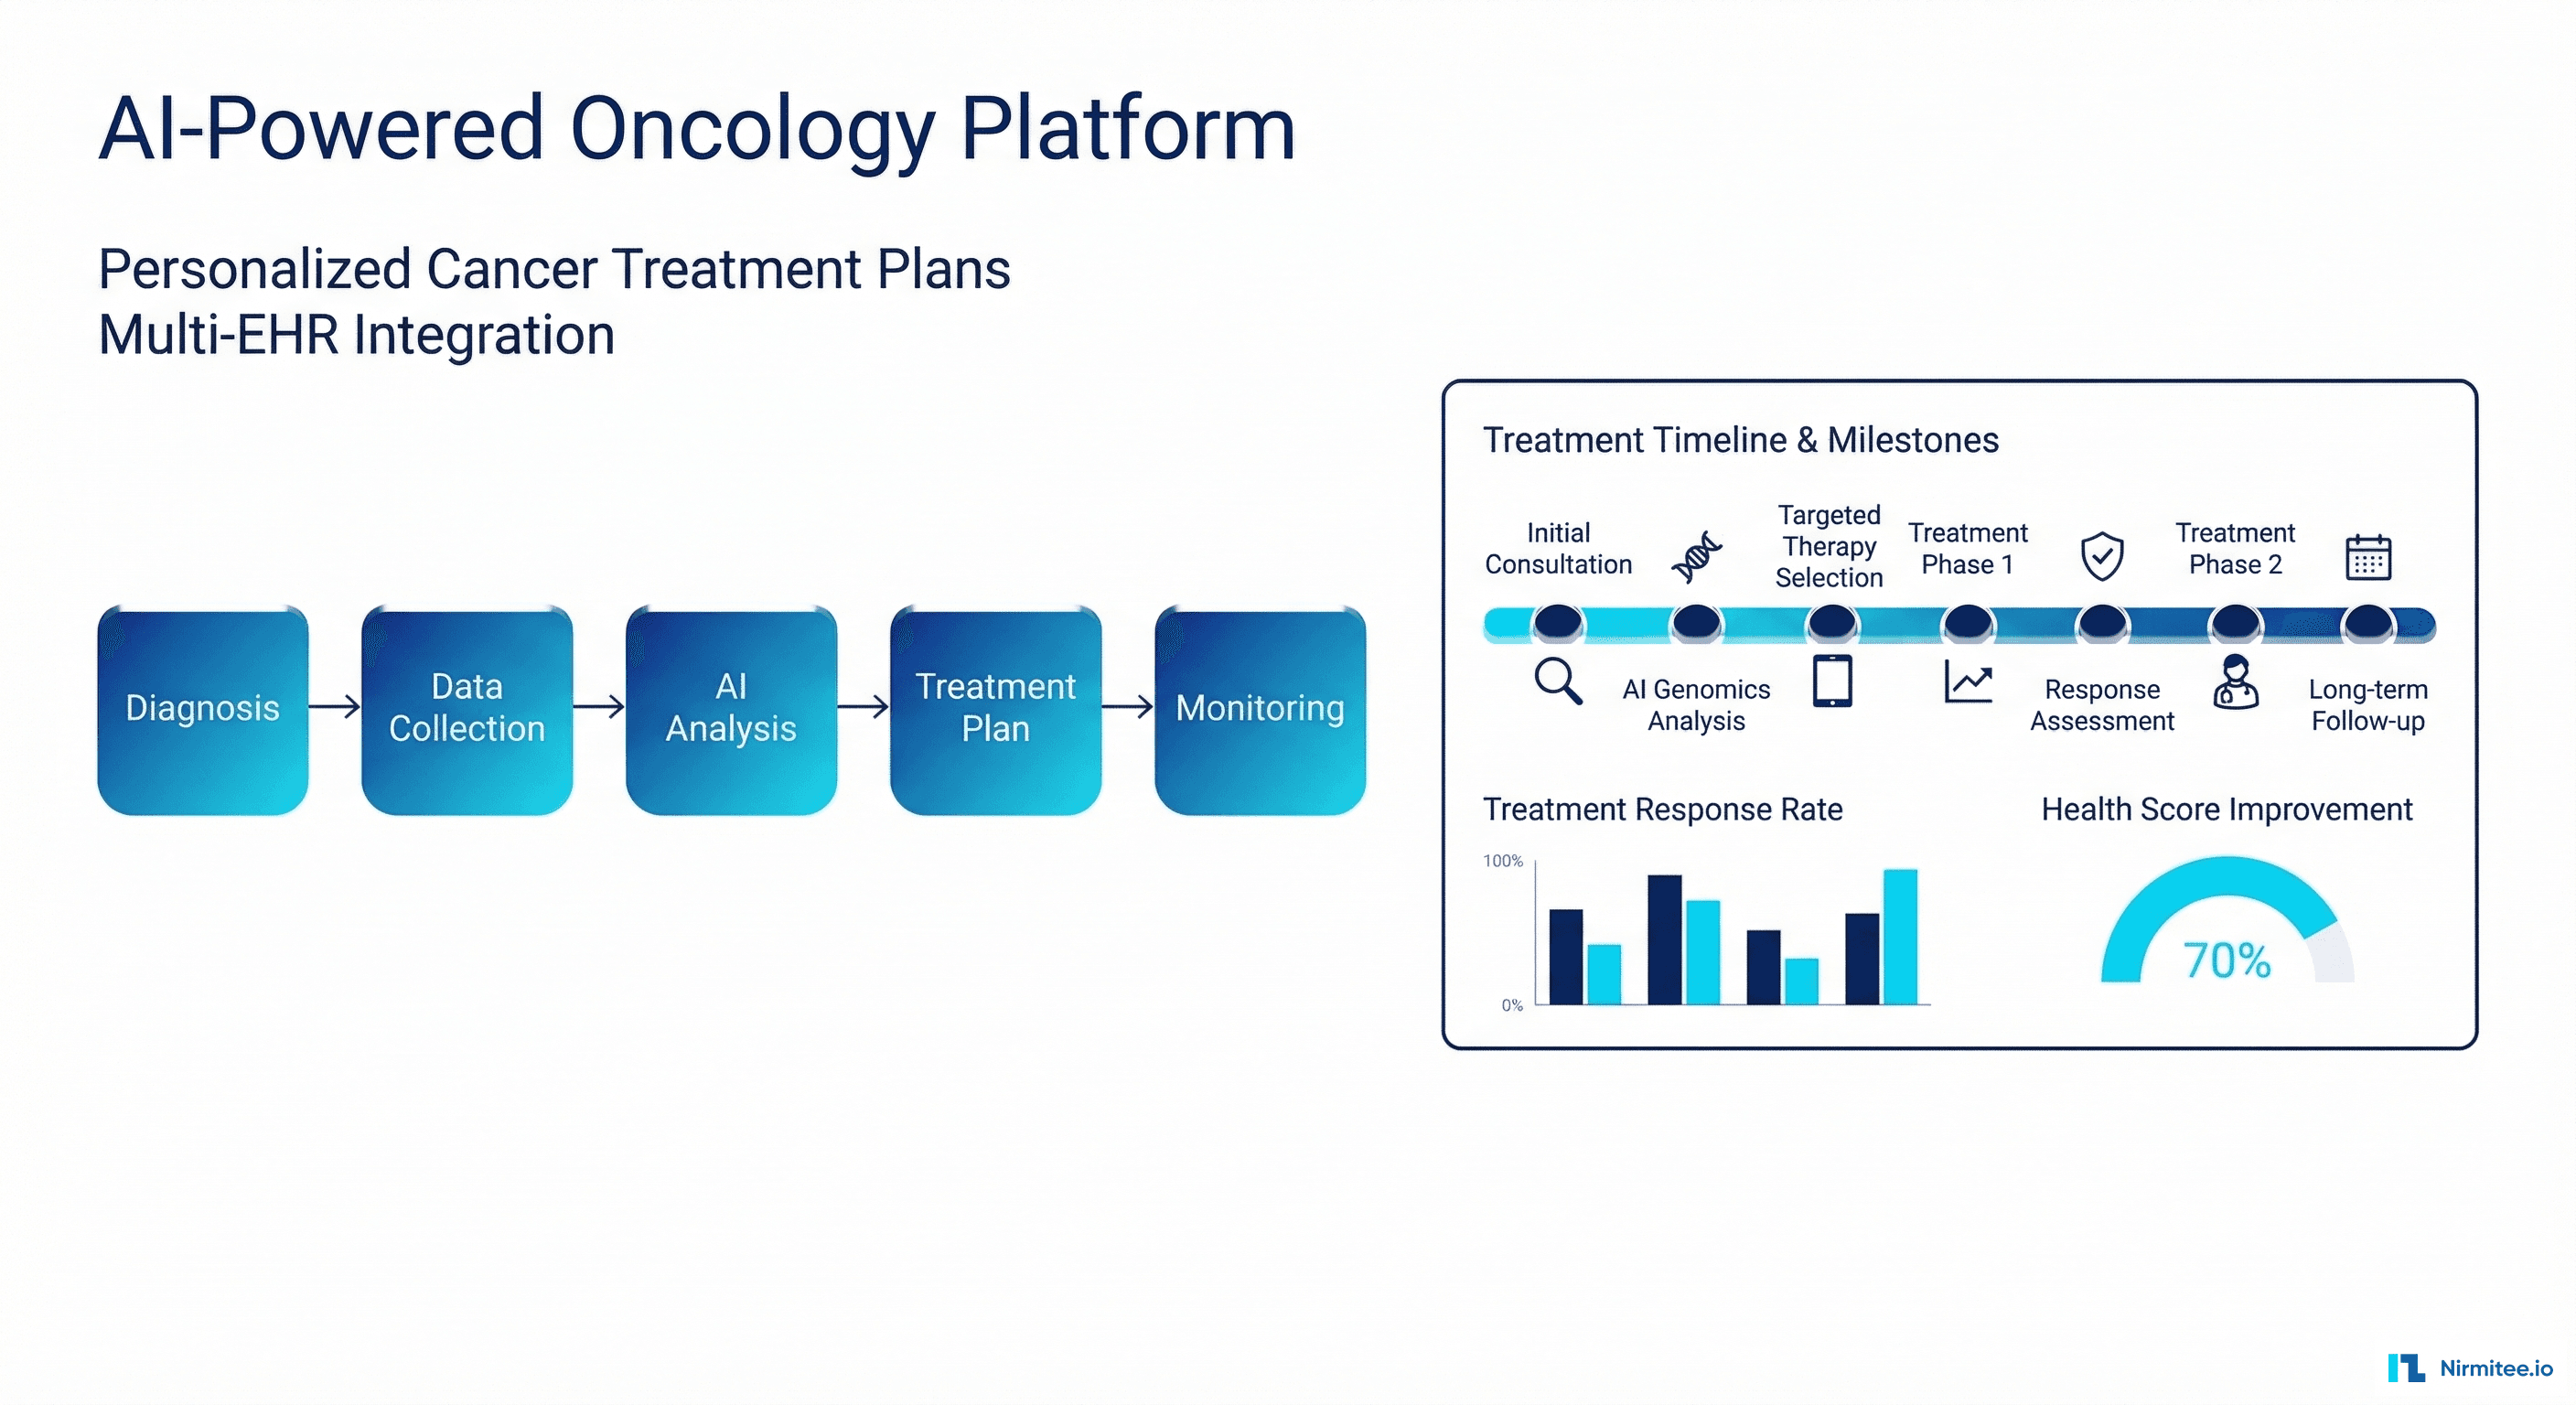
AI-Powered Personalized Oncology Treatment Platform: A Technical Case Study
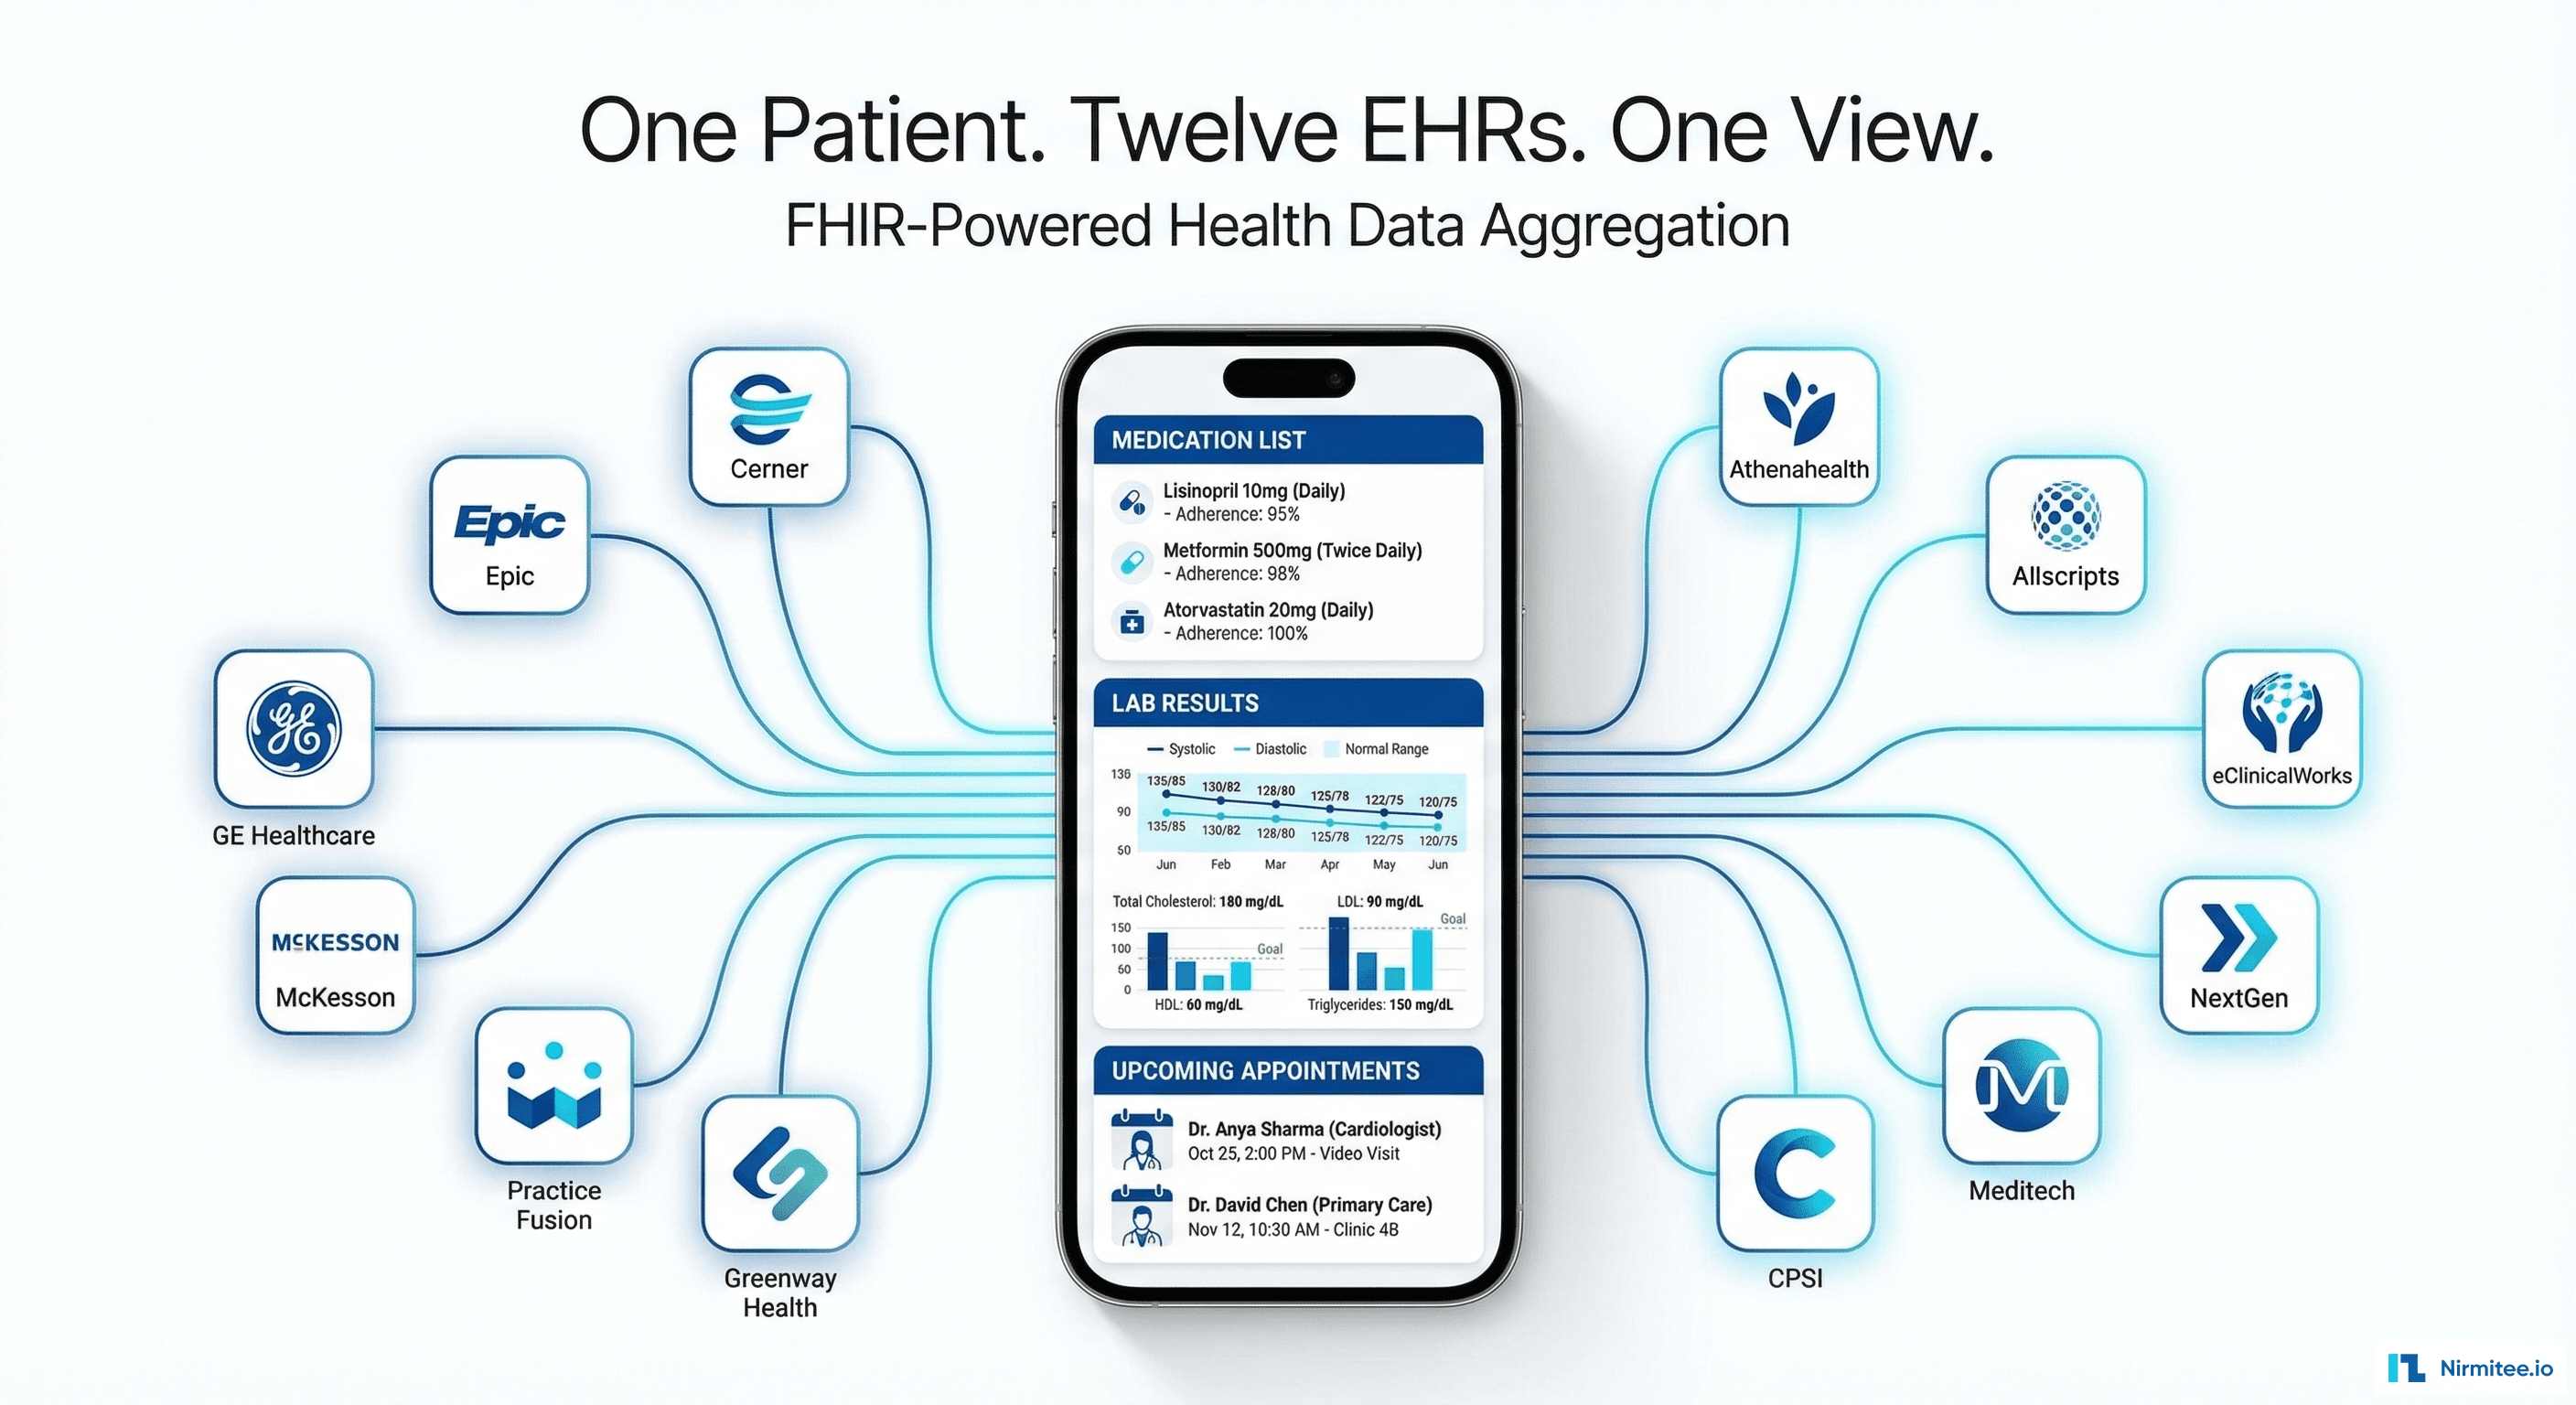
Building a Patient-First Health Record Platform: Connecting 12 US EMRs Into One View