Healthcare Data Lake: Medallion Architecture for Unified Patient Intelligence Across 8 Systems
Executive Summary
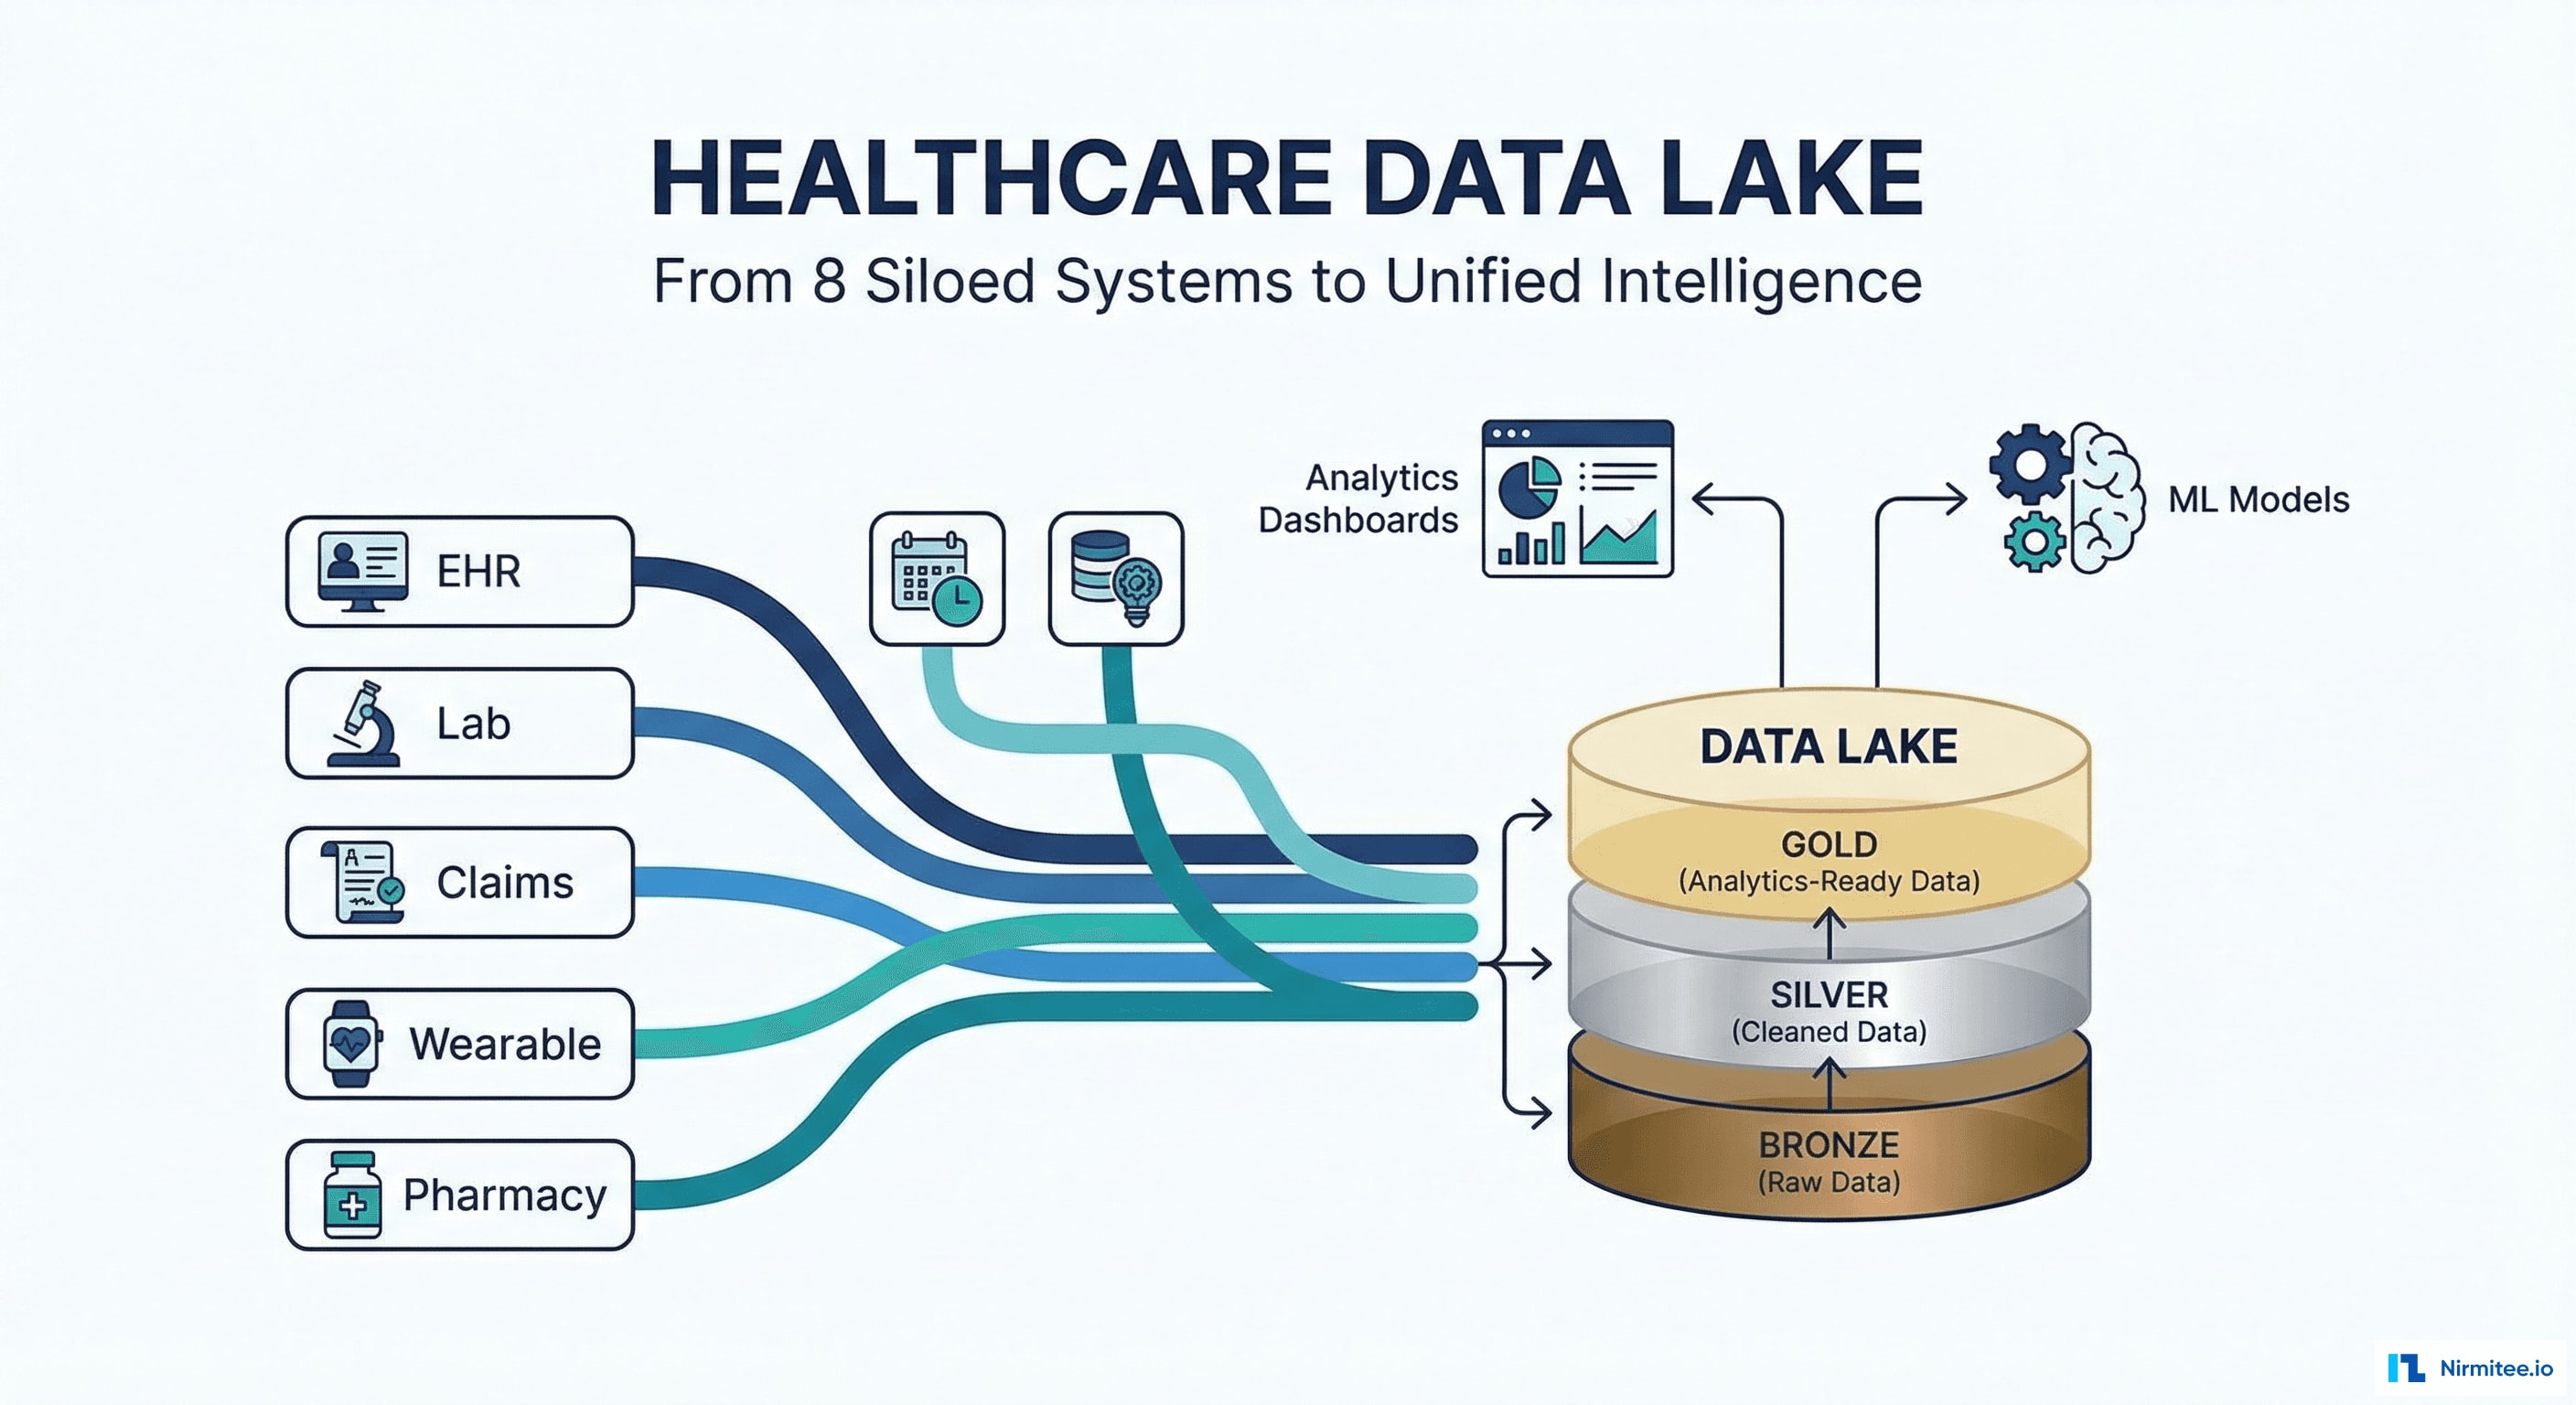
A US health system with 8 siloed data systems — EHR, lab, pharmacy, claims, wearables, public health, scheduling, and billing — needed a unified analytics platform. Their existing approach: a data analyst spent 2 weeks pulling Excel exports from each system, manually joining data, and producing a quarterly quality report that was already outdated by the time it was presented.
We built a healthcare data lake using medallion architecture (Bronze → Silver → Gold layers), ingesting data from all 8 sources through streaming (Apache Kafka) and batch pipelines (Apache Spark), normalizing everything to FHIR R4 in the Silver layer, and producing analytics-ready datasets in the Gold layer for dashboards, ML models, and regulatory reporting.
Results: report generation from 2 weeks to real-time, 3 ML models in production (readmission prediction AUC 0.84, diabetes progression 0.79, ED utilization 0.82), and Patient 360 views unifying data from all 8 systems for 45,000 patients.
The Problem: 8 Systems, Zero Insights
Healthcare generates massive amounts of data — but it's trapped in silos. This health system had rich clinical data in their EHR, comprehensive lab data in their LIS, financial data in their claims system, and prescription data in their pharmacy system. But no system could answer questions that required data from more than one source.
- "Which diabetic patients are at highest readmission risk?" — requires EHR (conditions), lab (HbA1c), claims (prior admissions), pharmacy (medication adherence). No single system has all four.
- "What's our HEDIS quality performance?" — requires clinical data + claims data + pharmacy data. Manual calculation took 2 weeks and was immediately outdated.
- "Which patients should we prioritize for outreach?" — requires a risk model combining clinical, financial, and behavioral data. Impossible without a unified data layer.
Medallion Architecture
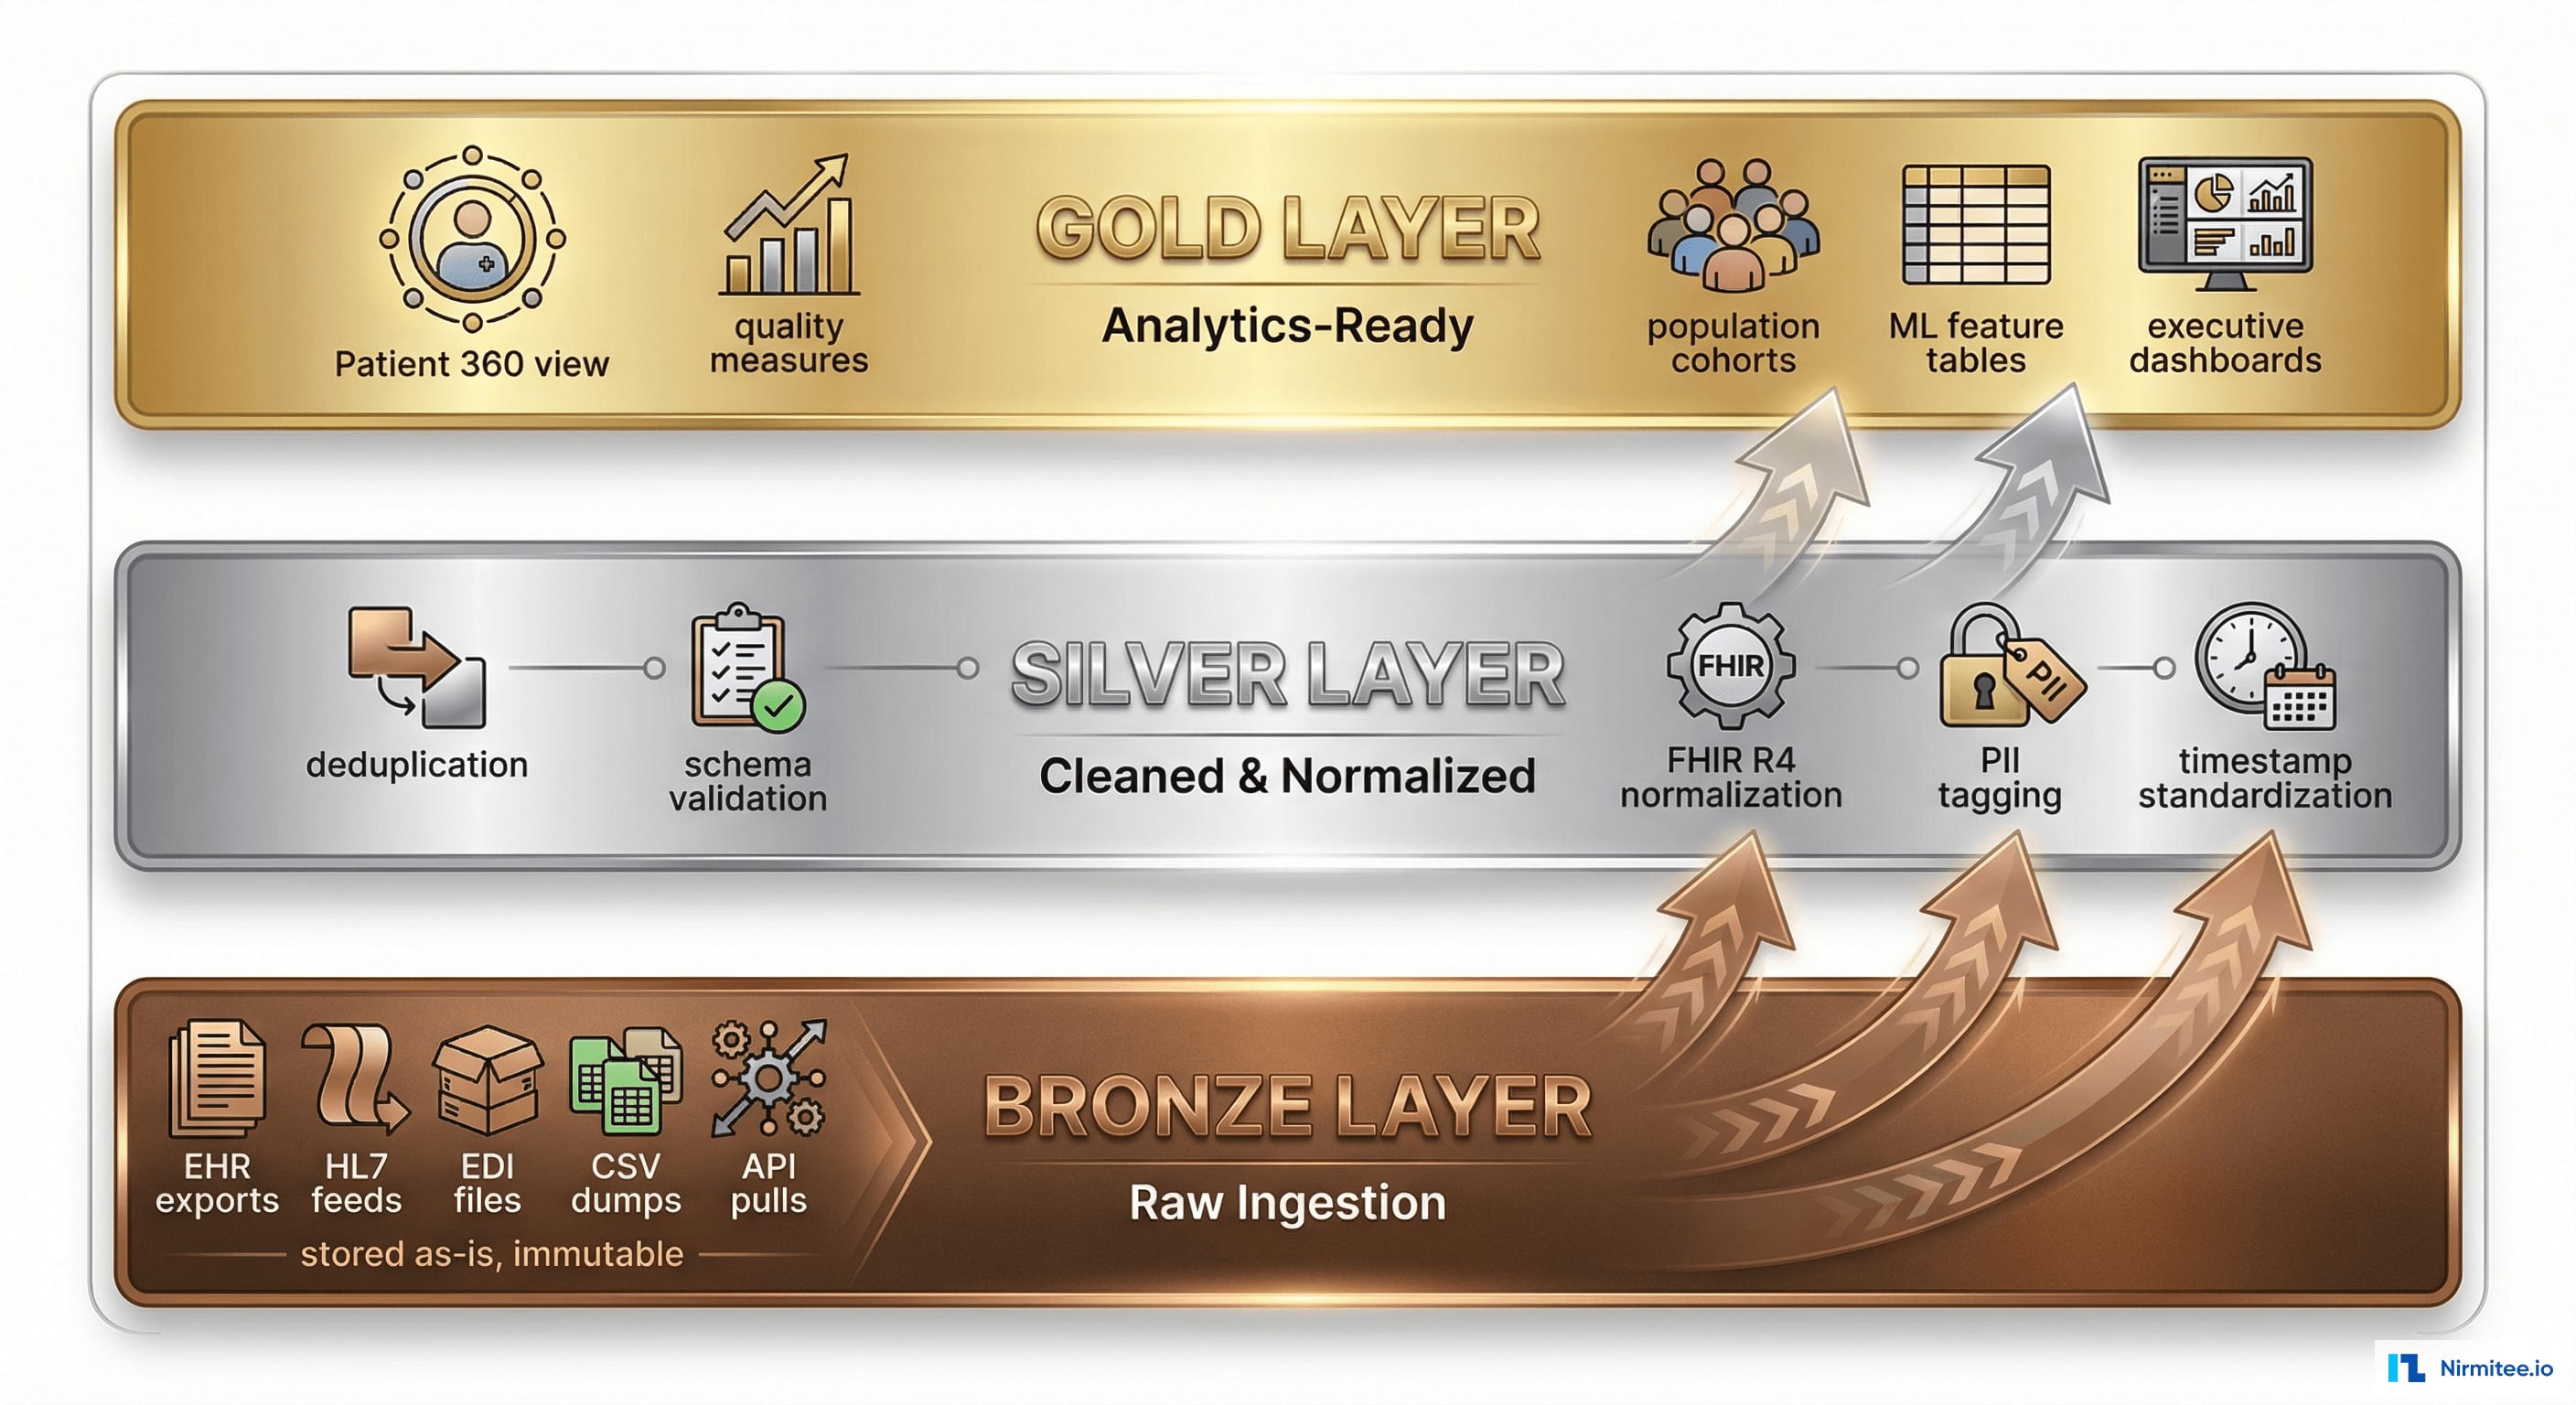
Bronze Layer (Raw)
Every data source ingested exactly as-is — HL7 messages, EDI files, CSV exports, API responses. Stored in S3 as immutable raw files. No transformation. If something goes wrong downstream, we can always reprocess from Bronze.
Silver Layer (Cleaned + Normalized)
Bronze data transformed into clean, validated, FHIR R4-normalized records:
- Deduplication across systems (same patient in EHR + lab + pharmacy = one patient record)
- Schema validation and data type enforcement
- Terminology normalization (medications → RxNorm, diagnoses → ICD-10, procedures → CPT)
- PII tagging for HIPAA compliance (all PHI fields identified and access-controlled)
- Timestamp standardization (UTC, timezone-aware)
Gold Layer (Analytics-Ready)
Pre-computed datasets optimized for specific use cases:
- Patient 360: unified patient profile combining data from all 8 sources
- Quality measures: HEDIS, CMS Stars, and custom quality metrics pre-calculated
- Population cohorts: patient segments by condition, risk level, payer, provider
- ML feature tables: pre-engineered features ready for model training
- Executive dashboards: aggregated KPIs for operational and clinical leadership
Data Pipeline Monitoring

Real-time visibility into every data pipeline — 847,000 records/day processed with 99.8% success rate.
Architecture
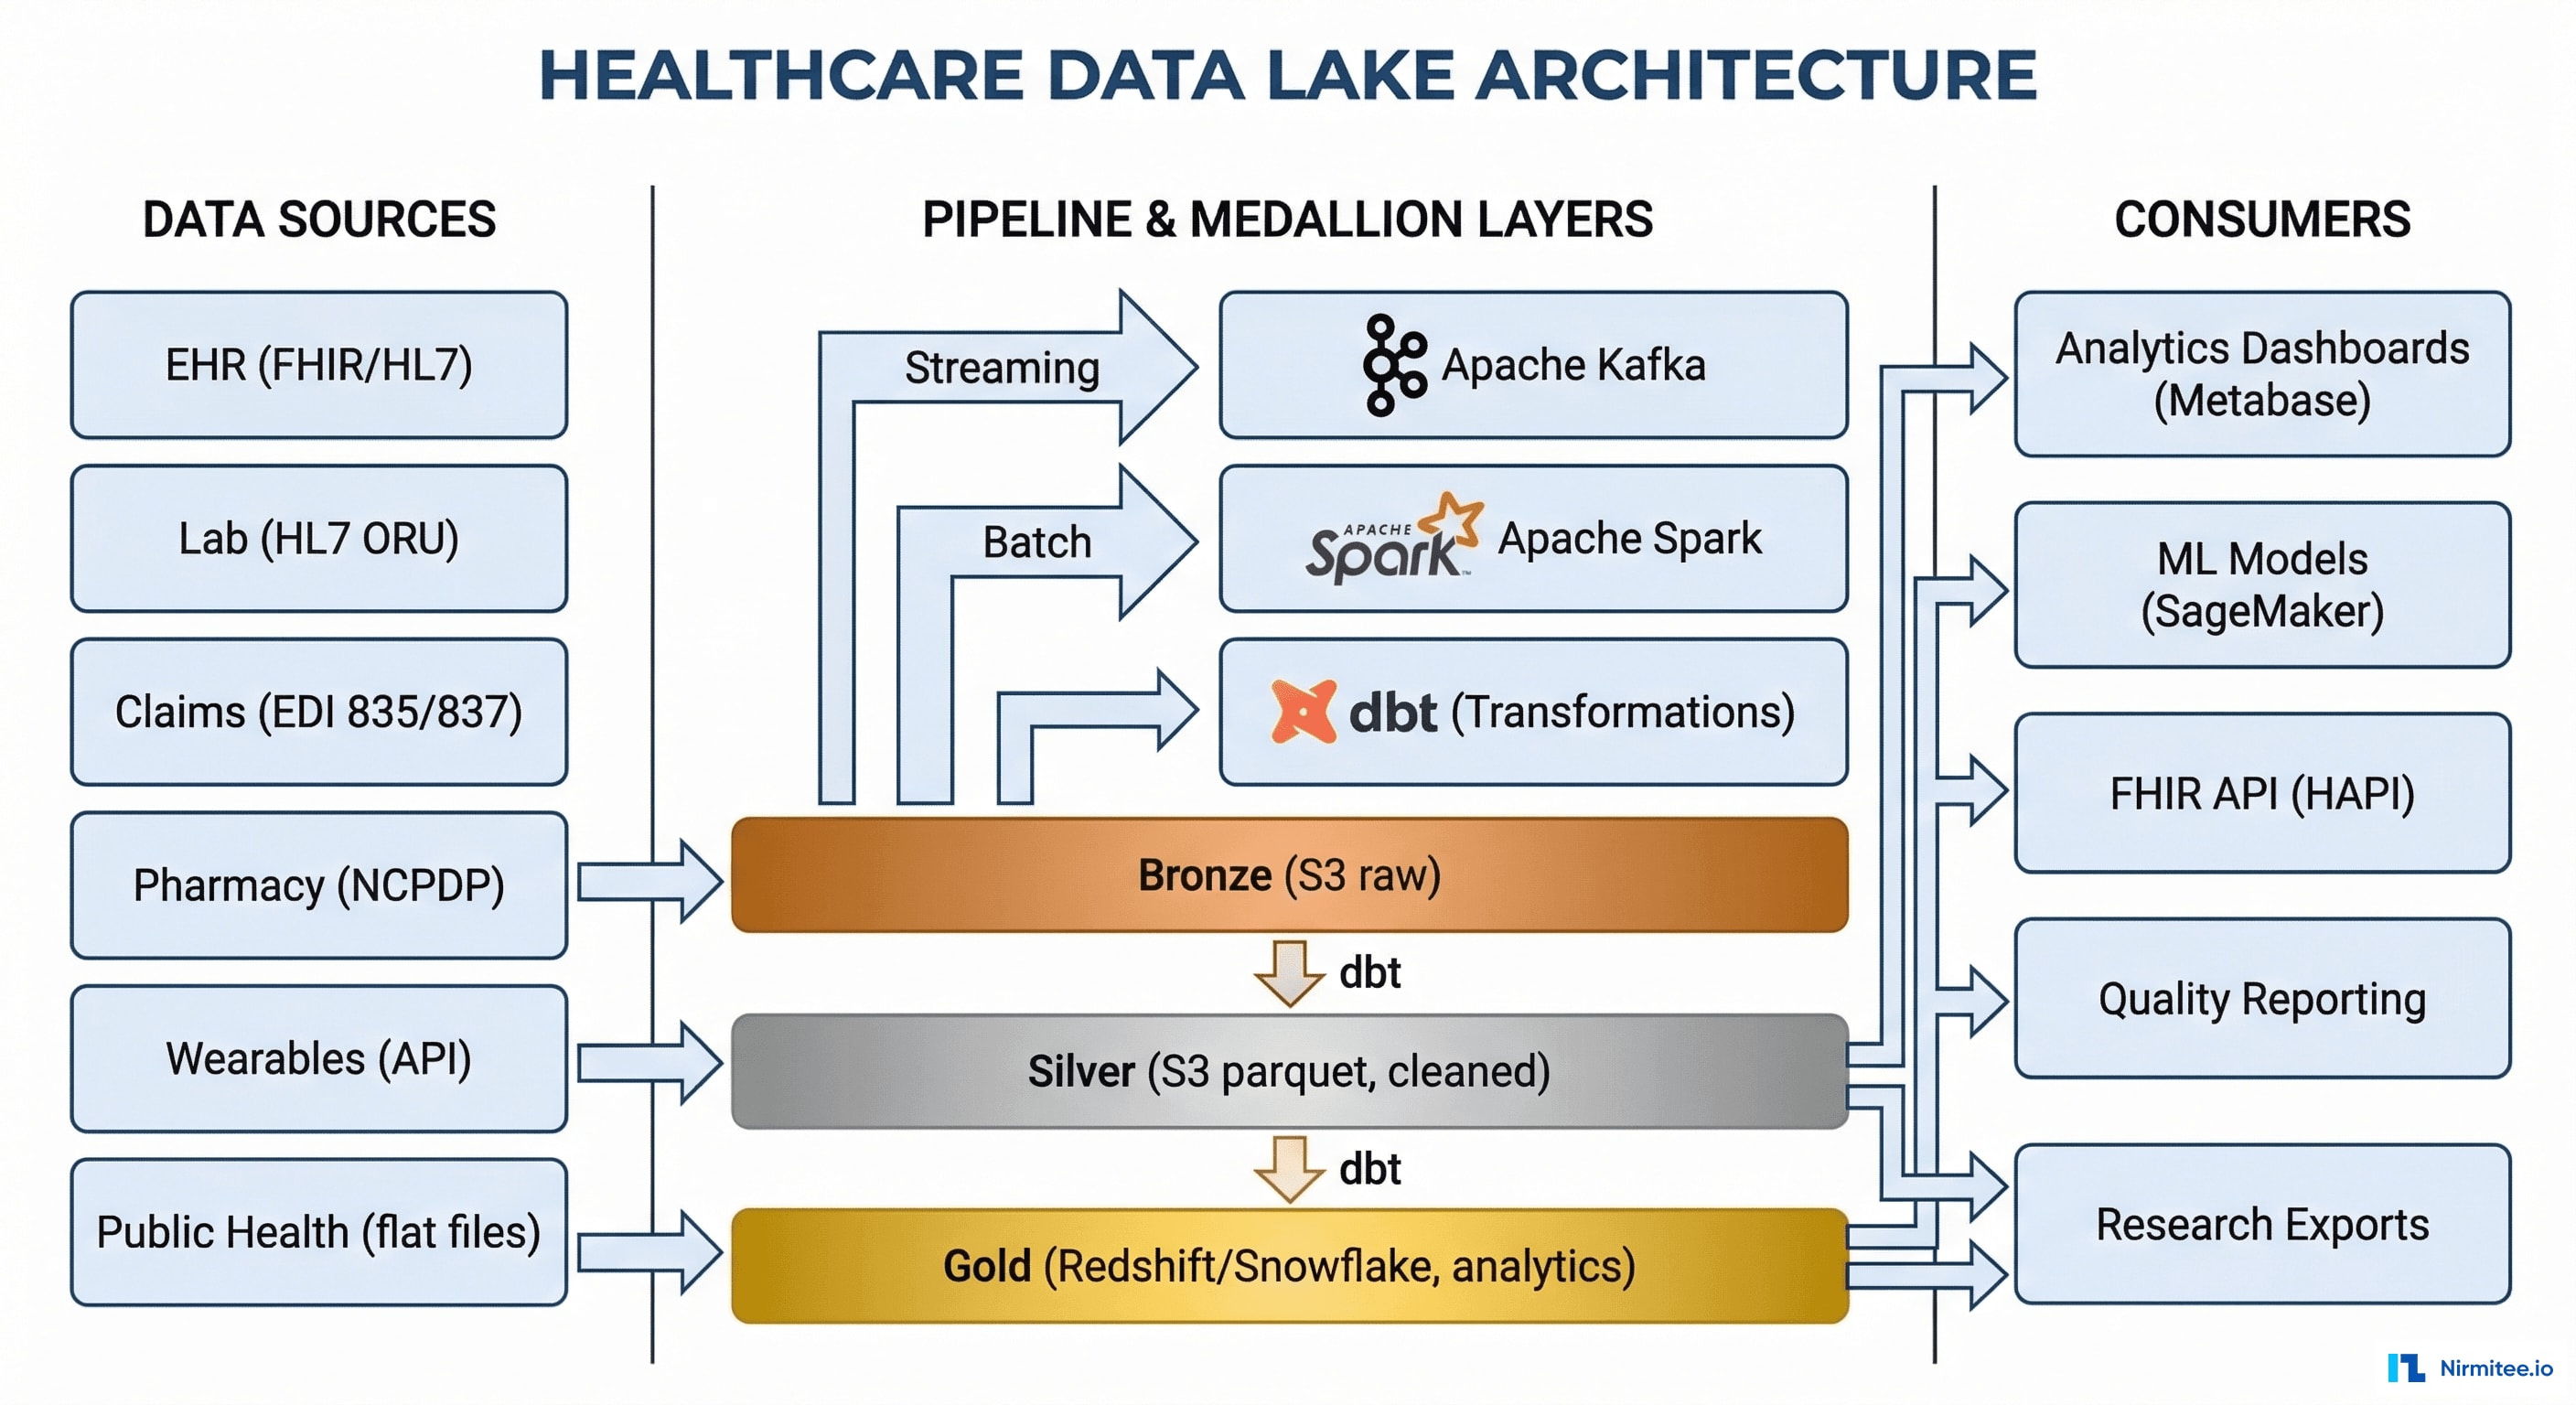
Technology Stack
| Component | Technology | Purpose |
|---|---|---|
| Streaming Ingestion | Apache Kafka | Real-time data from EHR (ADT, ORU), lab results, vitals |
| Batch Processing | Apache Spark | Daily claims files, pharmacy exports, wearable data |
| Transformation | dbt (data build tool) | Bronze→Silver→Gold transformations, testing, documentation |
| Storage (Bronze/Silver) | AWS S3 (Parquet format) | Immutable raw data + cleaned intermediate data |
| Storage (Gold) | Amazon Redshift | Analytics-ready tables, fast SQL queries |
| FHIR API | HAPI FHIR | FHIR R4 API access to Silver layer data |
| Dashboards | Metabase | Self-service analytics for clinical and operational teams |
| ML Platform | Amazon SageMaker | Model training, deployment, monitoring |
| Data Quality | Great Expectations | Automated data validation and quality monitoring |
| Orchestration | Apache Airflow | Pipeline scheduling, dependency management, alerting |
Patient 360 View
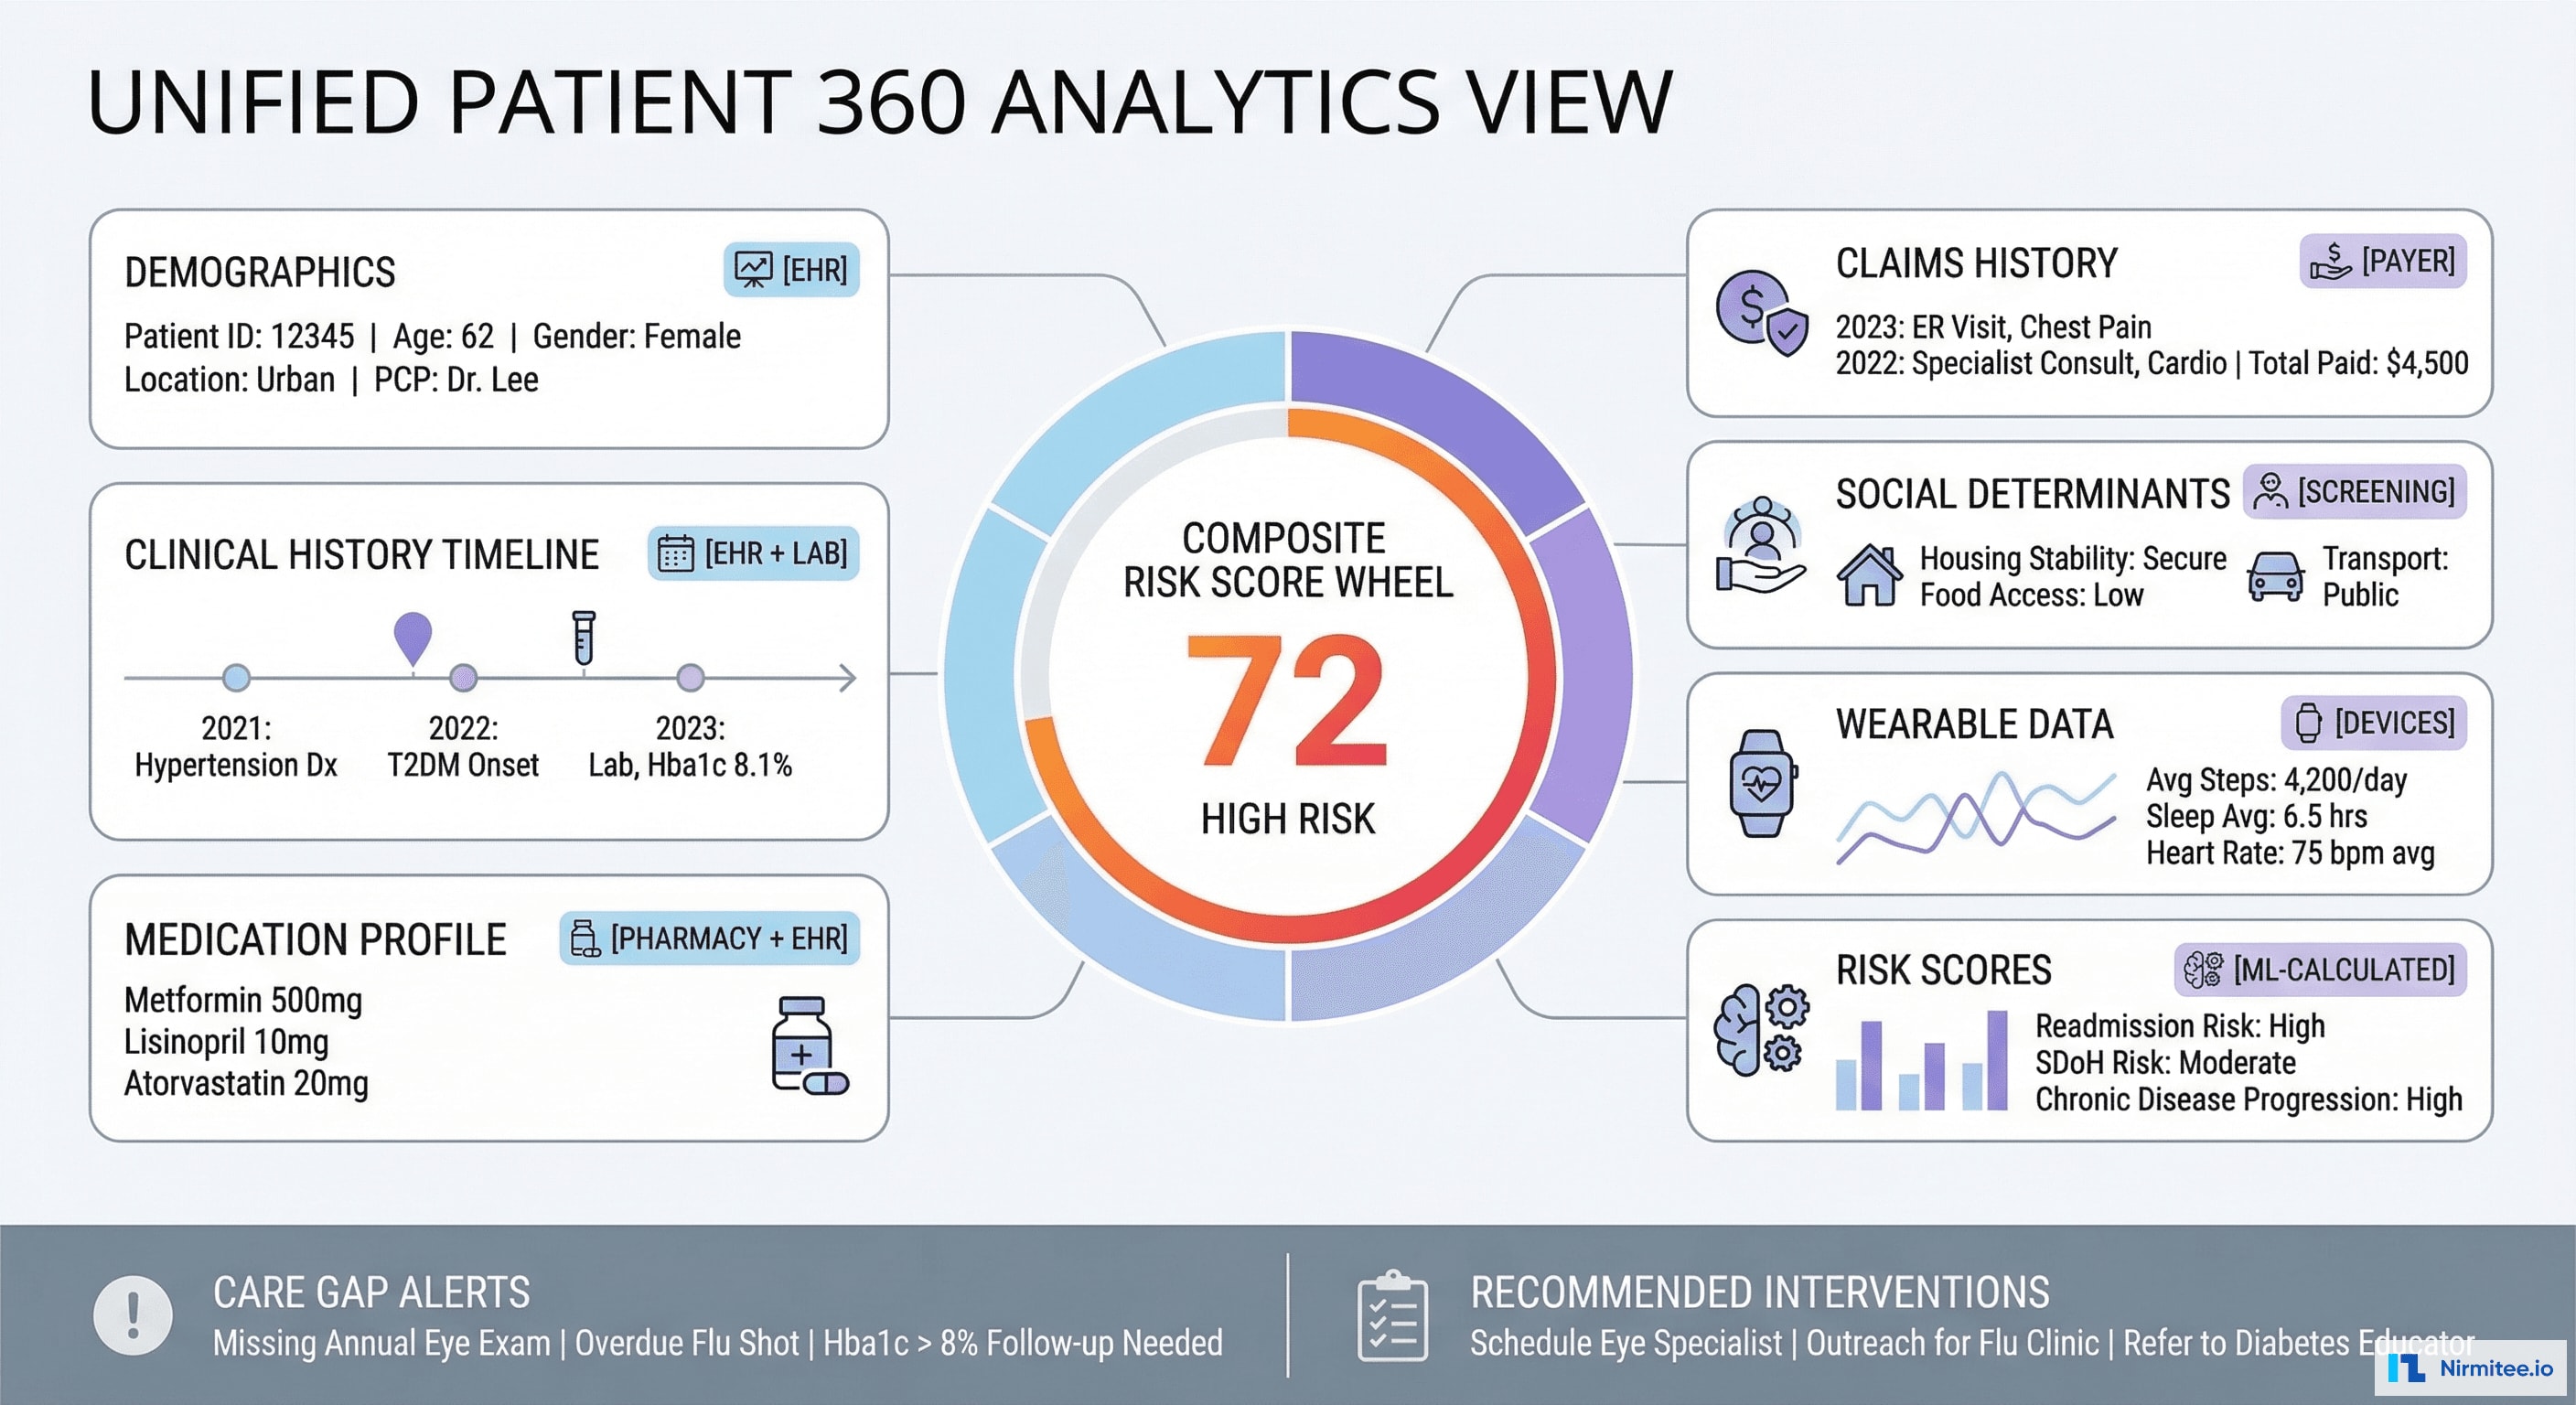
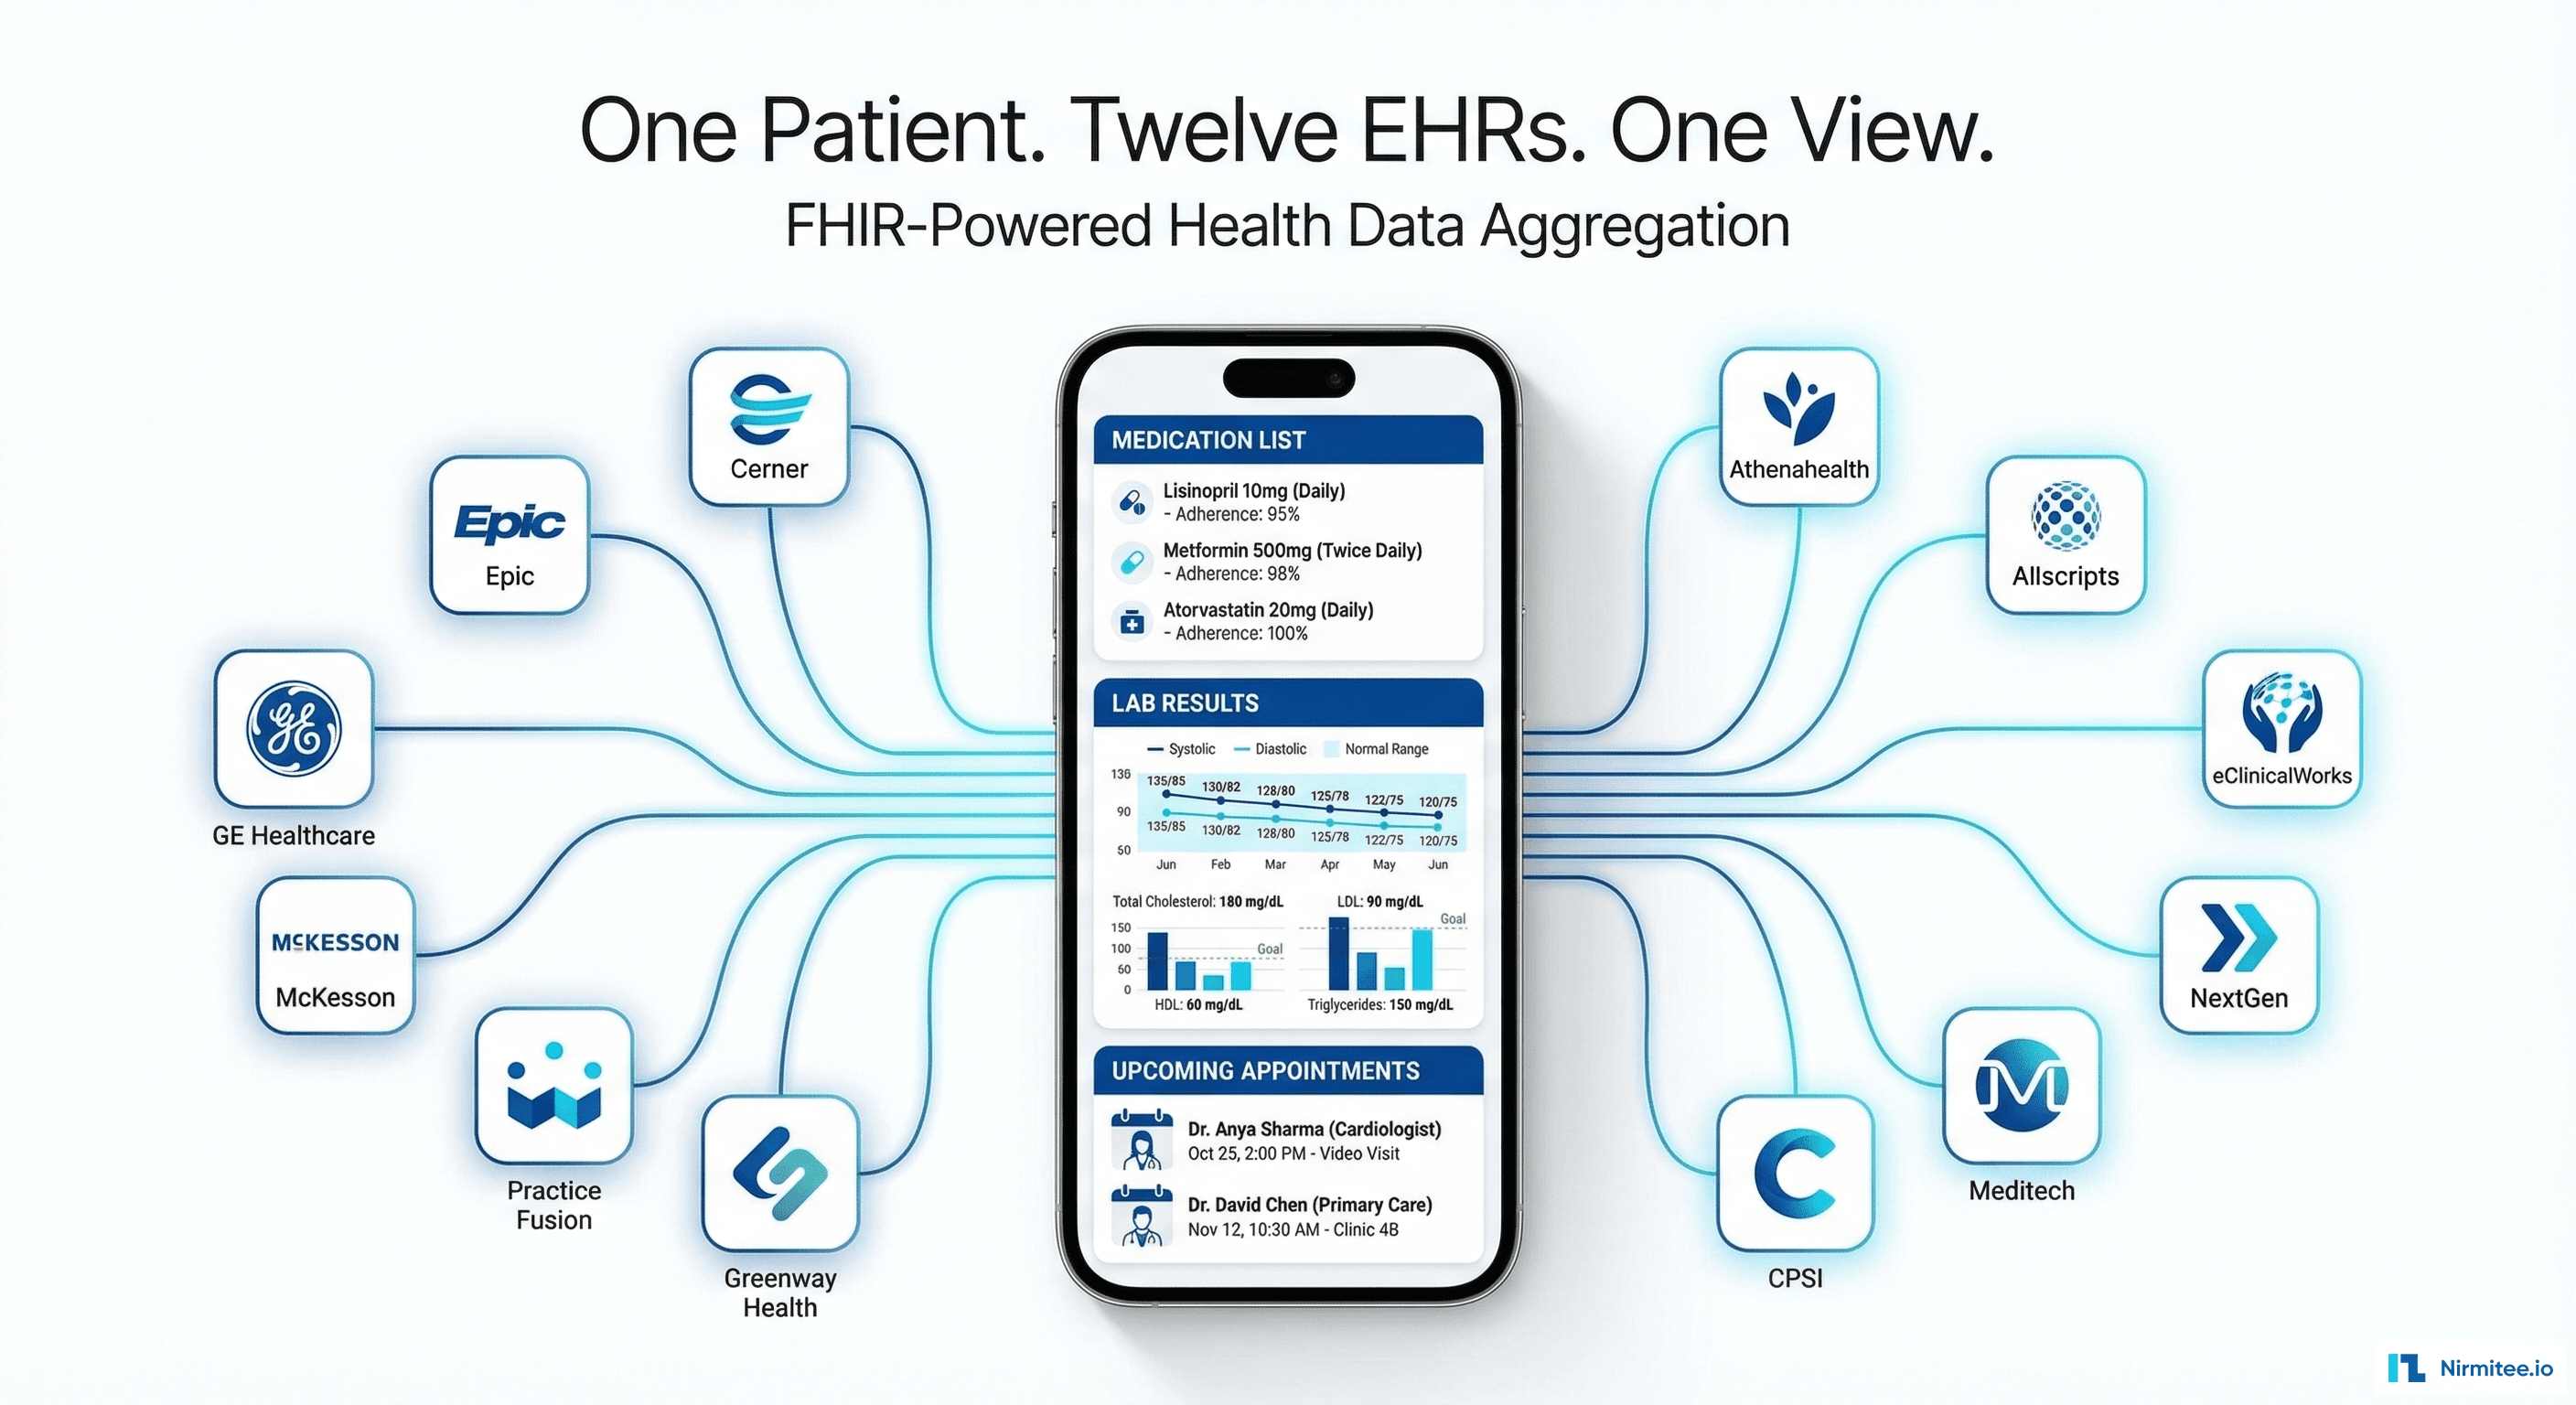
For the first time, care teams see a complete patient picture — clinical history from EHR, lab results from LIS, medications from pharmacy, claims from payer, social determinants from screening, and wearable data from devices. Each data point tagged with its source for provenance.
Population Health Analytics
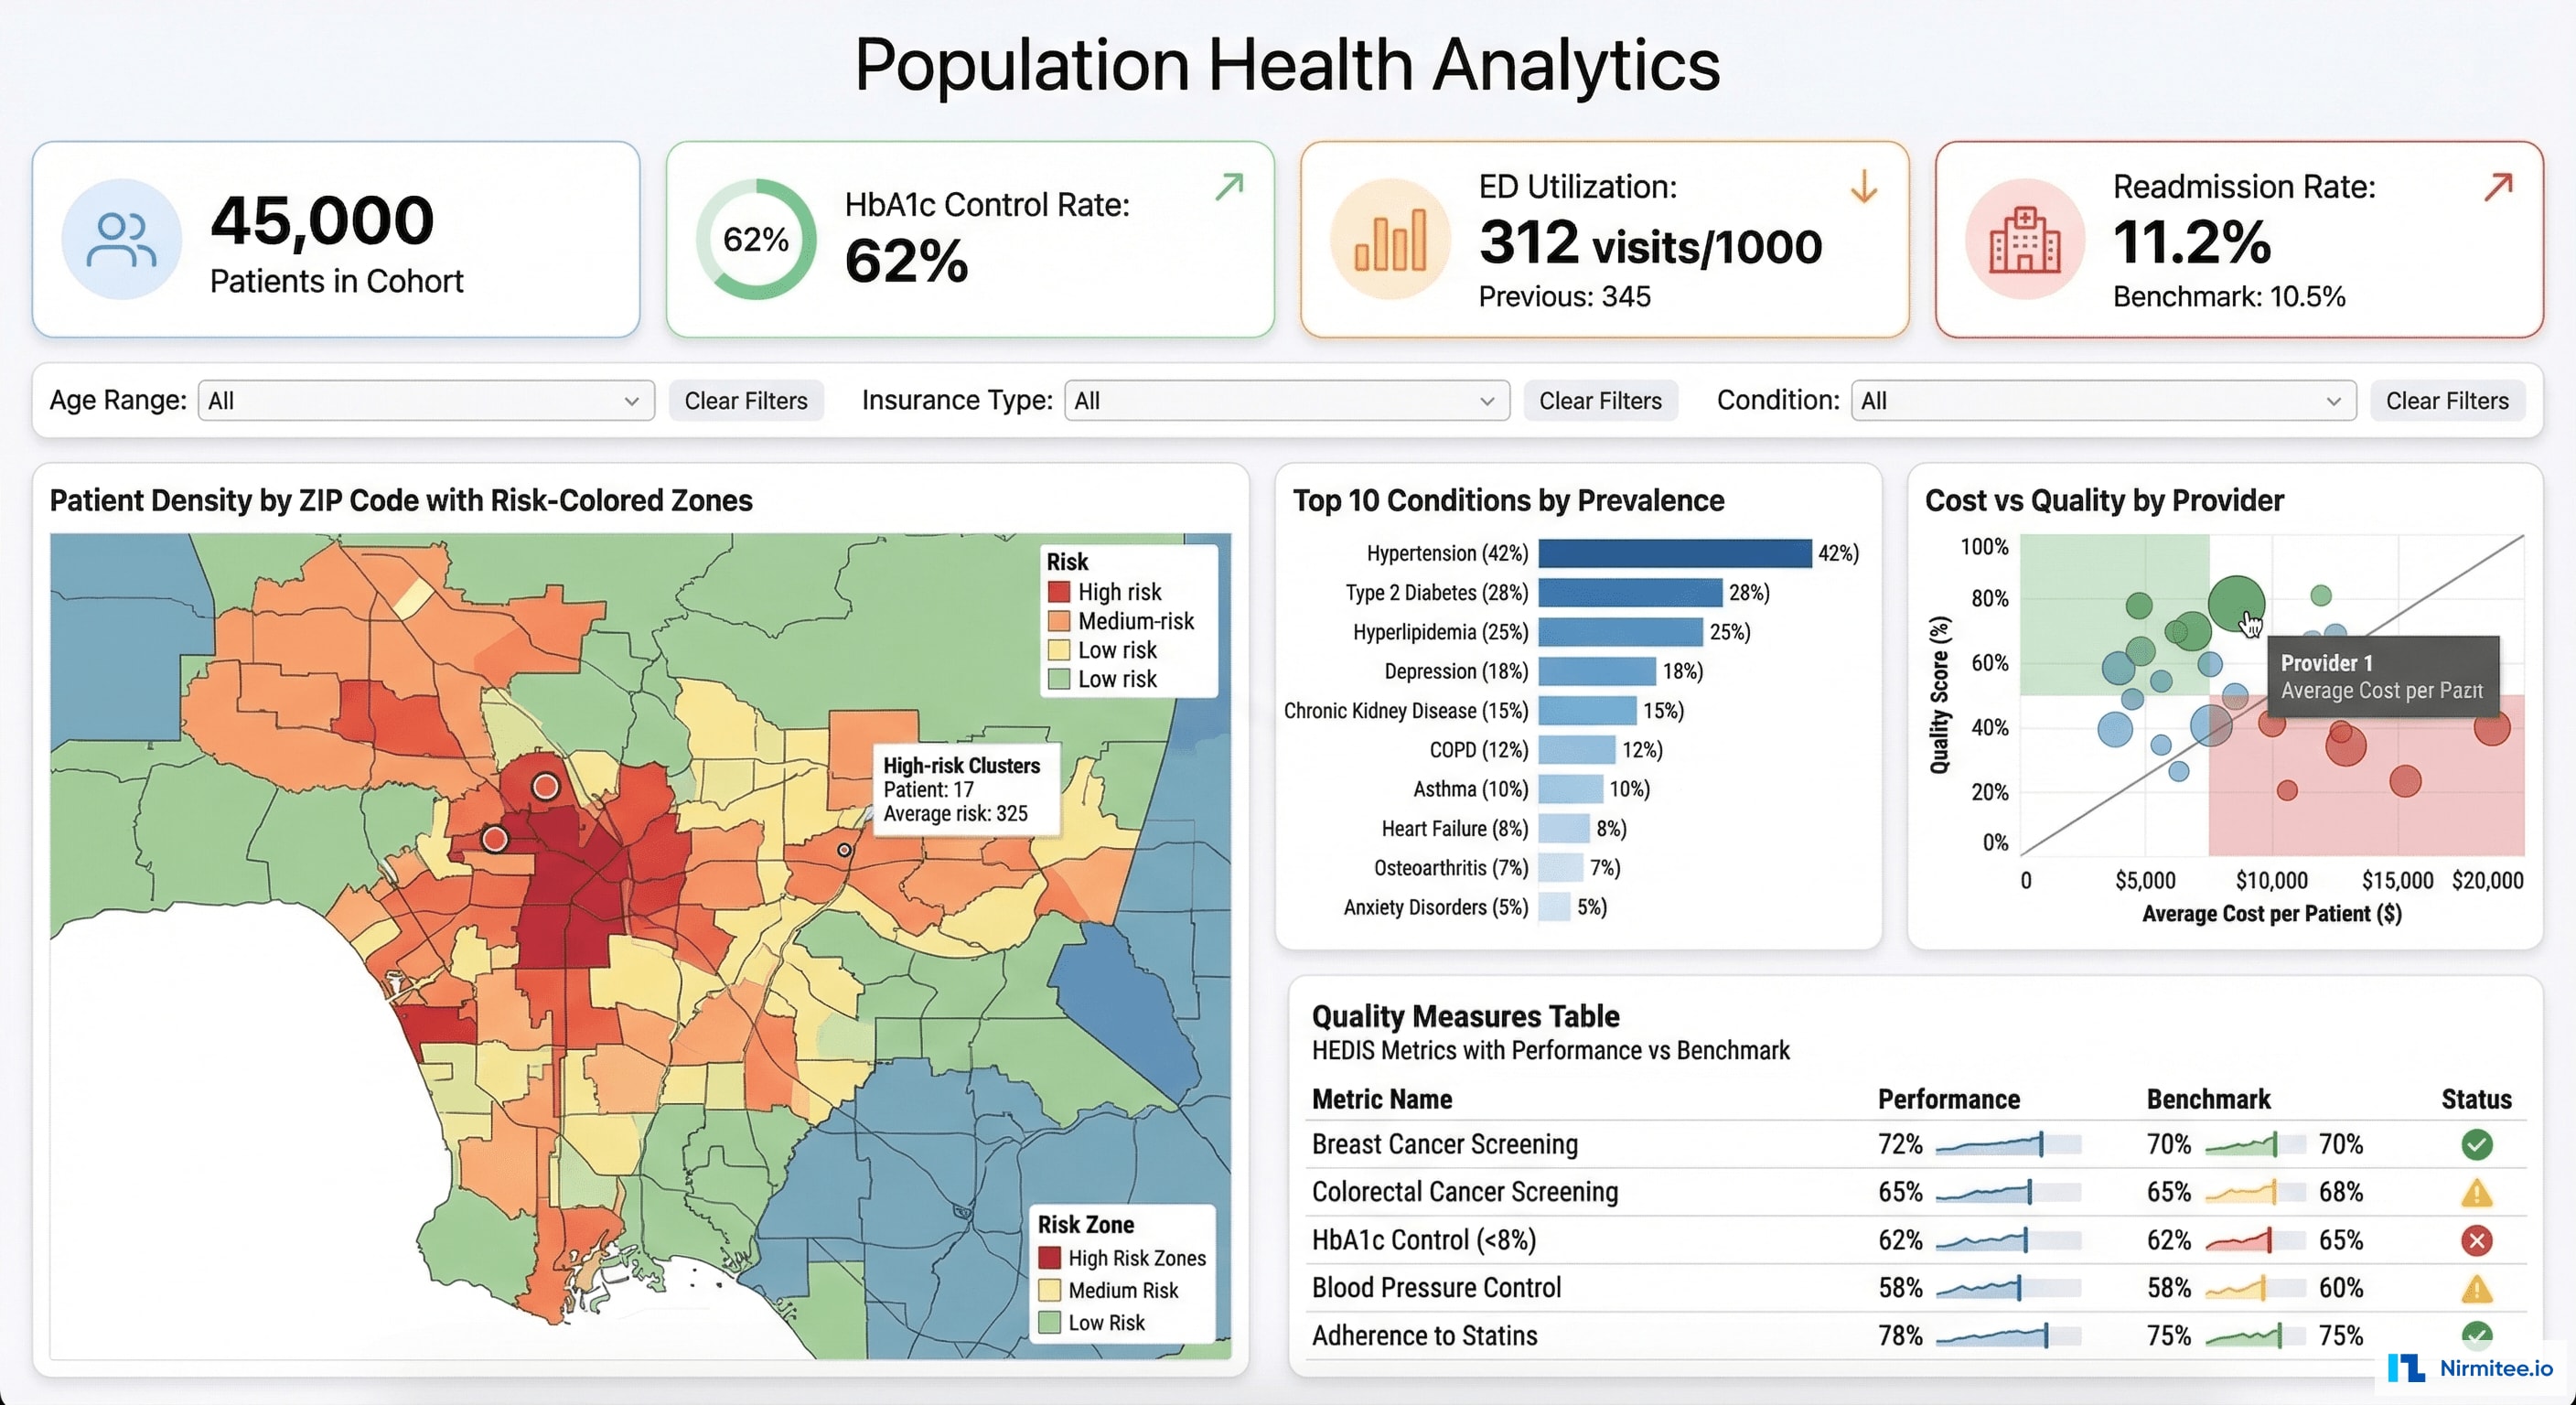
Population-level analytics that drive strategic decisions: quality measure performance, cost and utilization patterns, provider benchmarking, and geographic risk mapping.
Data Quality Governance

Automated quality monitoring ensures the data lake doesn't become a data swamp:
- Quality scores by source: EHR completeness 94%, Lab timeliness 97%, Claims accuracy 91%
- Specific issue tracking: "Missing DOB in 3.2% of lab records", "847 duplicate patient pairs detected"
- Quality trends: 6-month improvement visualization — proving that data governance investment is working
- Configurable DQ rules: custom validation rules with pass/fail monitoring per source system
ML Models in Production

Three ML models running in production, trained on the Gold layer data:
| Model | AUC | Features | Impact |
|---|---|---|---|
| 30-Day Readmission Risk | 0.84 | Prior admissions, comorbidity index, medication count, social determinants, ED visits | High-risk patients get transitional care management → 18% readmission reduction |
| Diabetes Progression | 0.79 | HbA1c trajectory, medication adherence, BMI trend, retinopathy screening, eGFR | Early intervention for deteriorating patients → slowed progression in 34% of flagged patients |
| ED Utilization Prediction | 0.82 | Prior ED visits, chronic conditions, access barriers, social factors, appointment no-shows | Proactive outreach to frequent ED users → 22% reduction in avoidable ED visits |
Results

| Metric | Before | After | Impact |
|---|---|---|---|
| Report generation time | 2 weeks (manual Excel) | Real-time dashboards | From weeks to seconds |
| Data sources unified | 0 (all siloed) | 8 systems integrated | Single source of truth |
| ML models in production | 0 | 3 (readmission, diabetes, ED) | Predictive healthcare |
| Patient 360 coverage | 0 patients | 45,000 patients | Complete patient picture |
| Data quality score | Unknown | 94% avg across sources | Measured and improving |
| Records processed daily | N/A | 847,000 | Near real-time ingestion |
| HEDIS reporting time | 6 weeks | 2 days | 95% faster |
| Readmission rate | 14.8% | 12.1% | 18% reduction (ML-driven) |
Timeline
| Phase | Duration | Deliverables |
|---|---|---|
| Phase 1 | 6 weeks | Infrastructure (Kafka, S3, Redshift), Bronze layer for EHR + Lab (2 sources), basic Metabase dashboards |
| Phase 2 | 6 weeks | Silver layer (FHIR normalization, dedup), +4 sources (claims, pharmacy, scheduling, billing), dbt models |
| Phase 3 | 6 weeks | Gold layer (Patient 360, quality measures, cohorts), +2 sources (wearables, public health), data quality monitoring |
| Phase 4 | 6 weeks | ML models (readmission, diabetes, ED), SageMaker deployment, population health dashboards, FHIR API |
Total: 6 months with 3 data engineers + 1 data scientist + 1 analytics engineer.
Lessons Learned
- Bronze layer is your insurance policy. When we discovered a bug in our Silver-layer deduplication logic in Month 4, we reprocessed 3 months of data from Bronze. Without immutable raw storage, we would have lost data integrity.
- dbt transformed our data engineering culture. Before dbt, transformations were SQL scripts in Airflow DAGs — untested, undocumented, fragile. dbt brought version control, testing, documentation, and lineage tracking. Non-negotiable for healthcare data.
- Data quality monitoring is a product, not a task. We initially treated DQ as a one-time cleanup. It's actually a continuous monitoring system — source systems change, data quality drifts, new edge cases appear. Great Expectations running on every pipeline execution caught issues before they reached dashboards.
- ML models need the Gold layer to shine. Our first readmission model trained on Silver-layer data achieved AUC 0.71. After building proper feature tables in Gold (engineered features, time-windowed aggregations, cross-source joins), the same model reached 0.84. The Gold layer is where data becomes intelligence.
Was this case study helpful?