Healthcare Fraud Detection in Hospital Billing: ML & Graph Analysis That Recovered $1.2M
Executive Summary
A multi-hospital health system processing $380M in annual claims discovered that traditional rule-based auditing was catching less than 15% of billing fraud. Manual auditors reviewed claims reactively, months after submission, and lacked the tools to identify sophisticated schemes like provider network collusion, systematic upcoding, and coordinated unbundling patterns that spanned thousands of claims across multiple facilities.
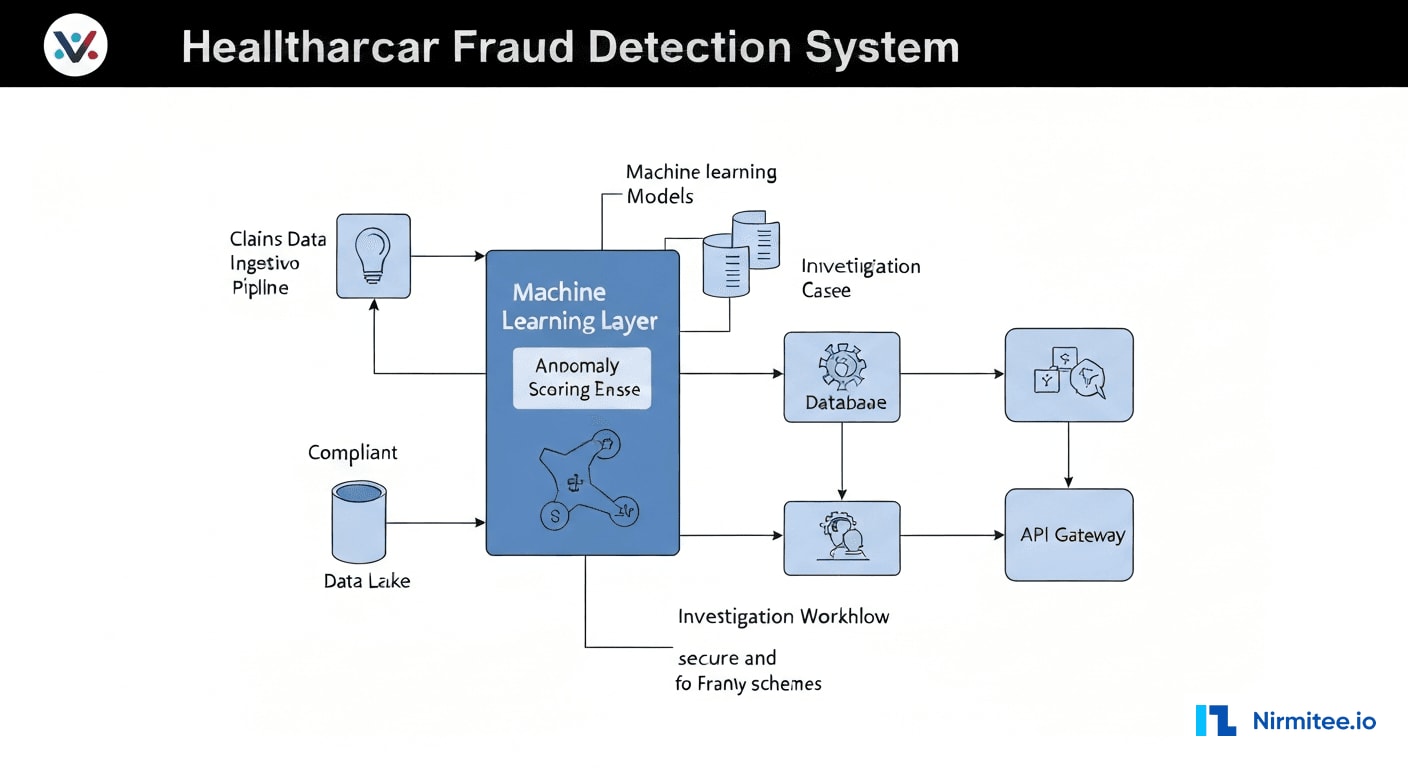
Nirmitee built an ML-powered fraud detection platform that analyzes 50+ billing patterns in real time, uses graph database technology to map suspicious provider-patient-facility relationships, and delivers actionable investigation workflows to the compliance team. The system processes every claim before submission, scoring fraud probability and routing high-risk claims for human review.
Results in the first year: $1.2M in fraudulent charges recovered, a 3.2% fraud rate identified across the system (previously estimated at 0.8%), and 87% precision in fraud detection — meaning 87 out of every 100 flagged claims were confirmed fraudulent upon investigation.

The Problem: Invisible Fraud Bleeding Revenue
Healthcare fraud costs the US healthcare system an estimated $68 billion annually according to the National Health Care Anti-Fraud Association. But the challenge is not just the scale — it is the sophistication. Modern billing fraud has evolved far beyond simple duplicate claims into coordinated schemes that are invisible to rule-based detection systems.
The Health System's Fraud Detection Gap
| Metric | Before Implementation | Industry Average |
|---|---|---|
| Estimated fraud rate | 0.8% (detected) | 3-10% (actual) |
| Claims audited manually | 2.1% of total | 5-8% |
| Time from fraud to detection | 6-18 months | 3-6 months |
| Recovery rate on detected fraud | 23% | 40-60% |
| False positive rate (manual audit) | 62% | 40-50% |
| Annual fraud losses (estimated) | $3.8M | Varies |
Types of Fraud Going Undetected
Our pre-implementation audit, conducted over 60 days using retrospective analysis of 18 months of claims data, identified five primary fraud vectors that the existing system completely missed:
- Systematic Upcoding: Providers consistently billing higher-level E/M codes than documentation supported. The pattern was subtle — not every claim was upcoded, but the distribution was statistically impossible given the patient population. One provider billed 99214 (moderate complexity) for 78% of visits compared to the specialty benchmark of 45%.
- Phantom Charges: Services billed but never rendered. These were not obvious duplicates but rather ancillary services (lab tests, imaging) added to legitimate visit claims. Without cross-referencing scheduling systems, lab systems, and billing systems simultaneously, they appeared valid.
- Unbundling: Procedures that should be billed as a single bundled code were being split into component codes to increase reimbursement. A panel of lab tests billed individually generated 40-60% more revenue than the bundled code.
- Provider Network Collusion: A ring of 6 providers across 3 facilities who referred patients to each other for medically unnecessary services. Each provider's individual billing appeared normal, but the referral patterns and service volumes were anomalous when viewed as a network.
- Duplicate Claims Across Facilities: The same service billed by both the facility and the provider, or billed at two facilities for a patient who could not have been at both locations on the same day.
The Solution: Multi-Layer Fraud Detection Platform
We designed a three-engine detection architecture that combines statistical anomaly detection, supervised ML classification, and graph-based network analysis. Each engine identifies different fraud patterns, and their combined output produces a composite fraud risk score for every claim.
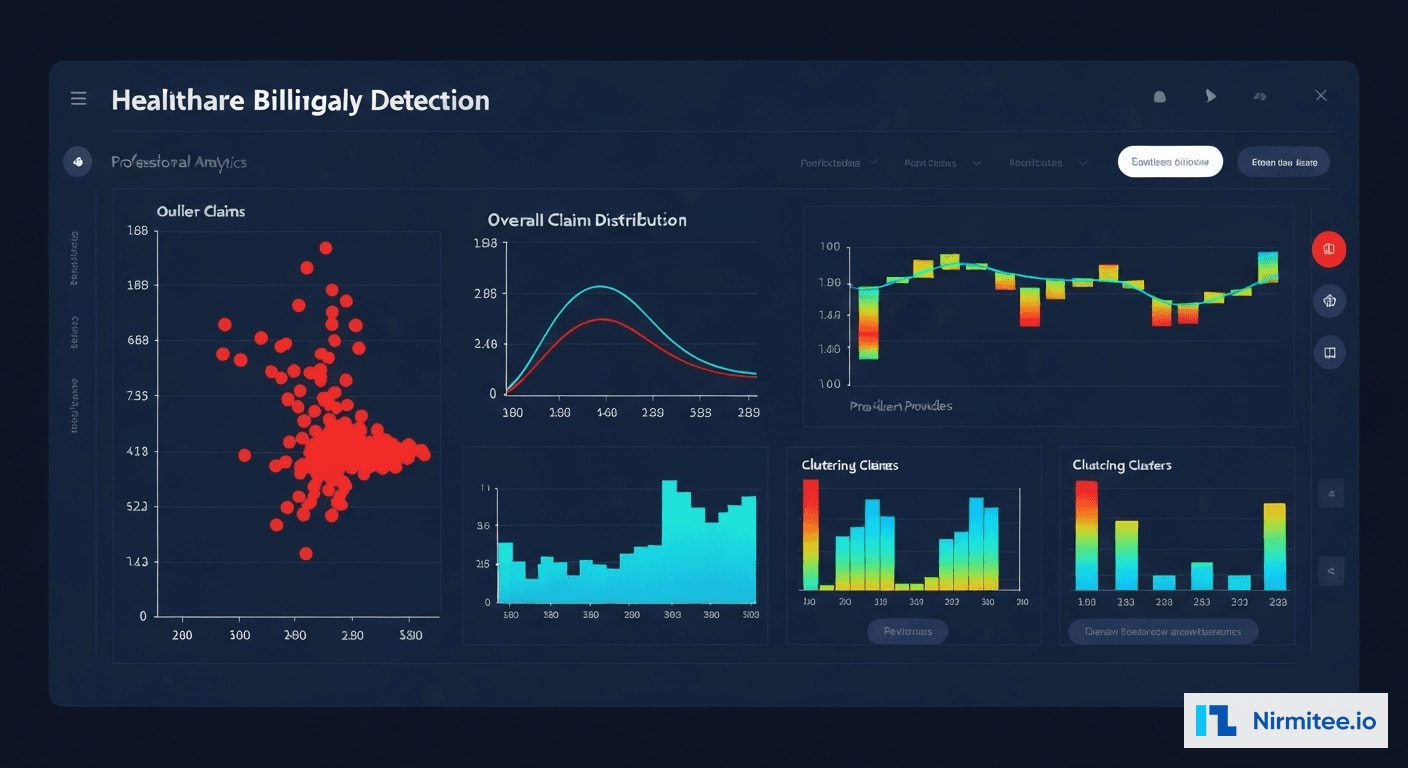
Engine 1: Statistical Anomaly Detection
The anomaly detection engine establishes statistical baselines for 50+ billing metrics per provider, per specialty, per facility, and per payer. It continuously monitors for deviations that exceed configurable thresholds, adjusted for seasonal variation, patient mix changes, and coding guideline updates.
Key anomaly detection patterns include:
- E/M Code Distribution Analysis: Compares each provider's Evaluation and Management code distribution against specialty-specific benchmarks. Providers with distributions that are statistically impossible (p < 0.001 on chi-squared test) are flagged for upcoding review.
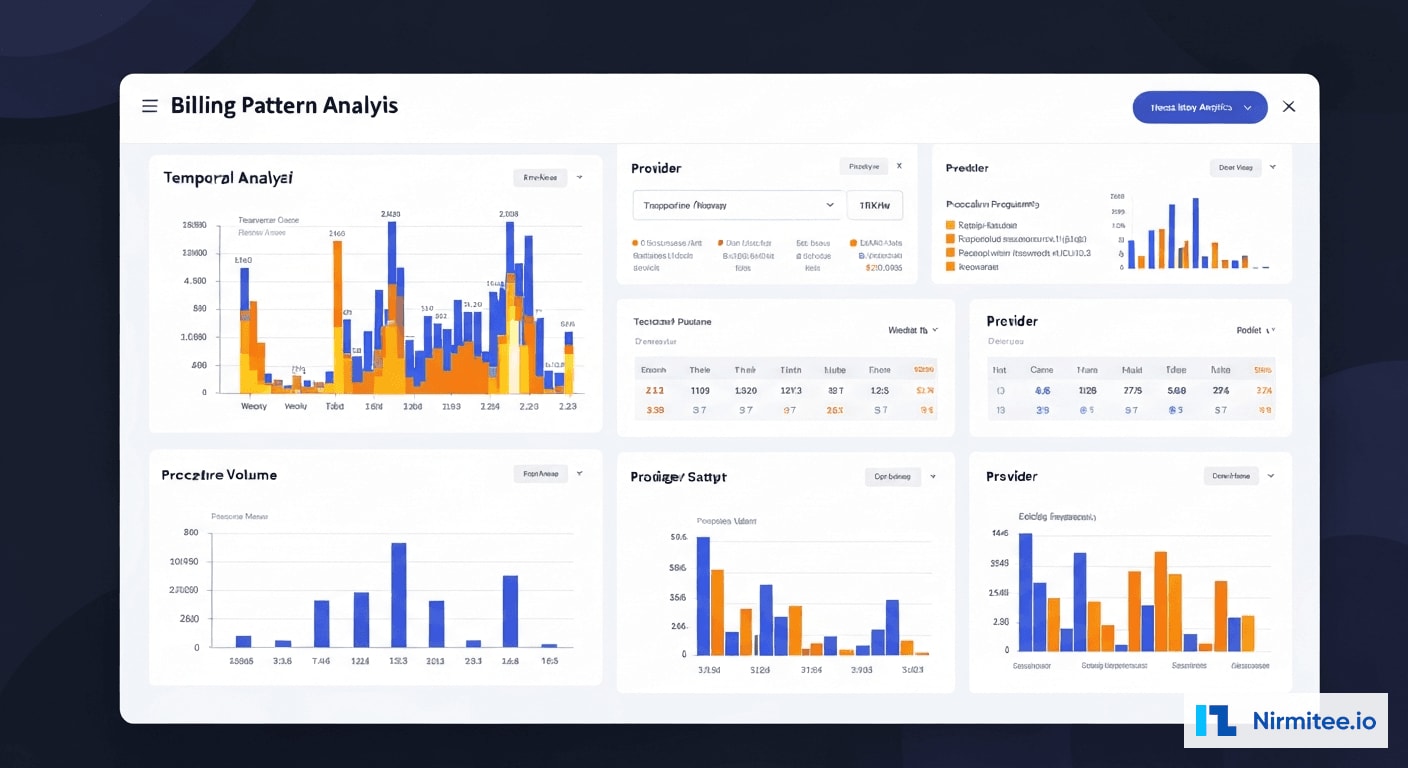
- Temporal Billing Patterns: Identifies claims submitted at unusual times, burst patterns (high volume submitted in short windows), and claims for services on days the provider or facility was closed.
- Procedure-Diagnosis Mismatch: Cross-references CPT codes against ICD-10 diagnoses using CMS medical necessity matrices. Flags procedures that lack clinical justification based on the documented diagnosis.
- Volume Outliers: Providers billing significantly more procedures per patient or per day than peer benchmarks. A dermatologist performing 15 biopsies per day when the specialty median is 4 triggers investigation.
Engine 2: Supervised ML Classification
The ML classification model was trained on 2.1 million historical claims labeled by the compliance team over 3 years. The training dataset included 34,000 confirmed fraudulent claims across all fraud categories, providing the model with rich examples of each fraud vector.
The model architecture uses a gradient-boosted ensemble (XGBoost) with 127 input features organized into five categories:
| Feature Category | Count | Examples |
|---|---|---|
| Claim-Level Features | 32 | Billed amount, code complexity, modifier usage, place of service |
| Provider Behavior | 28 | Billing velocity, code distribution, referral patterns, override frequency |
| Patient Context | 24 | Age, diagnosis history, visit frequency, multi-provider utilization |
| Temporal Patterns | 19 | Day of week, submission timing, claim-to-service gap, seasonal variance |
| Network Features | 24 | Referral centrality, shared patient count, facility hop patterns |
The model outputs a fraud probability score from 0.0 to 1.0 for each claim, along with feature importance explanations that tell investigators which specific factors contributed to the score. This explainability is critical — investigators need to understand why a claim was flagged, not just that it was.
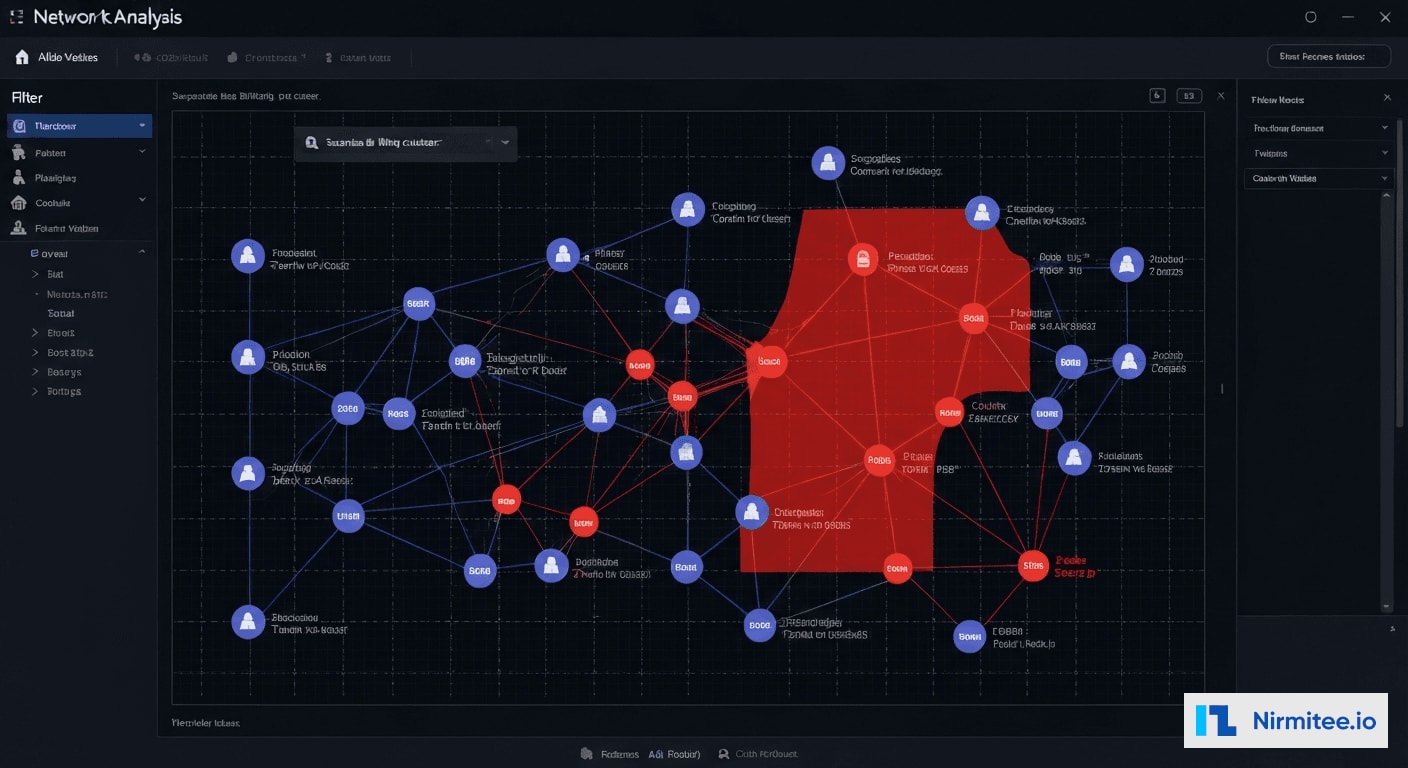
Engine 3: Graph-Based Network Analysis
This is the most powerful innovation in the platform. Traditional fraud detection examines claims in isolation. Graph analysis examines relationships — and fraud is fundamentally a network phenomenon.
We built a knowledge graph in Neo4j connecting every entity in the billing ecosystem:
- Nodes: Providers (3,200+), Patients (180,000+), Facilities (50+), Payers (12), Procedures (8,000+ CPT codes), Diagnoses (70,000+ ICD-10 codes)
- Edges: Billed-for, Referred-to, Treated-at, Diagnosed-with, Employed-by, Located-at — each edge weighted by frequency and recency
- Community Detection: Louvain algorithm identifies clusters of entities with unusually dense inter-connections. The provider collusion ring was identified because 6 providers shared 340 patients with circular referral patterns — a pattern invisible in tabular data but immediately obvious in graph visualization.
- Centrality Analysis: Providers with abnormally high betweenness centrality (connecting otherwise disconnected patient populations) are flagged for investigation. This identified a billing coordinator who was the nexus of fraudulent claims across three departments.
System Architecture
Technology Stack
| Component | Technology | Purpose |
|---|---|---|
| Claims Ingestion | Apache Kafka + Debezium CDC | Real-time claims streaming from billing systems |
| Data Lake | AWS S3 + Apache Iceberg | Historical claims storage for model training |
| Feature Store | Feast + Redis | Real-time and batch feature serving |
| ML Pipeline | XGBoost + MLflow + SageMaker | Model training, versioning, and deployment |
| Anomaly Detection | Python (scipy, statsmodels) | Statistical baseline monitoring and outlier detection |
| Graph Database | Neo4j Enterprise | Entity relationship mapping and community detection |
| Investigation Workflow | React + Node.js | Case management, evidence collection, audit trail |
| Reporting | Apache Superset + Custom Dashboards | Executive reporting, trend analysis, compliance metrics |
| API Layer | FastAPI (Python) + OAuth 2.0 | Secure API for fraud scoring and investigation access |
| Infrastructure | AWS (EKS, RDS, ElastiCache) | HIPAA-compliant cloud deployment |
Real-Time Scoring Pipeline
Every claim flows through a three-stage scoring pipeline:
- Pre-processing: Claims are normalized, enriched with provider and patient context from the feature store, and validated against CMS coding rules. Average processing time: 12ms.
- Multi-engine scoring: The claim is simultaneously scored by all three engines — anomaly detection (statistical), ML classification (XGBoost), and graph analysis (Neo4j Cypher queries). Average total scoring time: 85ms.
- Composite risk scoring: Individual engine scores are combined using a weighted ensemble (ML: 0.45, Anomaly: 0.30, Graph: 0.25) to produce a final fraud risk score. Claims scoring above 0.7 are routed to the investigation queue. Claims between 0.4-0.7 are flagged for periodic review. Claims below 0.4 pass through.
Investigation Workflow

The investigation module transforms raw fraud alerts into structured cases with evidence packages, investigation timelines, and resolution workflows. Key features include:
- Automated Evidence Assembly: When a case is opened, the system automatically compiles the relevant claims, provider billing history, peer comparisons, graph visualizations, and ML feature explanations into an investigation package.
- Investigation Timeline: Every action taken on a case is logged with timestamps, user attribution, and outcome documentation — creating a complete audit trail for regulatory compliance.
- Escalation Pathways: Cases can be escalated from internal review to legal, to external reporting (OIG, state Medicaid fraud units), with appropriate documentation at each stage.
- Resolution Tracking: Outcomes are tracked — confirmed fraud, false positive, coding error, documentation deficiency — and fed back into the ML model as training labels for continuous improvement.
Results: First-Year Impact
Key Performance Metrics
| Metric | Before | After | Impact |
|---|---|---|---|
| Fraud detected (annual) | $310K | $1.2M | 287% increase |
| Fraud rate identified | 0.8% | 3.2% | 4x detection rate |
| Detection precision | 38% | 87% | 129% improvement |
| Time from fraud to detection | 6-18 months | Real-time to 48 hours | 99%+ faster |
| Claims audited (automated) | 2.1% | 100% | Every claim scored |
| False positive rate | 62% | 13% | 79% reduction |
| Investigation cycle time | 45 days average | 12 days average | 73% faster |
| Recovery rate on detected fraud | 23% | 68% | 196% improvement |
| Provider network fraud rings identified | 0 | 3 | New capability |
Fraud Categories Detected
| Fraud Type | Claims Flagged | Confirmed Fraudulent | Amount Recovered |
|---|---|---|---|
| Upcoding (E/M codes) | 1,847 | 1,423 | $412,000 |
| Phantom Charges | 623 | 498 | $287,000 |
| Unbundling | 412 | 371 | $198,000 |
| Provider Network Collusion | 890 | 756 | $203,000 |
| Duplicate Claims | 234 | 201 | $100,000 |
| Total | 4,006 | 3,249 | $1,200,000 |
Financial Impact
| Category | Annual Value |
|---|---|
| Fraud recovered (Year 1) | $1,200,000 |
| Projected ongoing annual recovery | $1,800,000+ |
| Avoided regulatory penalties | $350,000 (estimated) |
| Reduced audit costs (automated vs. manual) | $180,000 |
| Platform implementation cost | ($890,000) |
| Annual operating cost | ($220,000) |
| Net Year 1 ROI | $620,000 (70% ROI) |
Implementation Timeline
| Phase | Duration | Key Deliverables |
|---|---|---|
| Discovery & Data Audit | Weeks 1-4 | Claims data analysis, fraud pattern catalog, baseline metrics, compliance requirements |
| Data Pipeline & Feature Engineering | Weeks 5-10 | Kafka ingestion, feature store, historical data migration, CDC setup |
| ML Model Development | Weeks 8-16 | Training data labeling, XGBoost model, validation with compliance team |
| Anomaly Detection Engine | Weeks 10-14 | Statistical baselines, outlier detection rules, specialty benchmarks |
| Graph Database & Network Analysis | Weeks 12-18 | Neo4j schema, entity resolution, community detection, centrality analysis |
| Investigation Workflow | Weeks 16-22 | Case management UI, evidence assembly, escalation pathways, audit trail |
| Integration & Testing | Weeks 20-26 | Composite scoring, billing system integration, parallel run validation |
| Go-Live & Tuning | Weeks 27-32 | Production deployment, threshold tuning, compliance team training, support |
Lessons Learned
1. Labeled Data Is the Bottleneck, Not Algorithms
The ML model's performance was directly proportional to the quality of labeled training data. We spent 8 weeks working with the compliance team to label 34,000 historical claims as fraudulent, suspicious, or clean. This investment in data quality yielded more accuracy improvement than any algorithm tuning. Organizations starting fraud detection programs should prioritize building a labeled dataset before selecting technology.
2. Graph Analysis Finds What Statistics Cannot
The provider collusion ring was invisible to statistical analysis because each individual provider's billing patterns fell within normal ranges. Only by mapping the network of referrals, shared patients, and coordinated billing patterns did the collusion become apparent. Graph databases are not optional for healthcare fraud detection — they are essential for detecting the most costly fraud schemes.
3. False Positives Erode Trust Faster Than Missed Fraud
When the system launched with a lower precision threshold (72% precision), investigators quickly became frustrated by the volume of false positives and began ignoring alerts — ironically recreating the alert fatigue problem. We raised the threshold to target 87% precision, accepting that some fraud would go undetected in exchange for maintaining investigator trust and engagement. A system that investigators trust catches more fraud than a sensitive system they ignore.
4. Explainability Is a Compliance Requirement
Regulatory bodies (OIG, state fraud units) require evidence chains that explain why a claim was flagged. Black-box ML scores are not admissible in fraud proceedings. We built SHAP-based feature attribution into every fraud score, generating human-readable explanations like: "This claim scored 0.89 fraud risk primarily due to: E/M code 99215 used 3.4x more frequently than specialty benchmark (contribution: 0.31), patient seen at 3 facilities in 7 days (contribution: 0.22), provider in flagged referral network (contribution: 0.18)."
5. Fraud Adapts — Models Must Too
Within 3 months of deployment, upcoding patterns shifted. Providers who were flagged for 99215 overuse switched to modifier abuse (appending modifier -25 to inflate reimbursement on the same base code). The model caught this because we designed it for monthly retraining with new labeled data from resolved investigations. Static fraud detection models have a shelf life of 60-90 days before sophisticated fraudsters adapt.
Frequently Asked Questions
How does the system handle false positives without disrupting legitimate billing?
The system operates in a tiered response model. Claims scoring above 0.7 are held for investigation but not rejected — they are flagged for compliance review within 48 hours. Claims between 0.4-0.7 are submitted normally but tracked for periodic batch review. Legitimate billing is never delayed or rejected by the system. The 87% precision rate means that when a claim is held for investigation, there is a high probability it merits review, minimizing disruption to legitimate billing workflows.
Can this system detect fraud across multiple payer contracts simultaneously?
Yes. The platform ingests claims across all payer contracts (Medicare, Medicaid, commercial, self-pay) and performs cross-payer analysis. Some fraud schemes specifically exploit the lack of cross-payer visibility — billing the same service to multiple payers, or shifting fraudulent patterns to whichever payer has weaker detection. Our cross-payer view identified $87,000 in dual-billing fraud in the first year that no single payer would have detected independently.
What compliance standards does the fraud detection platform meet?
The platform is HIPAA-compliant with full encryption at rest and in transit, role-based access control, and complete audit logging. It meets OIG compliance program guidance requirements for healthcare organizations, including the seven elements of an effective compliance program. All investigation records are maintained per federal and state record retention requirements (typically 6-10 years). The platform generates compliance reports formatted for OIG self-disclosure submissions when required.
How long before the system reaches peak detection accuracy?
The ML model reached 82% precision within the first month using historical training data. By month 3, with feedback from 200+ resolved investigations feeding back as new training labels, precision improved to 87%. We expect precision to plateau around 90-92% by month 12 as the model accumulates more edge-case examples. The graph analysis component improves continuously as more relationship data is added — each resolved case enriches the knowledge graph, making future network fraud patterns easier to detect.
Was this case study helpful?