Executive Summary
A 500-bed tertiary care hospital in India had no visibility into its medical equipment portfolio worth over ₹50 Crore. Equipment was tracked on paper registers and Excel spreadsheets. Departments ordered new devices without knowing what they already had. Maintenance was reactive — devices failed before anyone scheduled servicing. And when a stock audit finally happened, the results were alarming.
We built a comprehensive hospital asset management platform — RFID/barcode tagging for every device, real-time location tracking, a CFO financial dashboard linking assets to depreciation and ROI, predictive maintenance scheduling, and automated stock audit workflows.
The first stock audit after deployment told the story: the hospital had ordered 8 nebulizers at ₹3 lakh each (₹24 lakh total). Only 3 were found on the floor. 5 were missing — ₹15 lakh in equipment, vanished. This single discovery paid for the entire platform implementation.
The Problem: ₹50 Crore in Equipment, Zero Visibility
Large hospitals are equipment-intensive operations. A 500-bed facility has thousands of medical devices — ventilators, patient monitors, infusion pumps, wheelchairs, defibrillators, surgical instruments, imaging equipment, and hundreds more. Each device has a lifecycle: procurement, deployment, maintenance, depreciation, and eventual retirement.
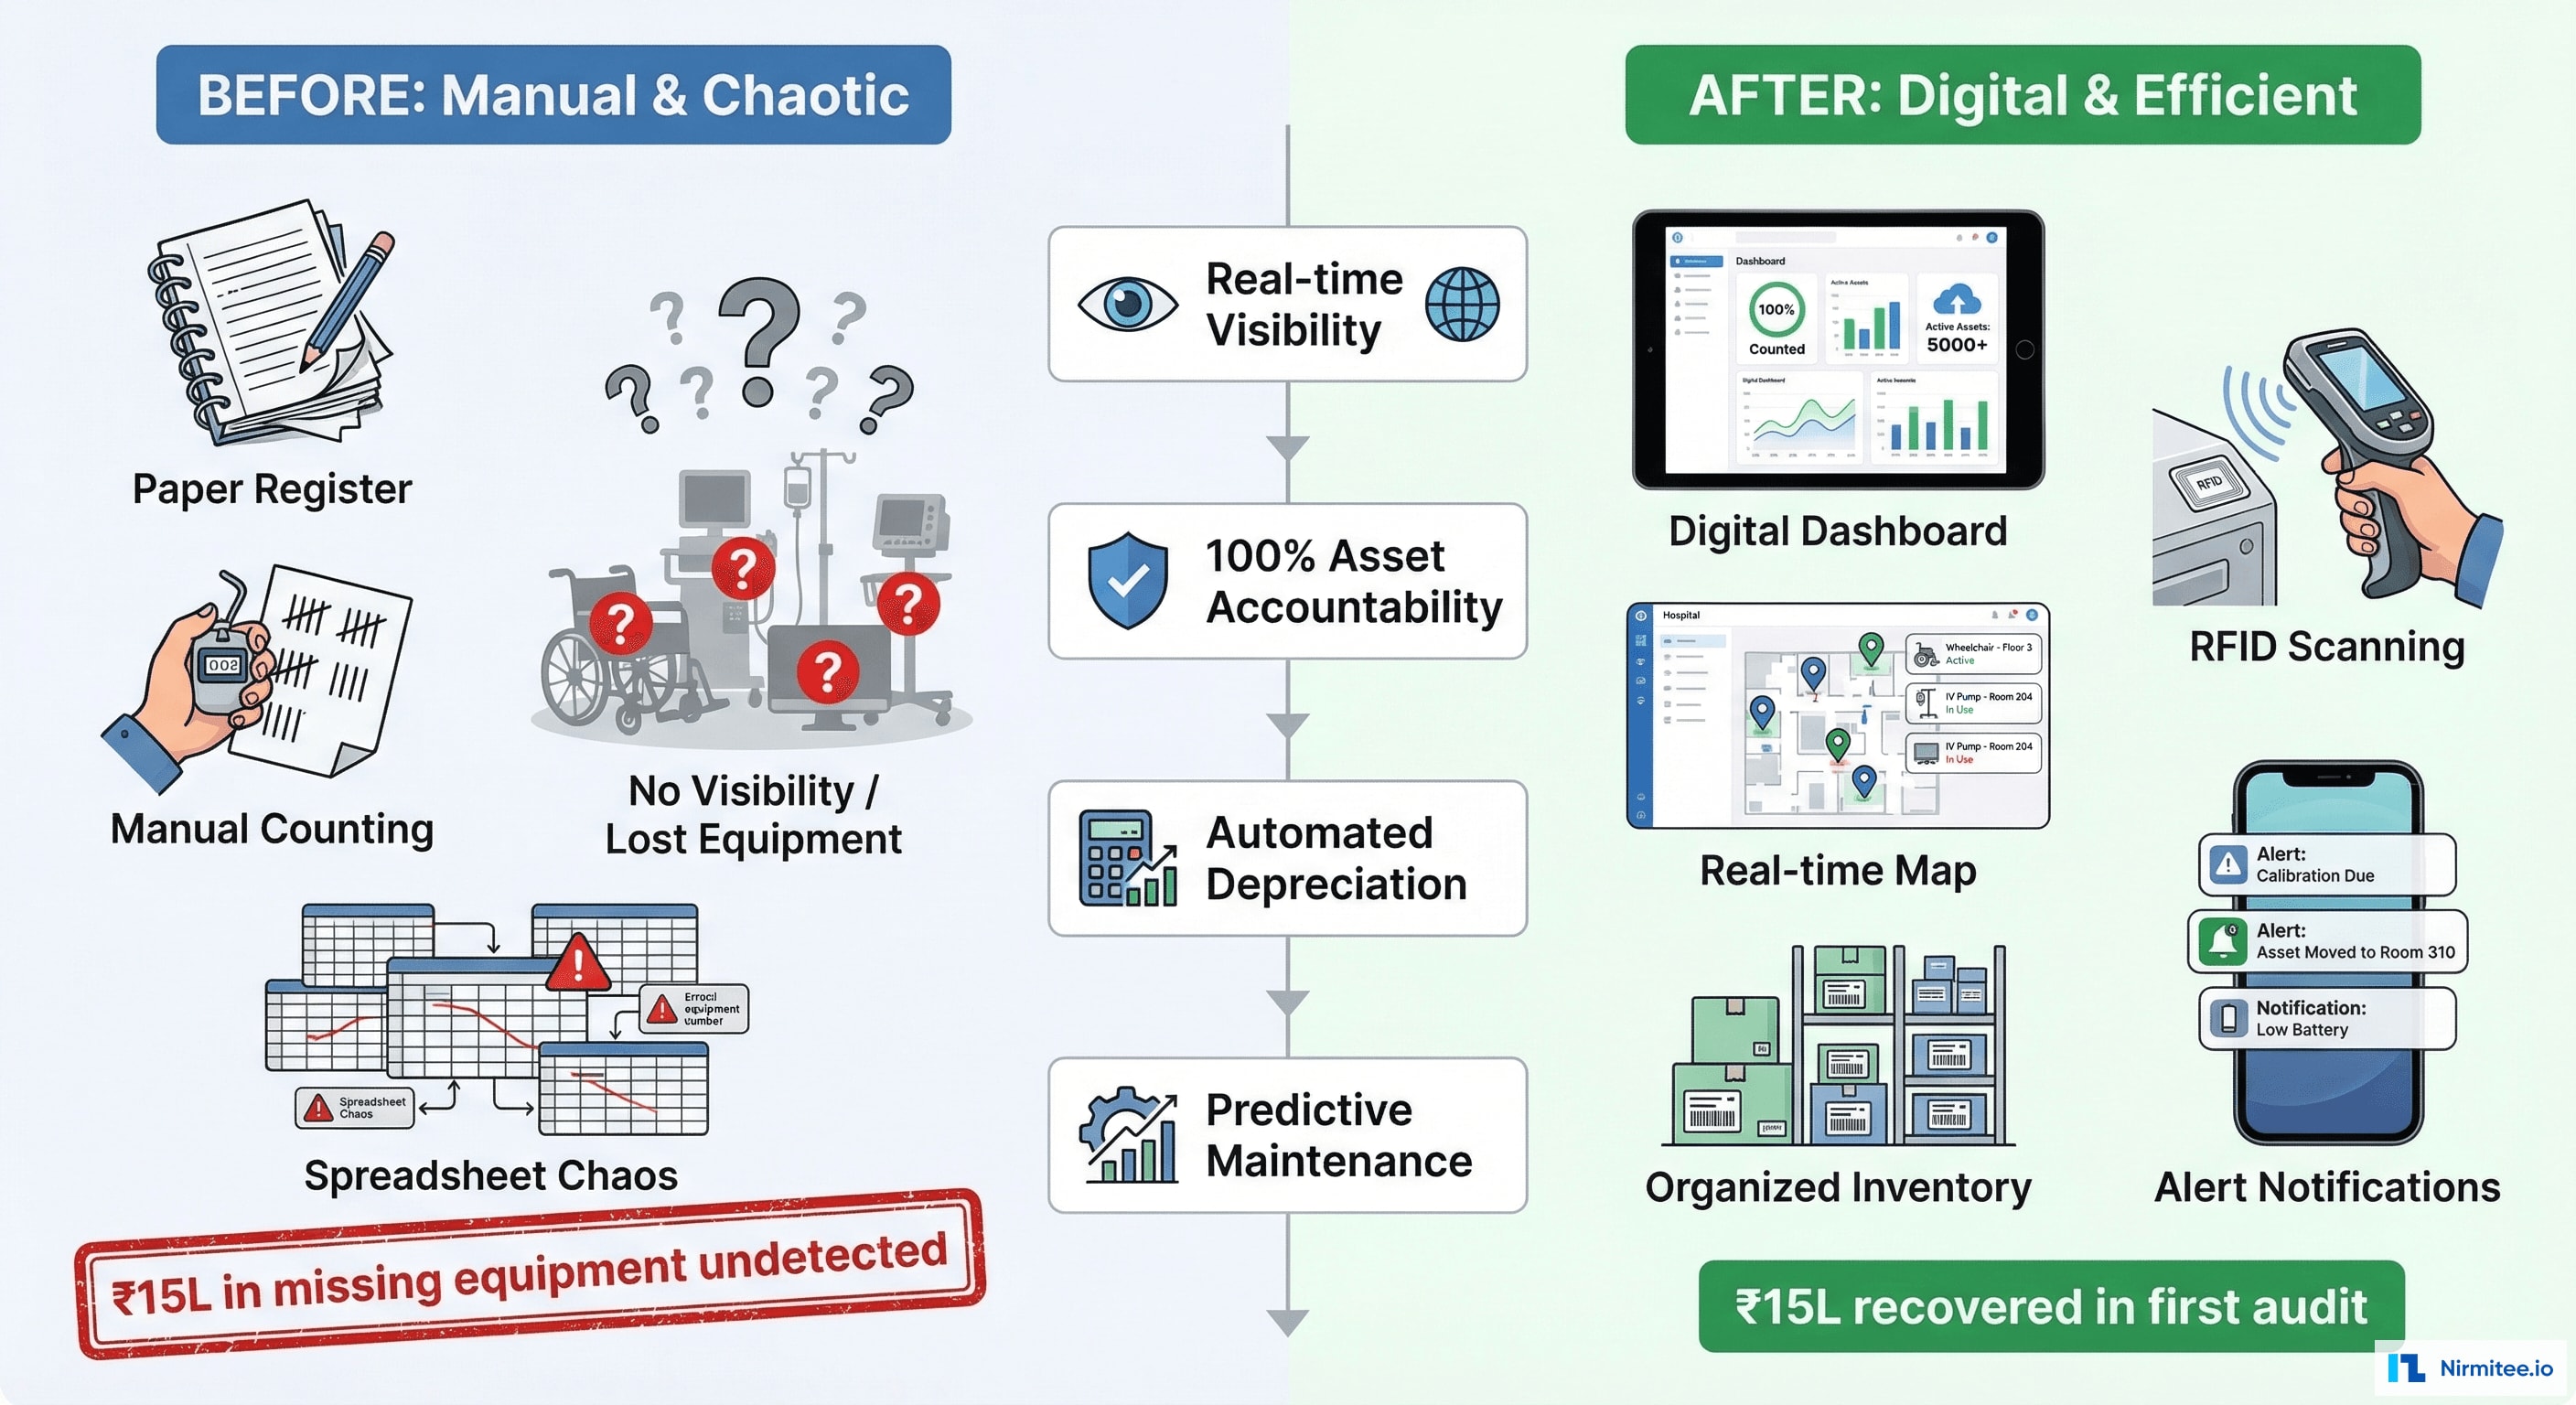
What Was Broken
- Paper-based tracking: Asset registers maintained in physical notebooks by each department. No centralized view. No way to search "where are all our ventilators right now?"
- No location awareness: Equipment moved between departments constantly — ICU to Emergency to Surgery to General Ward. Once moved, the paper register in the original department still showed it as "present"
- Duplicate procurement: Department heads ordered new equipment without knowing that identical devices sat underutilized in other departments. The hospital was buying equipment it already owned.
- Reactive maintenance: No scheduled maintenance. Devices were serviced only after they failed — often during critical patient care situations. A ventilator failing during ICU care is not just an equipment problem; it's a patient safety event.
- Financial black hole: The CFO had no asset register linked to the financial system. Depreciation was calculated on spreadsheets with outdated data. Insurance claims for damaged equipment required manual evidence gathering that took weeks.
- Shrinkage and loss: Equipment disappeared — through theft, misplacement, unauthorized transfers, or simply being forgotten in storage rooms. Nobody knew the true inventory until a physical audit.
The ₹15 Lakh Wake-Up Call
The hospital's biomedical engineering department ordered 8 nebulizers at ₹3 lakh each — ₹24 lakh total investment. Purchase orders confirmed delivery. The receiving department signed off. But when the asset management system ran its first stock audit:
- 3 nebulizers found in the pulmonology department (active use)
- 5 nebulizers missing — not in any department, not in storage, not in maintenance
- ₹15 lakh in equipment — gone
Investigation revealed a combination of factors: 2 were transferred to a satellite clinic without documentation, 1 was in a storage room that nobody checked, and 2 were genuinely lost. This single discovery justified the entire platform investment.
The Asset Management Dashboard
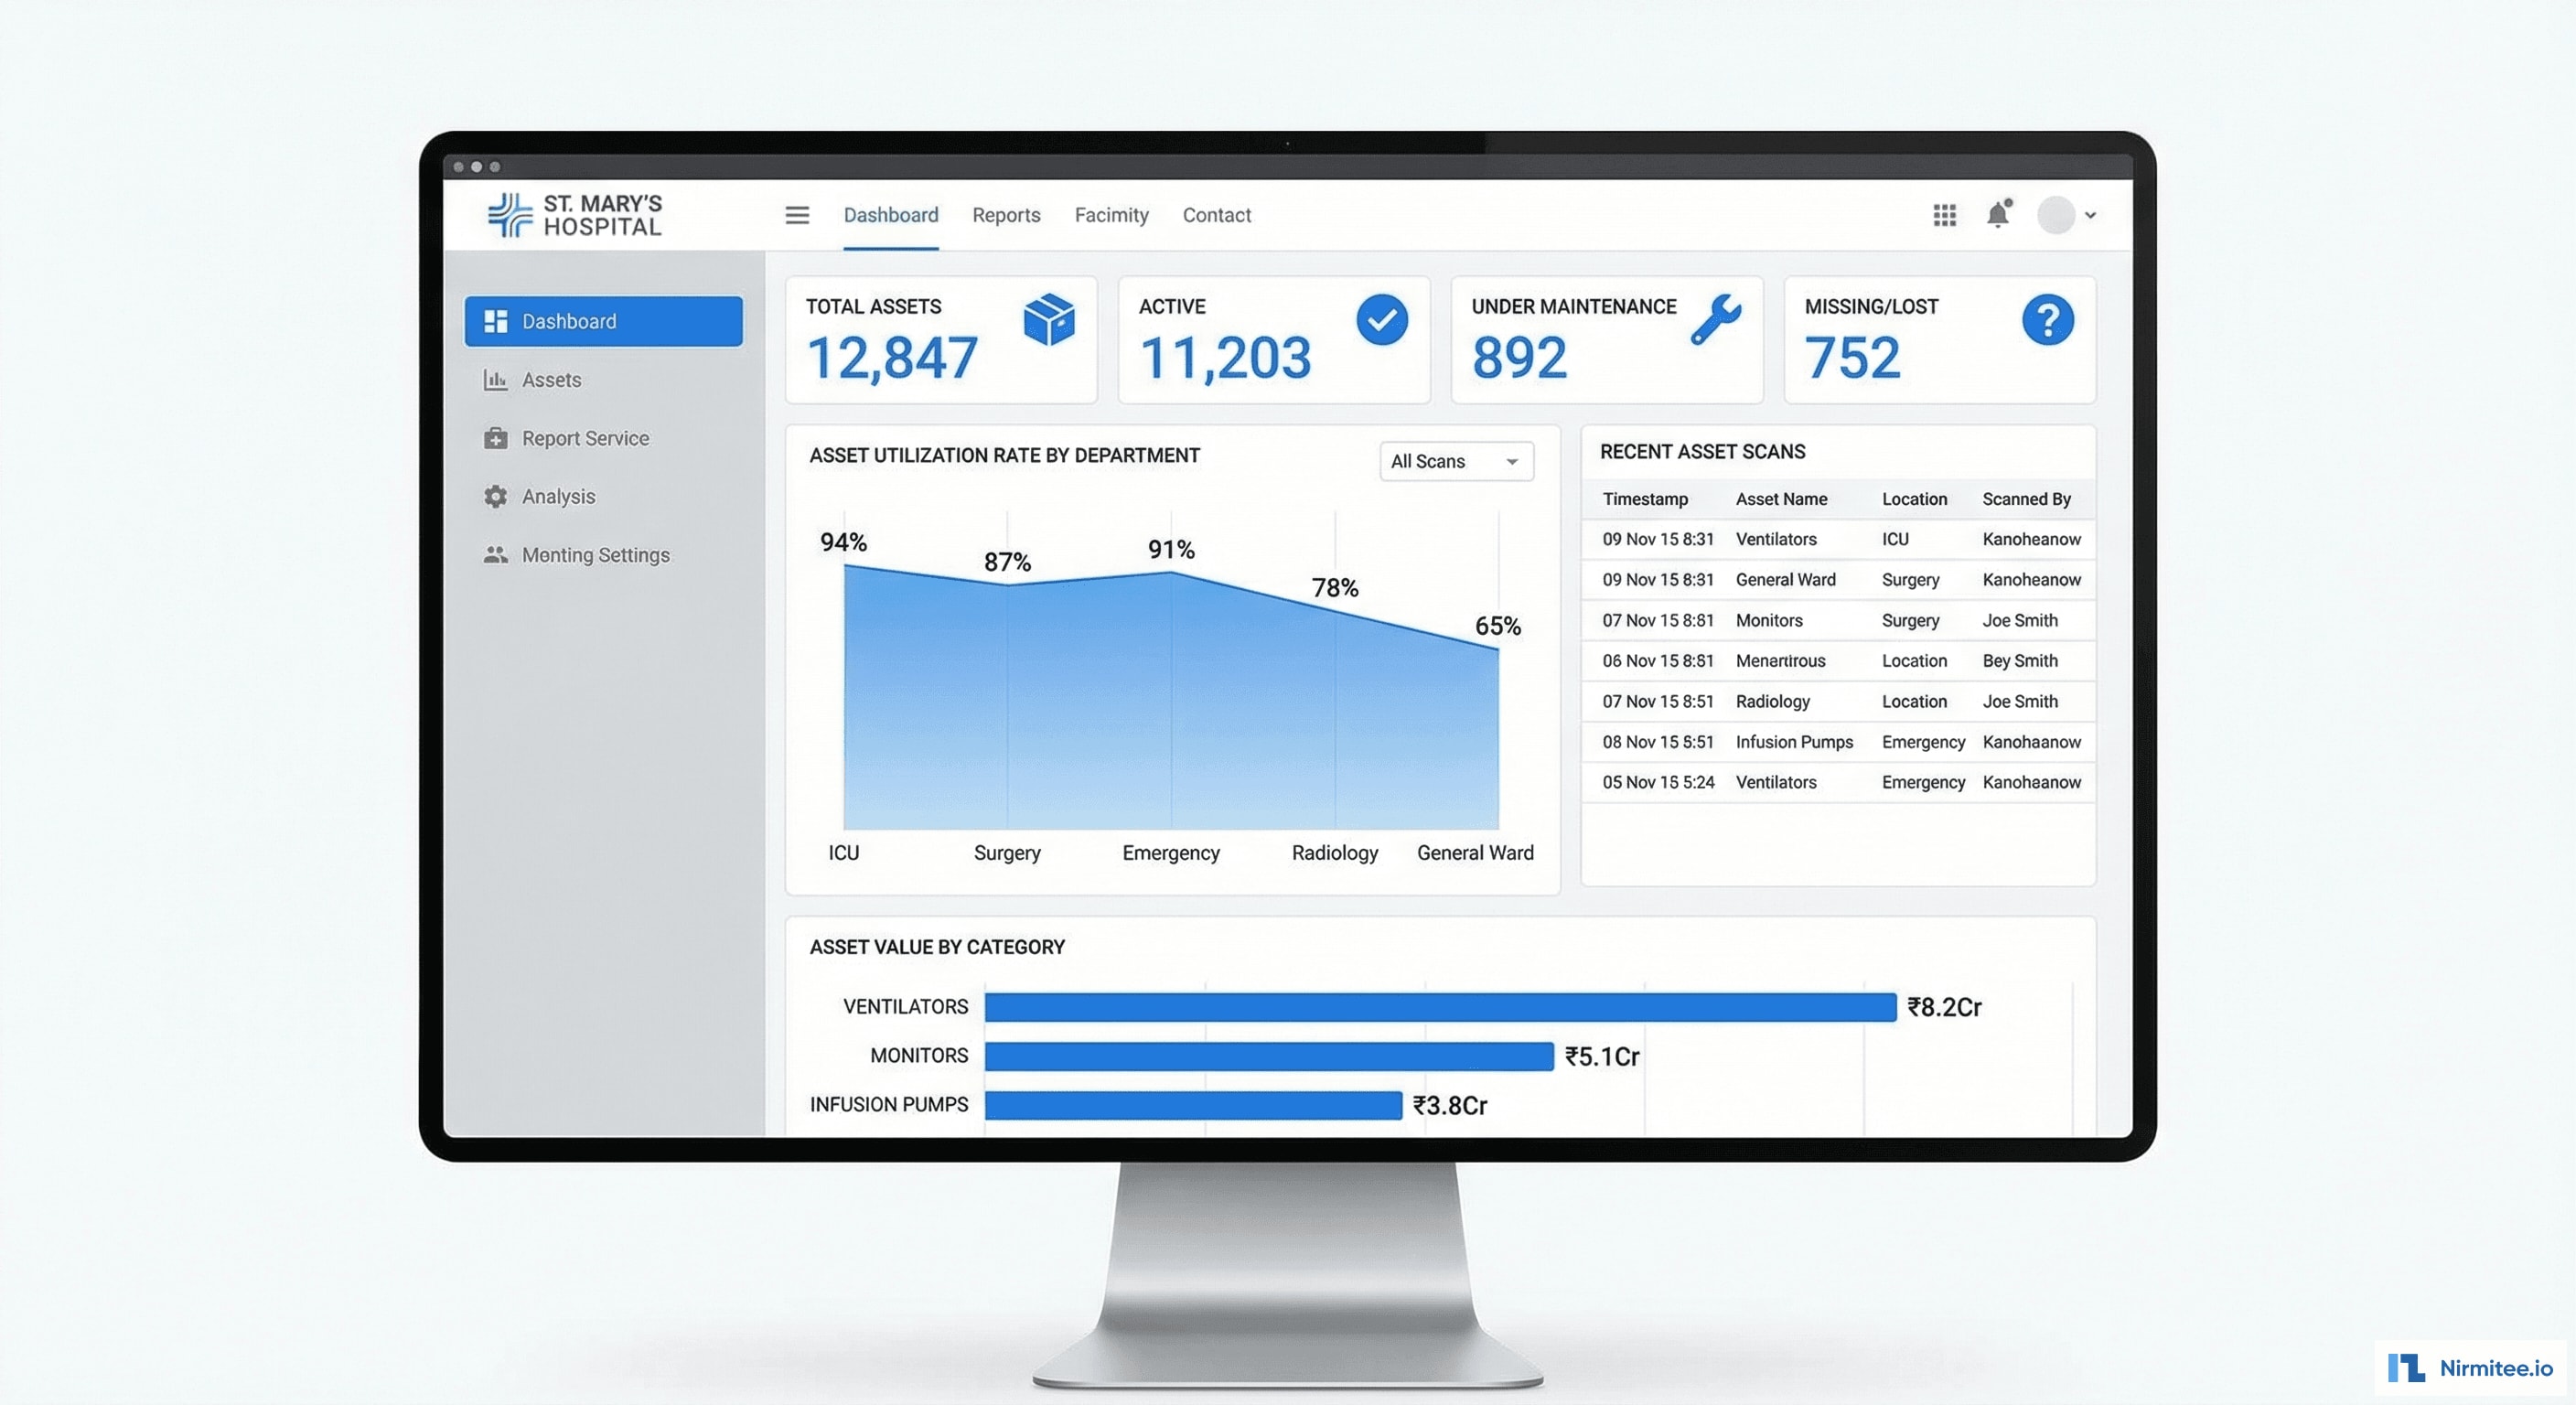
The main dashboard gives hospital administrators instant visibility into the entire equipment portfolio:
- Total Assets (12,847): every tagged device across all departments, categorized by type, value, and status
- Active vs. Inactive: real-time count of devices in active use, under maintenance, in storage, or flagged as missing
- Utilization by Department: which departments are using their equipment efficiently (ICU at 94%) and which have underutilized assets (General Ward at 65%) — enabling redistribution before new procurement
- Recent Scan Activity: live feed of barcode/RFID scans across the hospital — showing staff accountability and asset movement patterns
- Asset Value Distribution: breakdown by category showing where the capital is concentrated — ventilators (₹8.2 Cr), monitors (₹5.1 Cr), infusion pumps (₹3.8 Cr)
System Architecture
Physical Layer
Every medical device is tagged with a durable barcode label and/or passive RFID tag. Fixed RFID readers are installed at department entrances and storage rooms to automatically detect asset movement. Staff also use handheld scanners and a mobile app for manual scans during rounds and audits.
Processing Layer
- API Gateway (Node.js): handles scan events from all sources — fixed readers, handheld scanners, mobile app
- Asset Database (PostgreSQL): master record for every asset — identity, location history, ownership, financial data, maintenance history
- Event Stream (Redis): real-time processing of scan events for location updates and alert triggers
- Location Engine: determines asset location based on scan data, resolves conflicts (same asset scanned in two places), maintains location history
- Alert Engine: triggers notifications for: missing assets (not scanned in X days), overdue maintenance, unauthorized movement, audit discrepancies
Integration Points
- Hospital ERP: procurement data, purchase orders, vendor management
- Financial System (Tally/SAP): depreciation schedules, asset valuation, budget allocation
- CMMS (Maintenance System): service schedules, work orders, spare parts inventory
- Insurance System: asset valuation for coverage, damage claim documentation
Technology Stack
| Layer | Technology | Purpose |
|---|---|---|
| Mobile App | React Native | Barcode scanning, asset lookup, audit execution |
| Web Dashboard | React + TypeScript | Admin dashboard, CFO view, department views |
| Backend | Node.js (Express) | API gateway, business logic, event processing |
| Database | PostgreSQL | Asset master data, location history, financials |
| Real-time | Redis + Socket.io | Live scan events, real-time dashboard updates |
| Scanning | RFID (UHF passive) + Barcode | Asset identification and location detection |
| Reports | Puppeteer (PDF generation) | Audit reports, financial statements, compliance docs |
| Infrastructure | AWS (Mumbai region) | Cloud hosting with local data residency |
CFO Financial Dashboard
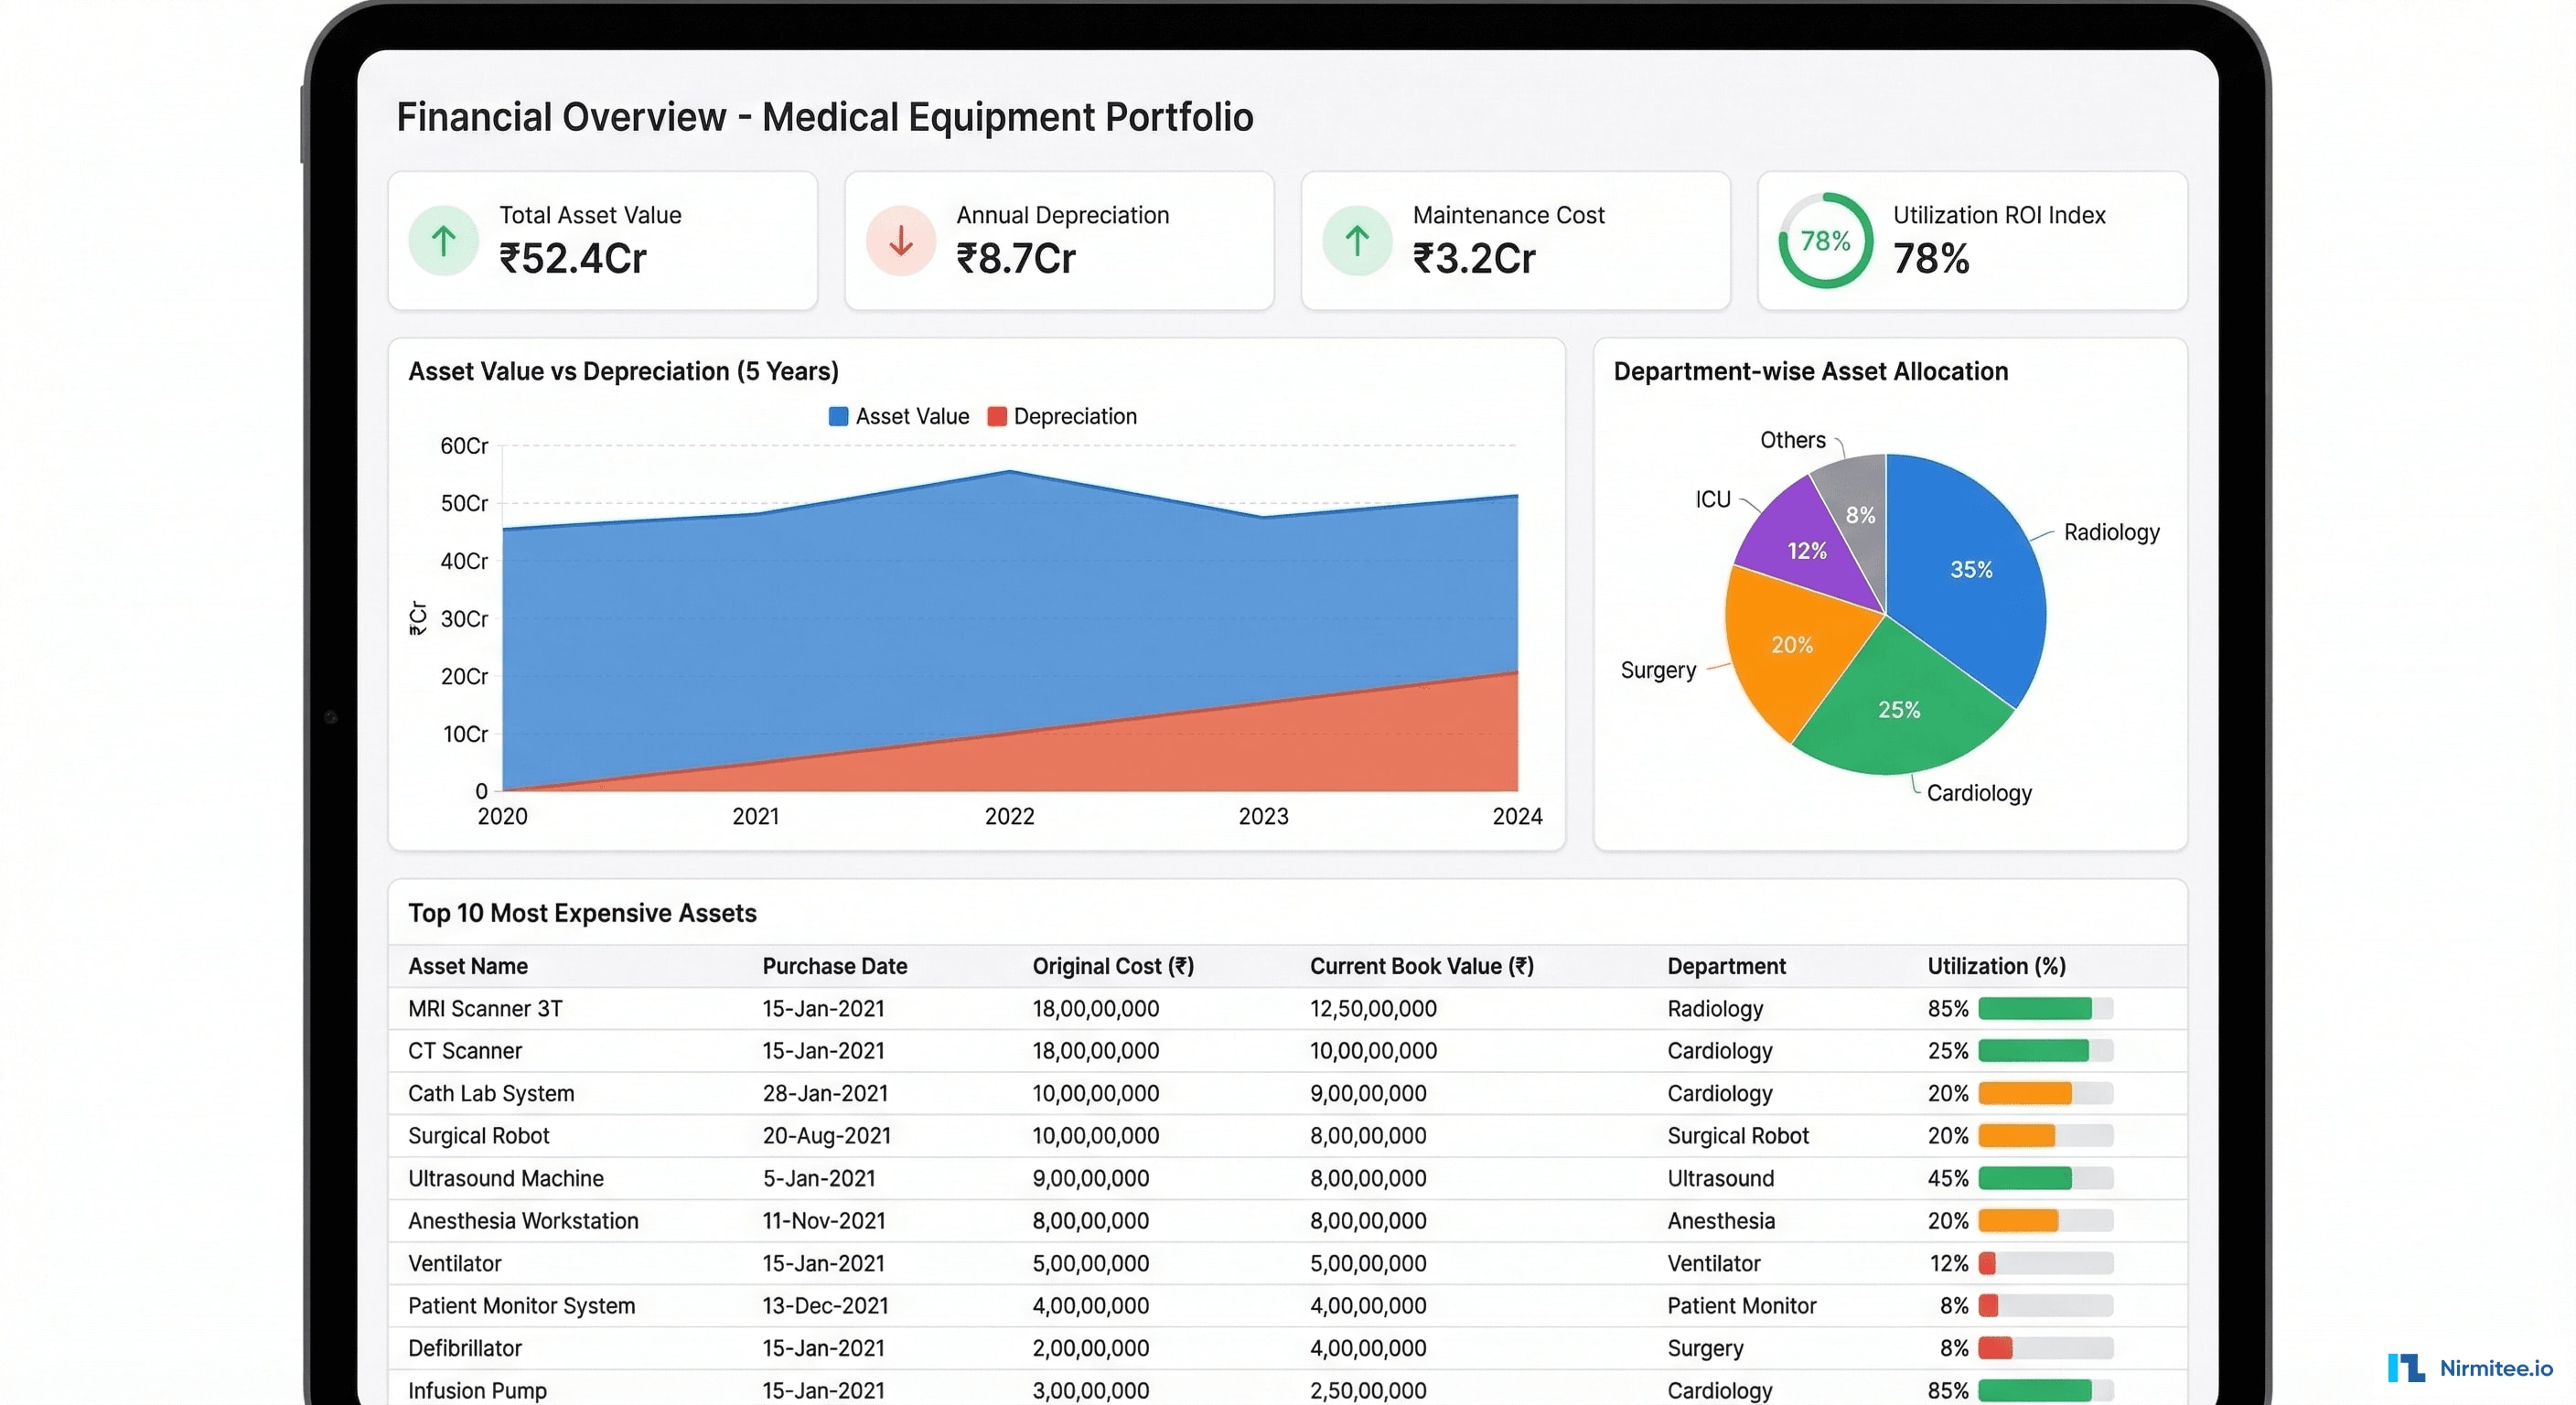
For the first time, the hospital's CFO has a real-time financial view of the entire equipment portfolio:
- Total Asset Value (₹52.4 Cr): current book value of all medical equipment, automatically updated as depreciation accrues
- Annual Depreciation (₹8.7 Cr): straight-line and WDV depreciation calculated automatically based on asset type, purchase date, and useful life
- Maintenance Cost Tracking (₹3.2 Cr): actual maintenance spend vs. budget, by department and asset category
- Utilization ROI Index: a composite metric combining asset utilization rate, maintenance cost ratio, and remaining useful life to identify assets that should be replaced vs. continued
- Top 10 Most Expensive Assets: sortable table showing purchase cost, current value, department, and utilization — enabling data-driven procurement decisions
Stock Audit Workflow
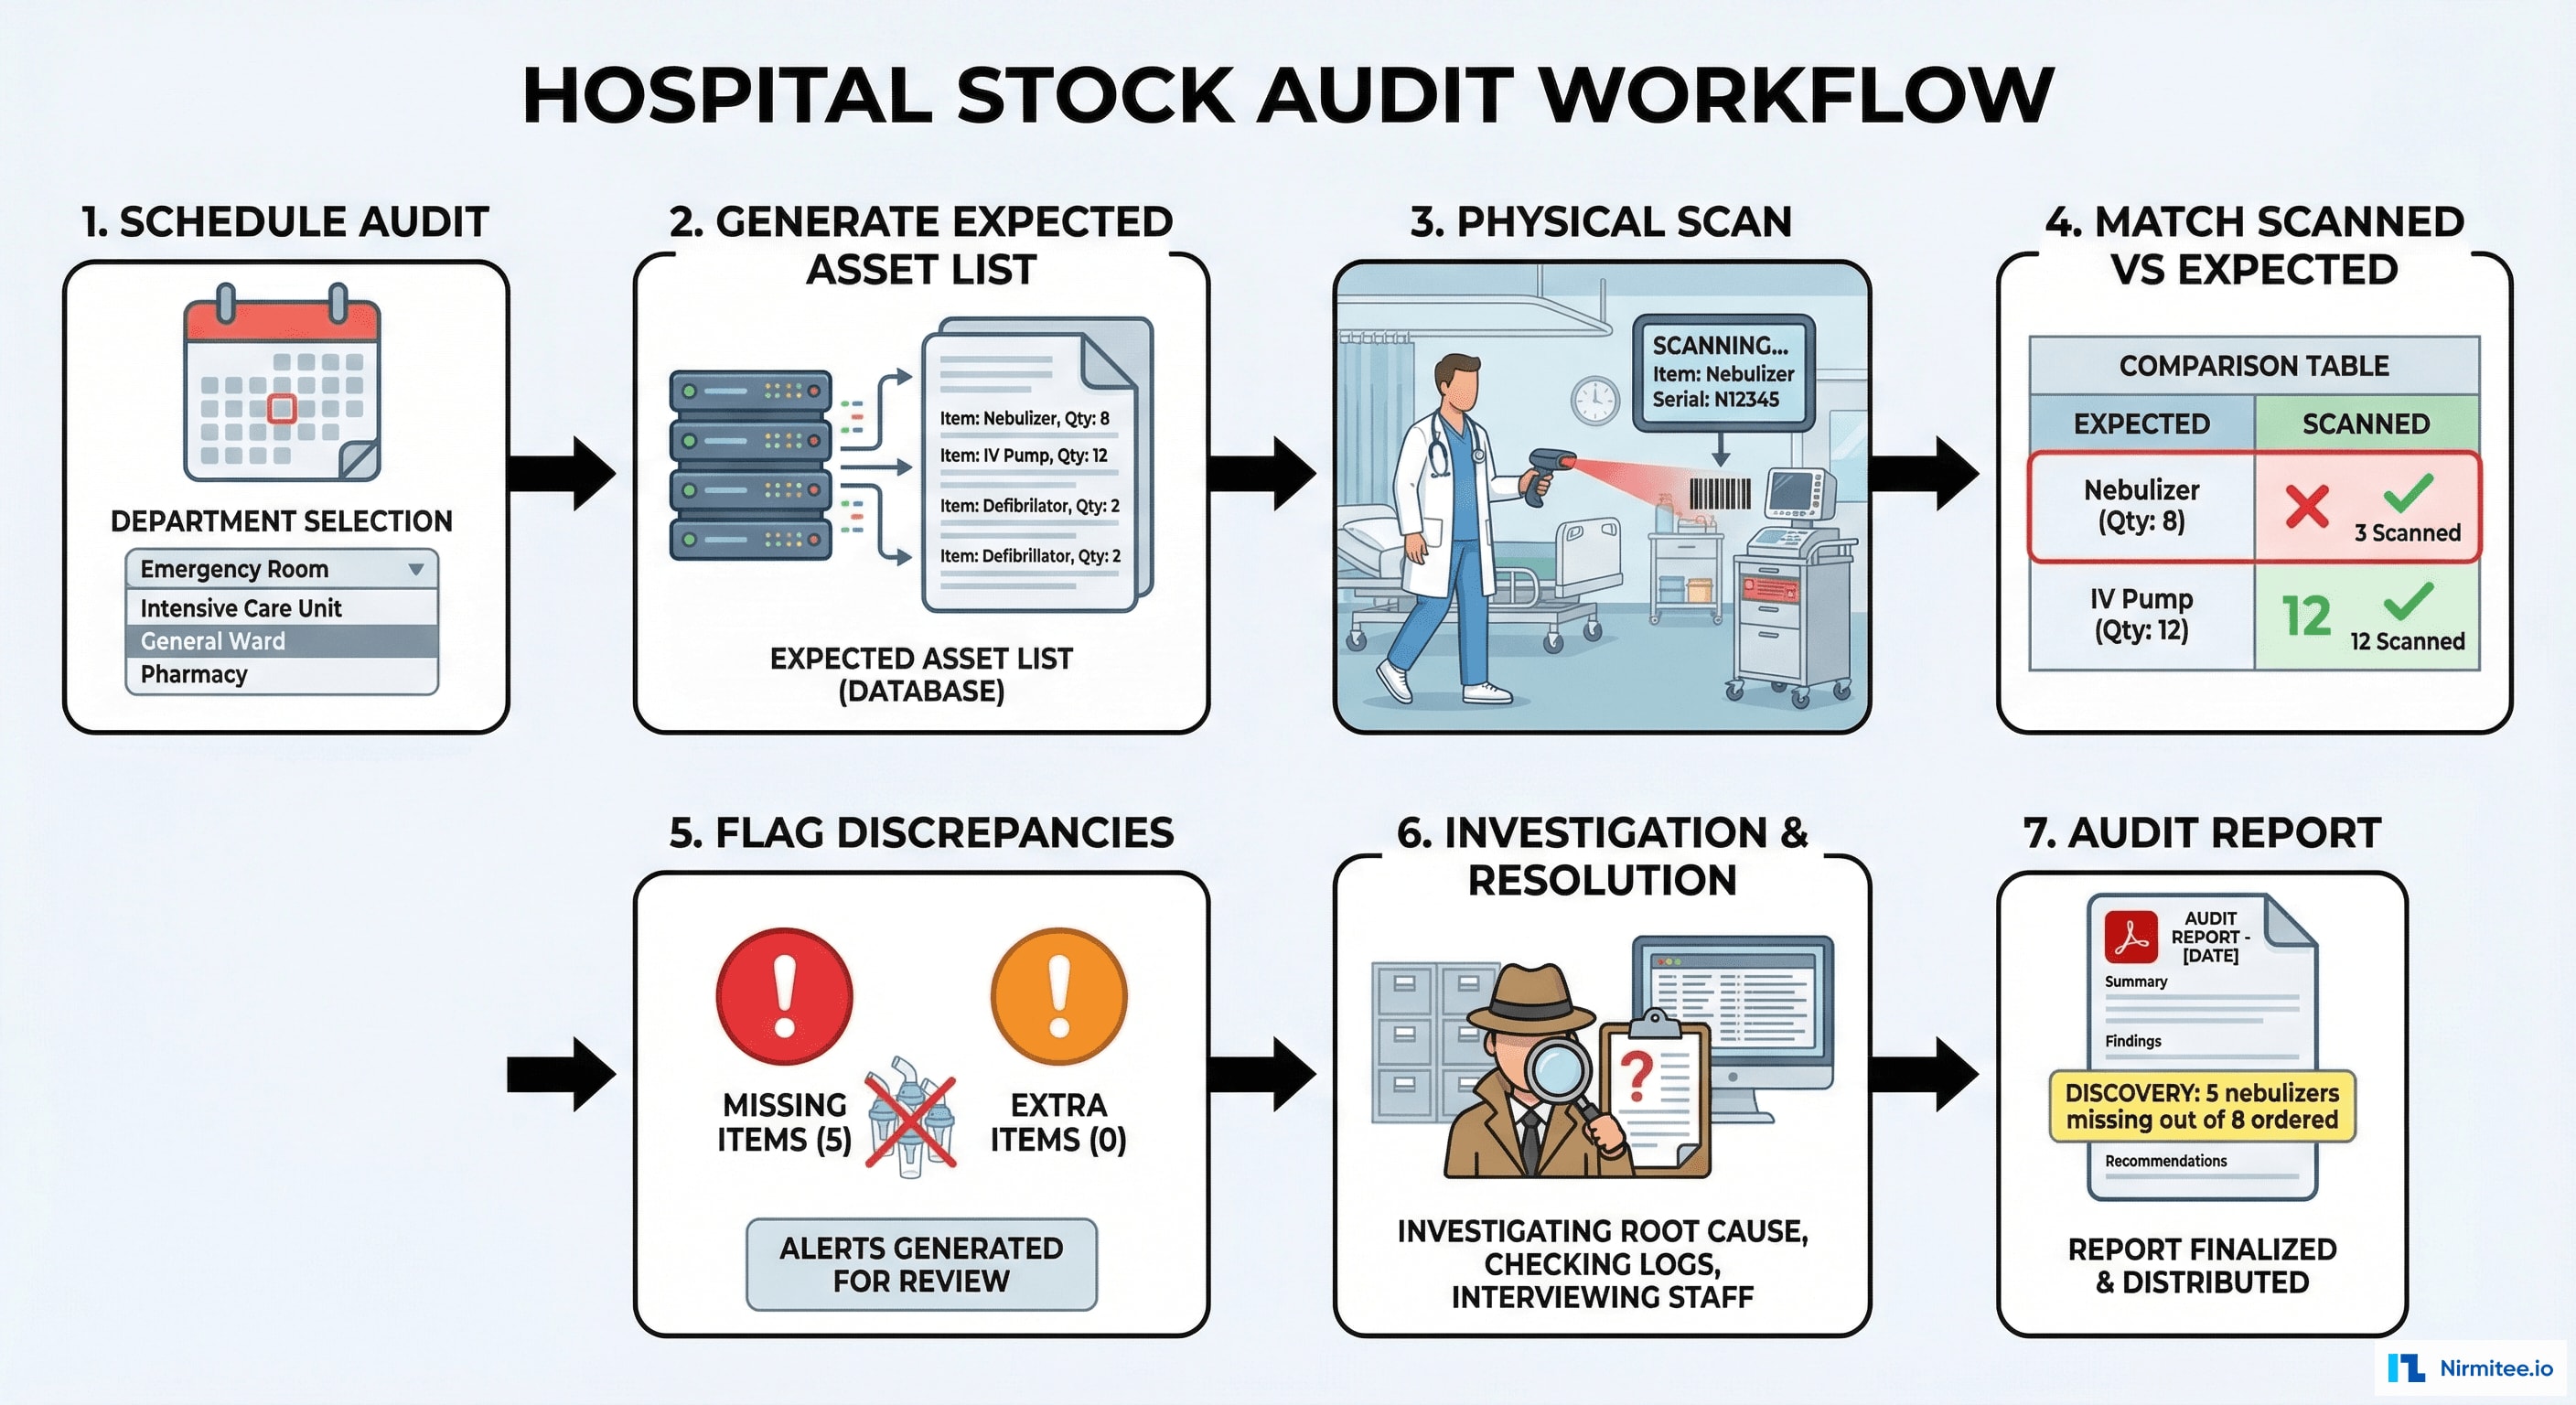
The stock audit process that discovered the missing nebulizers is now a systematic, repeatable workflow:
- Schedule Audit: administrator selects department, date, and assigns audit staff
- Generate Expected List: system pulls all assets registered to that department from the master database
- Physical Scan: audit staff walks through the department with handheld scanner, scanning every device they find
- Automated Matching: system compares scanned assets vs. expected list in real-time, highlighting matches (green) and mismatches (red)
- Flag Discrepancies: three categories — Missing (expected but not scanned), Extra (scanned but not expected — transferred from elsewhere), Condition Issues (scanned but flagged for damage)
- Investigation: each discrepancy assigned to a responsible person with a deadline for resolution
- Audit Report: comprehensive PDF report with findings, photographs, financial impact, and recommendations
Asset Detail View
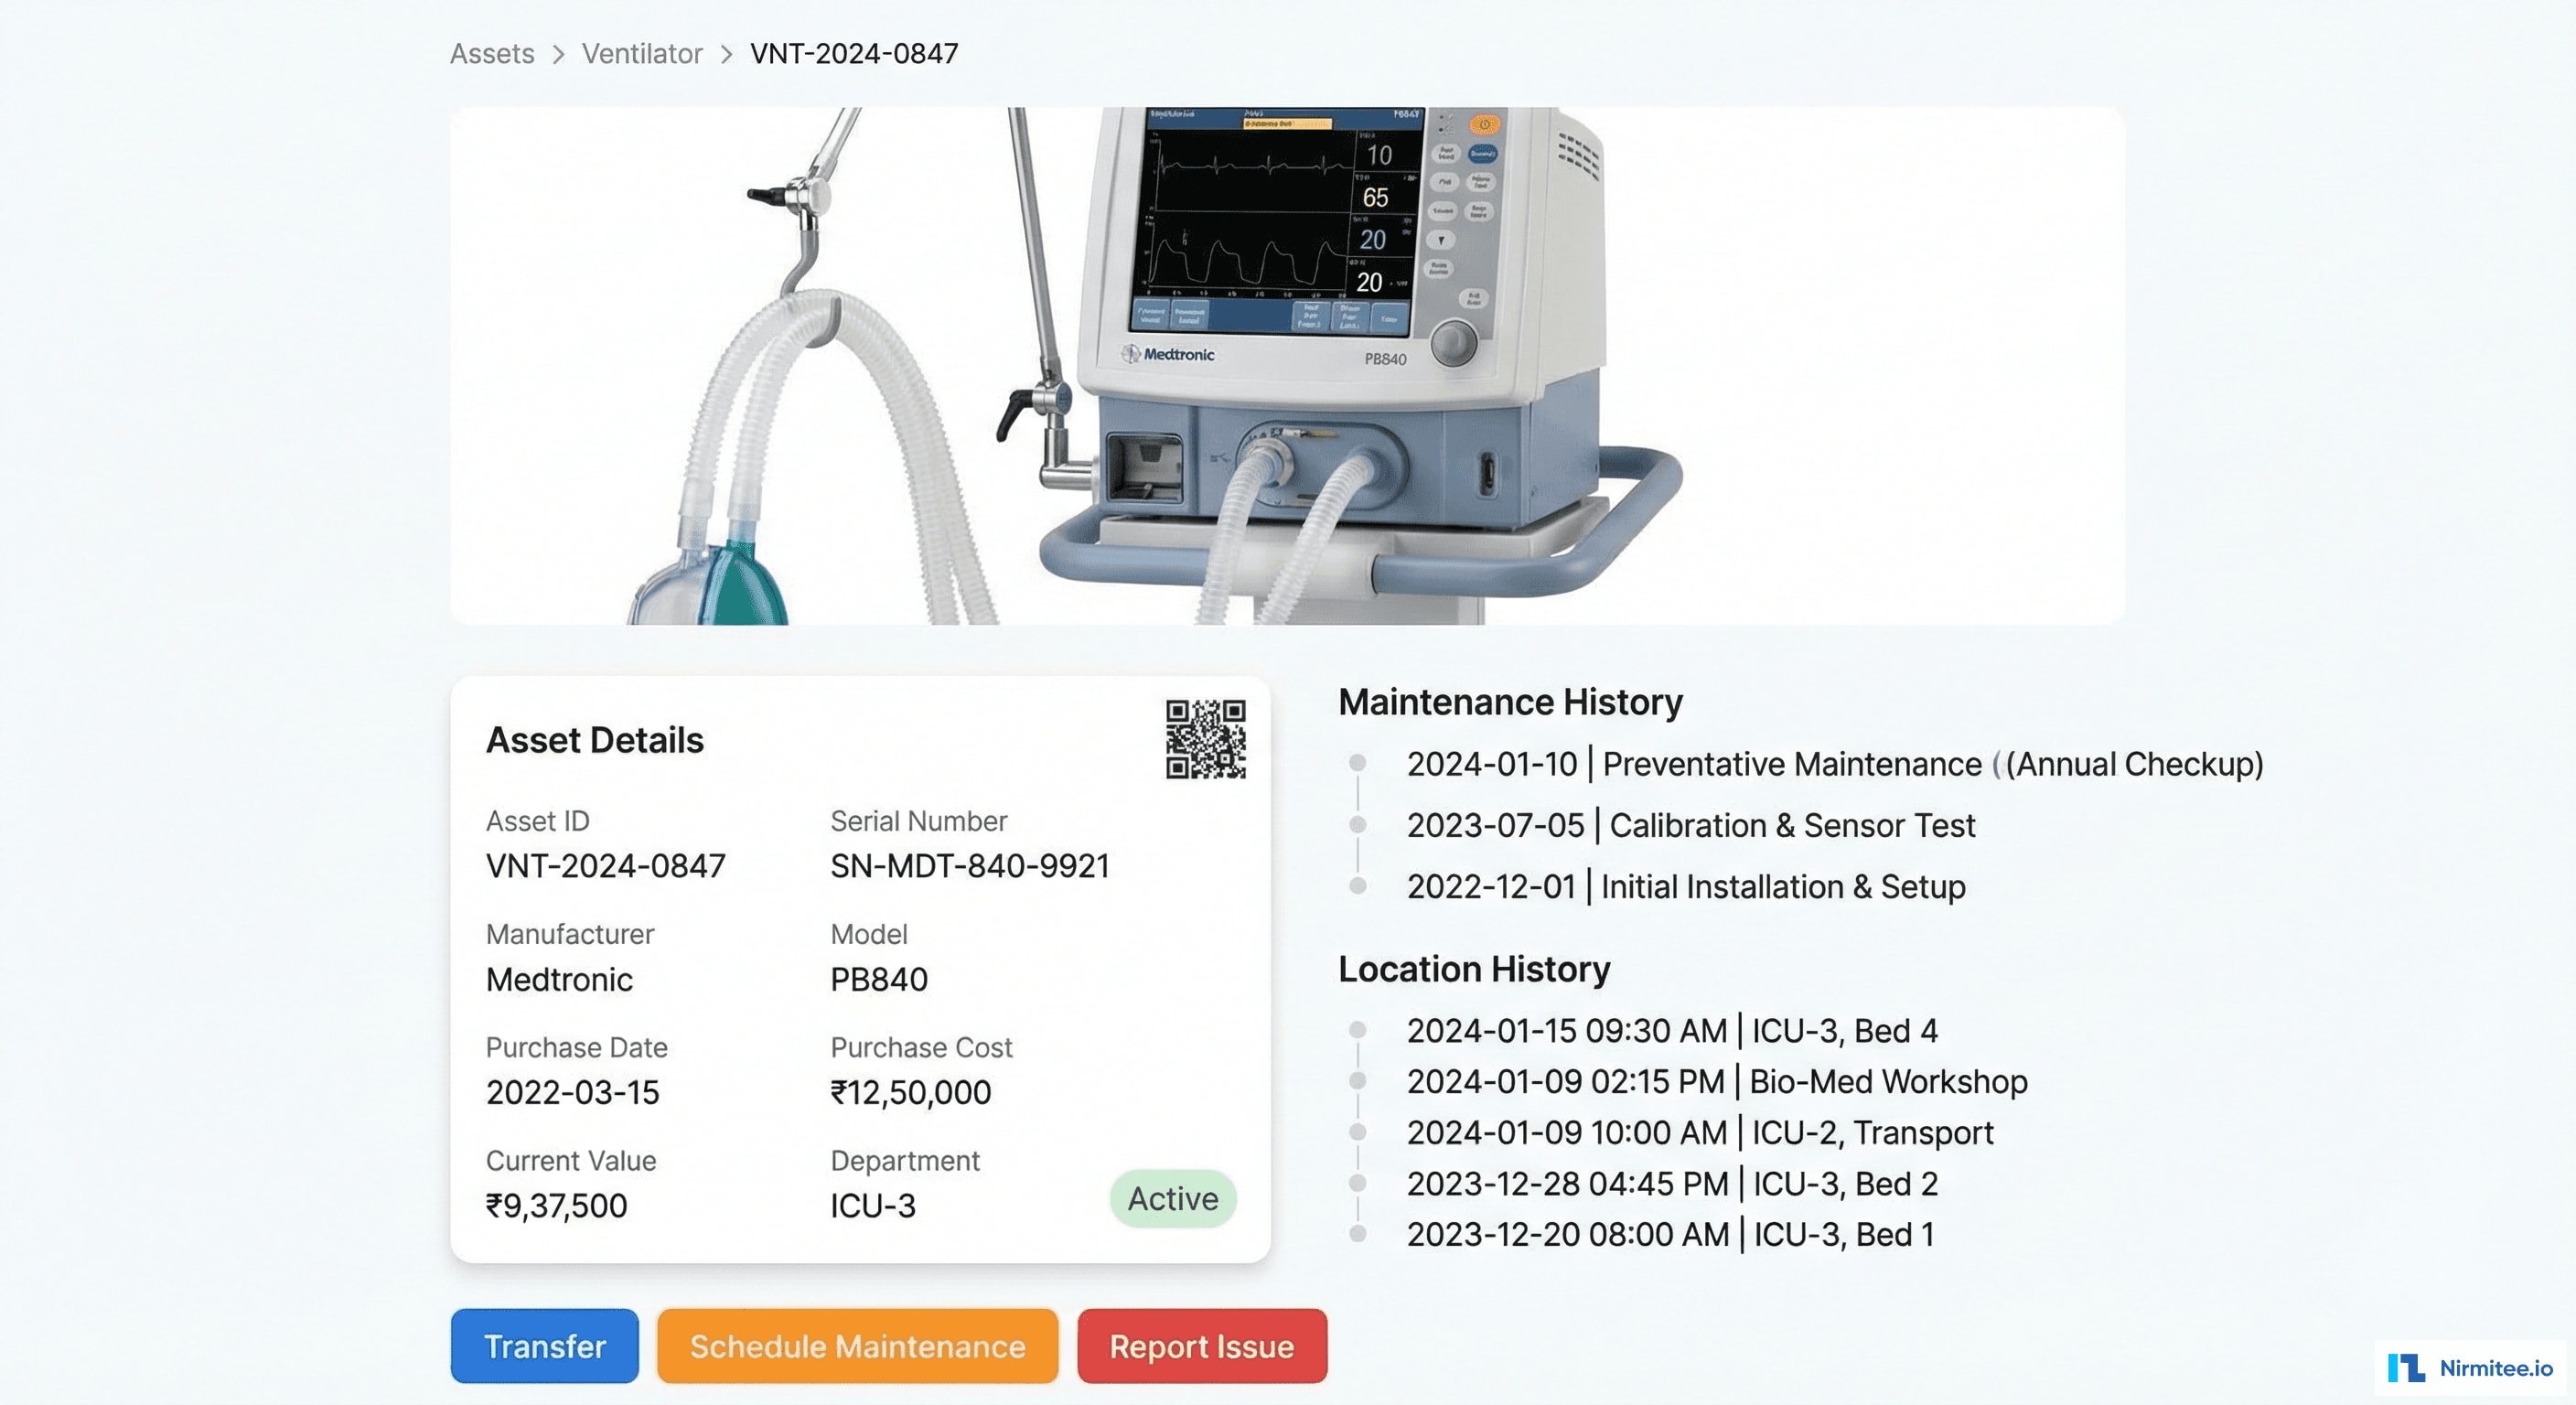
Every asset has a complete digital profile showing its entire lifecycle:
- Identity: asset ID, serial number, manufacturer, model, QR code for quick mobile scan
- Financial: purchase cost, current book value (auto-depreciated), department allocation, insurance coverage
- Location History: every location change recorded with timestamp — showing exactly where the device has been
- Maintenance History: complete service record — preventive maintenance, repairs, parts replaced, service costs
- Actions: transfer to another department, schedule maintenance, report an issue, flag for disposal
Real-Time Location Map
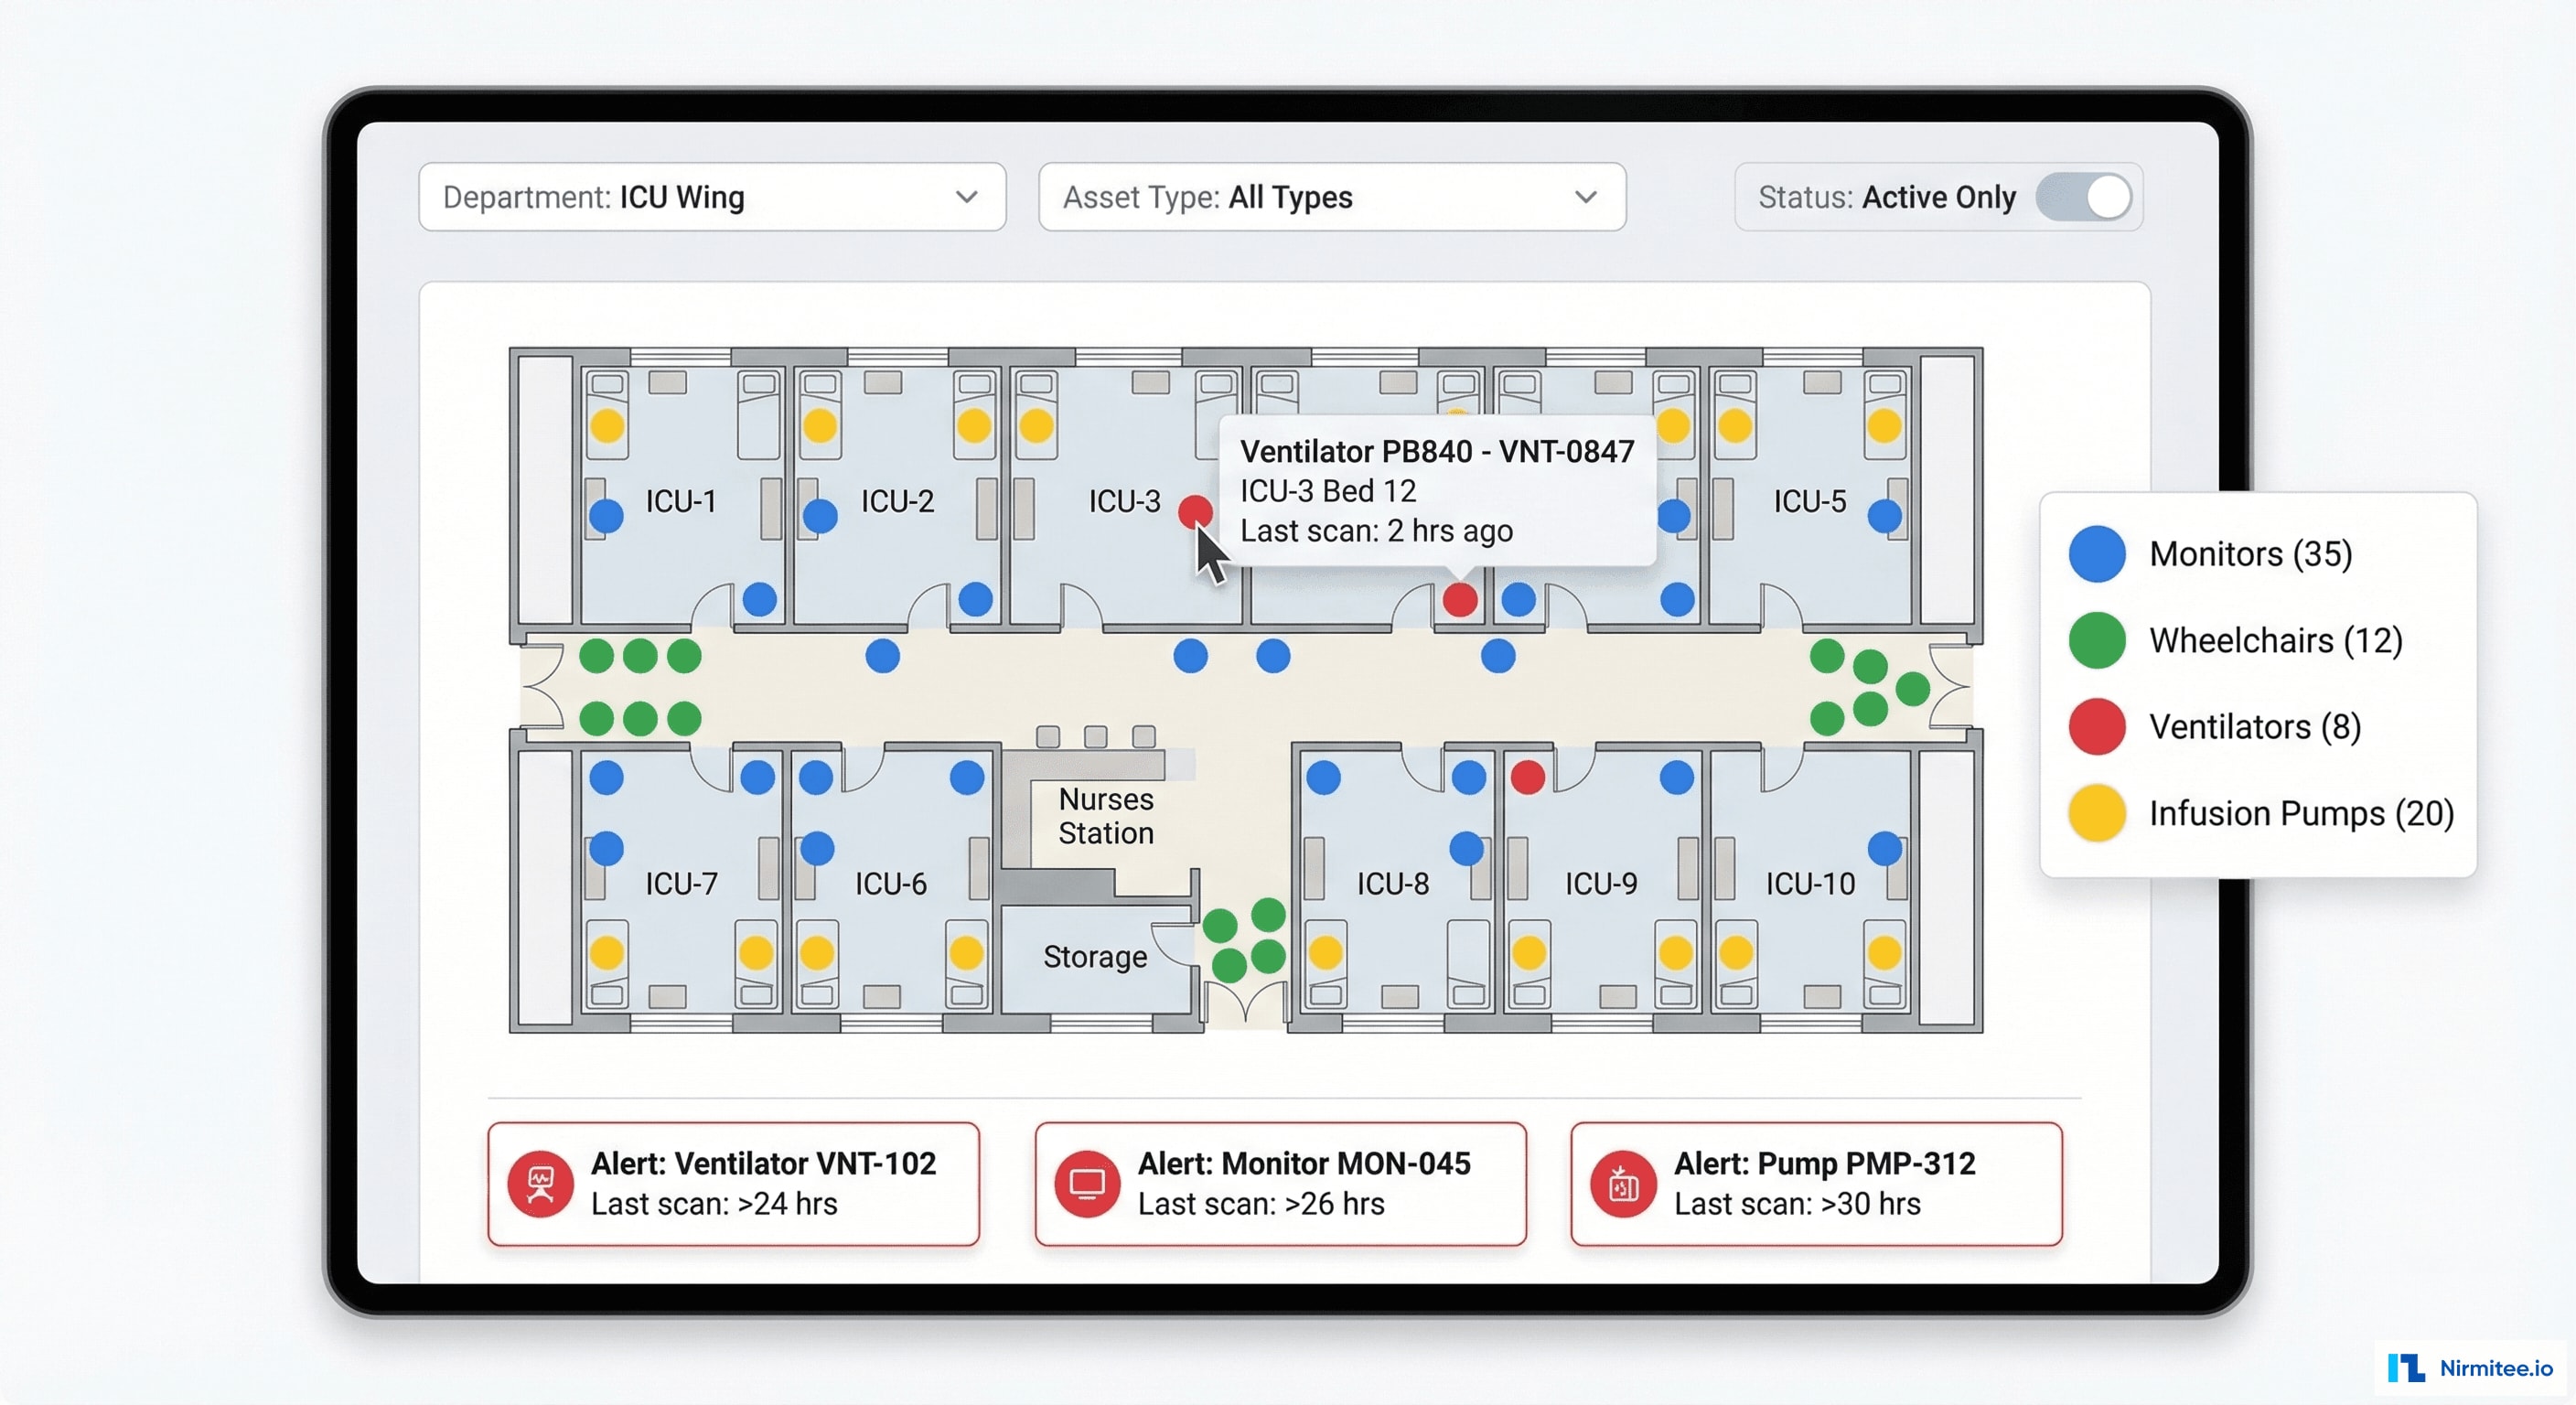
The location map view shows every tracked asset on a hospital floor plan in real-time. Color-coded dots represent different asset types. Staff can filter by department, asset type, or status. Assets not scanned in 24+ hours are highlighted as alerts — preventing the "forgotten in storage" problem that contributed to the missing nebulizers.
Predictive Maintenance
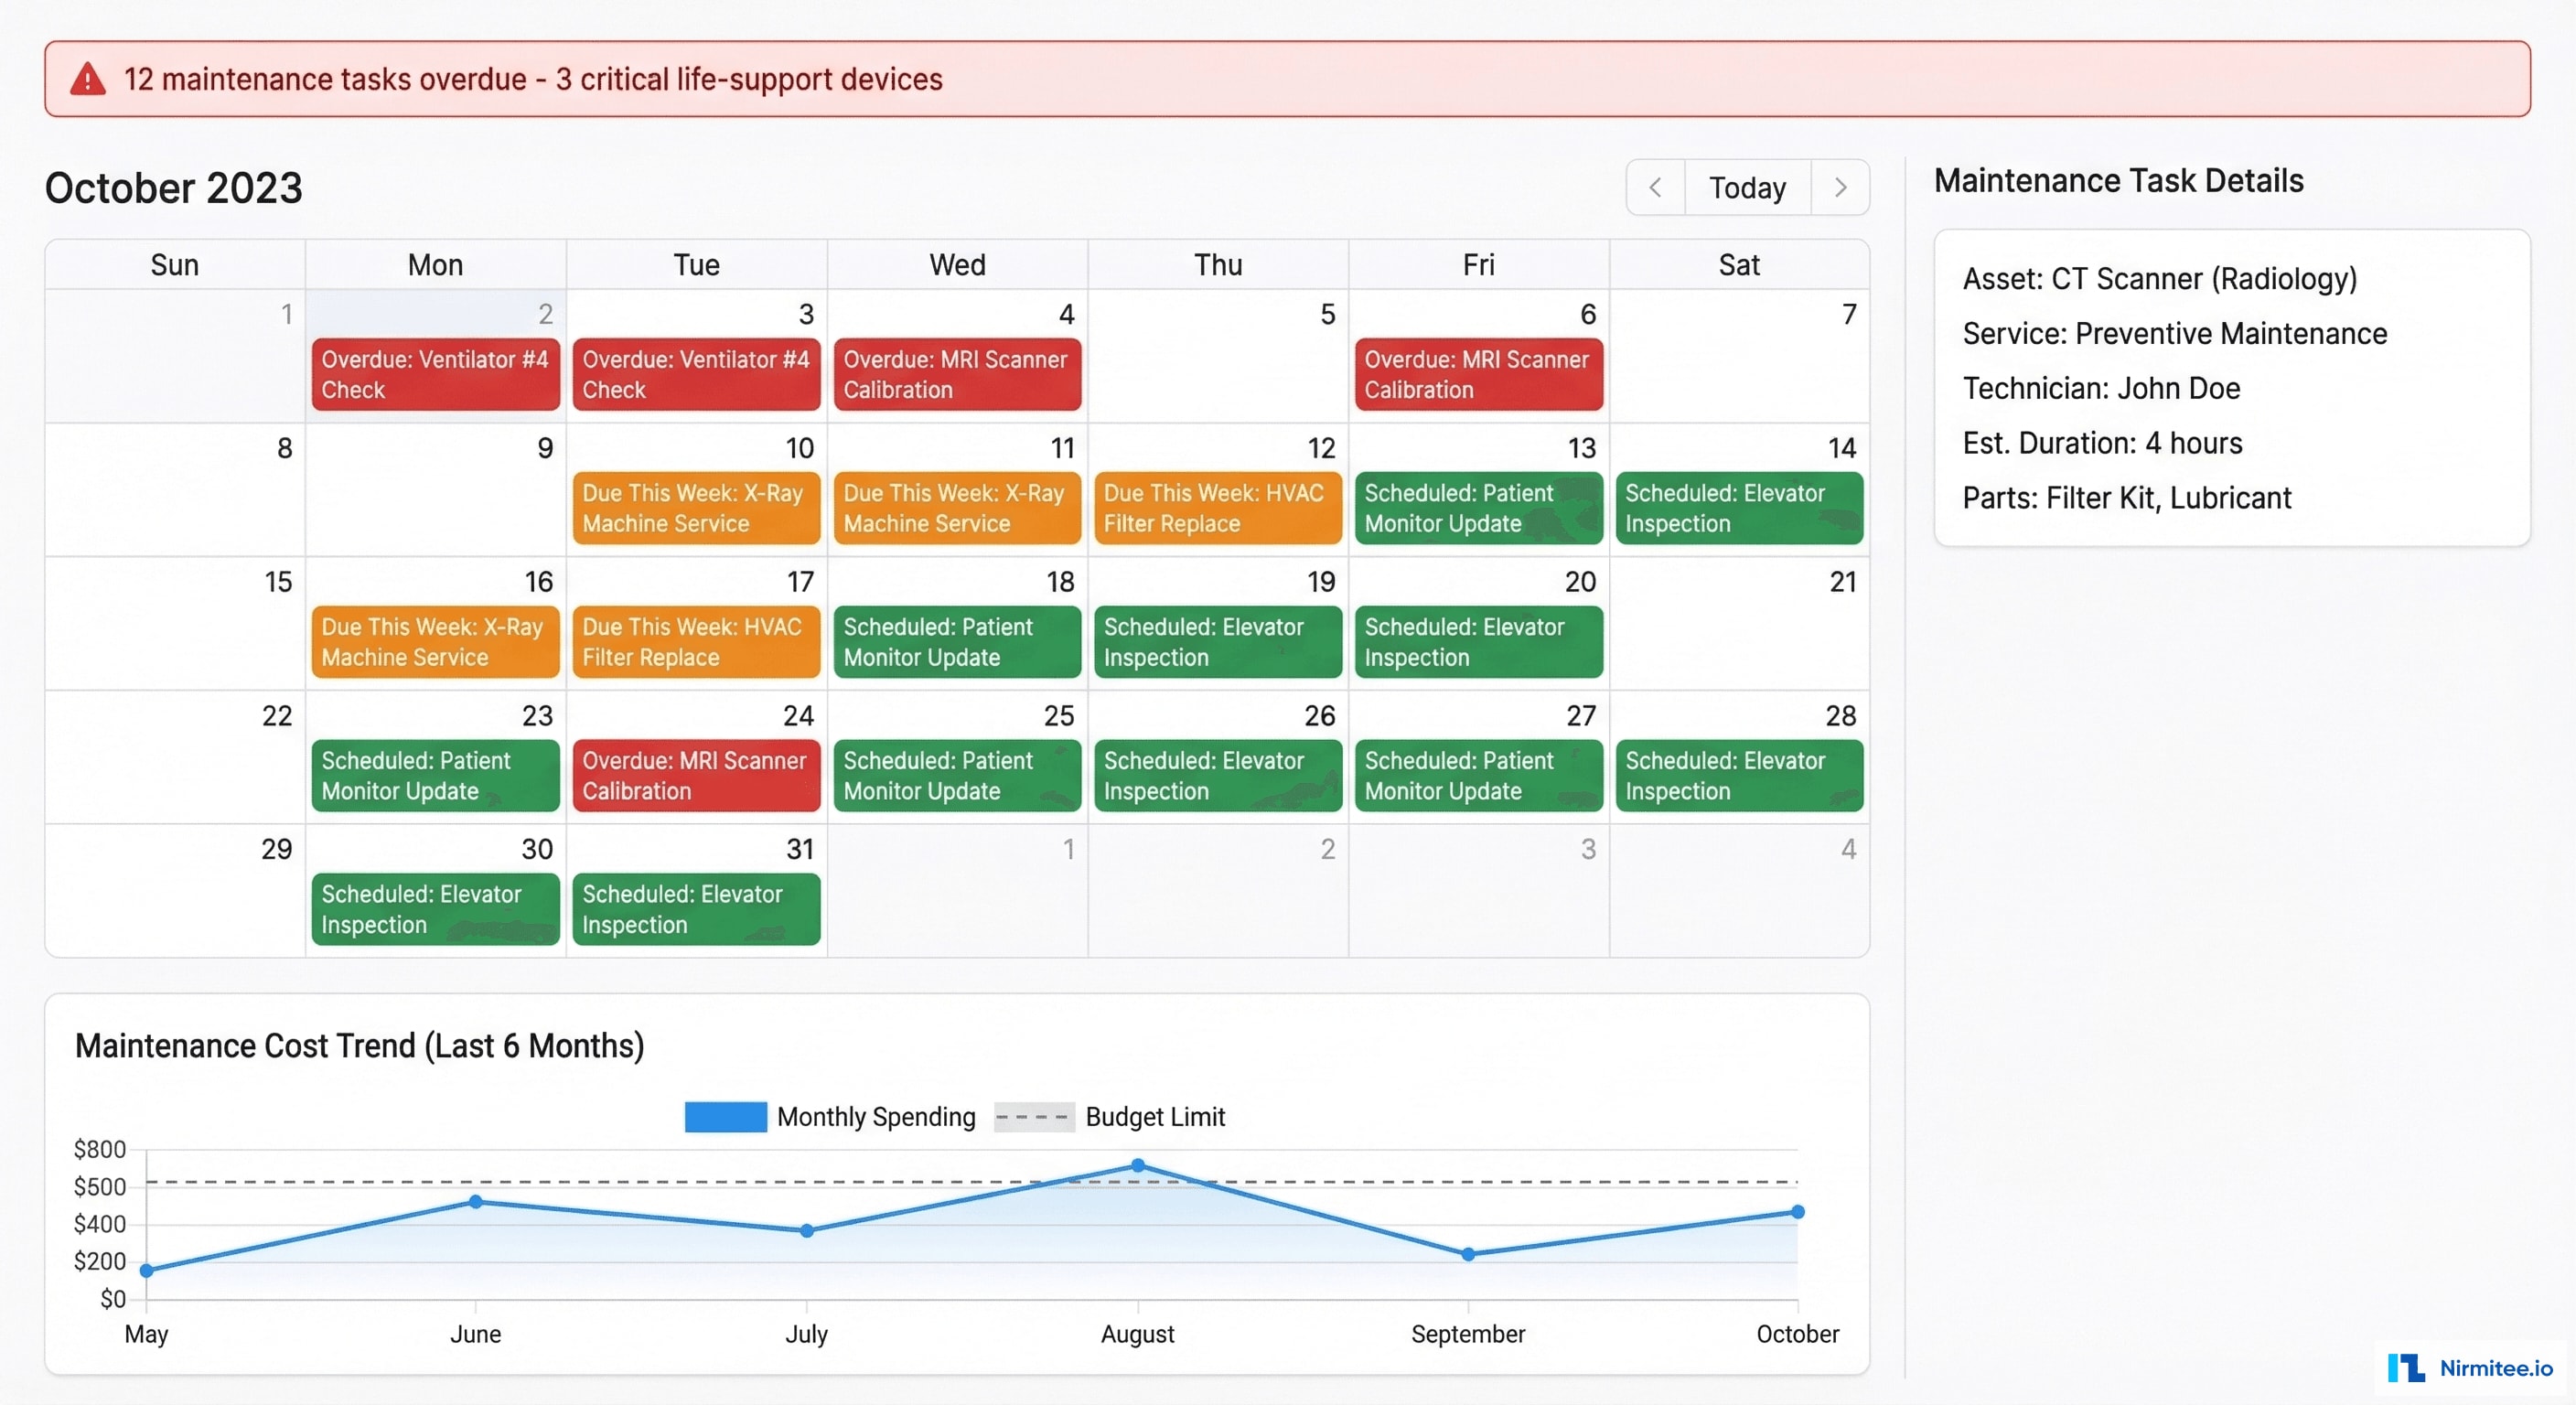
The maintenance module transforms reactive break-fix into proactive predictive maintenance:
- Automated scheduling: based on manufacturer recommendations, usage hours, and asset age — the system generates maintenance tasks automatically
- Urgency color-coding: red (overdue), orange (due this week), green (scheduled future) — the team always knows what's most critical
- Critical device alerts: life-support devices (ventilators, cardiac monitors, defibrillators) get priority escalation — overdue maintenance triggers immediate alerts to department head and biomedical engineering
- Cost tracking: every maintenance event records labor, parts, and downtime cost — feeding into the CFO dashboard's maintenance spend analysis
- Vendor management: tracks AMC (Annual Maintenance Contract) status, warranty expiration, and vendor response times
Results and Impact
| Metric | Before | After | Impact |
|---|---|---|---|
| Asset visibility | Paper registers, no real-time data | 100% real-time tracking | Complete visibility |
| Missing equipment detected | ₹0 (unknown losses) | ₹15 lakh found in first audit | Immediate ROI |
| Stock audit time | 2-3 weeks (manual, per department) | 2-3 days (automated matching) | 85% faster |
| Duplicate procurement | ~₹12 lakh/year estimated | Near zero (utilization data prevents it) | ₹12L/year saved |
| Equipment downtime | Reactive (fail → fix) | Predictive (fix before fail) | 40% reduction in unplanned downtime |
| Depreciation accuracy | Spreadsheet estimates, 6-month lag | Auto-calculated, real-time | Accurate financial reporting |
| Insurance claim processing | 4-6 weeks (manual evidence) | 2-3 days (automated documentation) | 90% faster claims |
| Asset utilization rate | Unknown | 78% average (with department-level visibility) | Data-driven redistribution |
Financial Impact (Year 1)
- Missing equipment recovered: ₹15 lakh (first audit finding)
- Duplicate procurement avoided: ₹12 lakh (departments now check availability before ordering)
- Maintenance cost reduction: ₹8 lakh (predictive maintenance reduces emergency repairs)
- Insurance processing savings: ₹3 lakh (faster claims, better documentation)
- Total Year 1 savings: ₹38 lakh
- Platform implementation cost: ₹22 lakh
- Year 1 ROI: 1.7x — paid for itself and then some
Project Timeline
| Phase | Duration | Deliverables |
|---|---|---|
| Phase 1: Foundation | 6 weeks | Asset database schema, barcode labeling system, mobile scanning app, basic dashboard |
| Phase 2: Physical Tagging | 4 weeks | Tag all 12,847 assets across 500 beds. Department-by-department rollout with staff training |
| Phase 3: Intelligence | 6 weeks | CFO financial dashboard, stock audit workflow, location tracking, maintenance scheduling |
| Phase 4: Integration | 4 weeks | ERP integration, financial system sync, RFID reader installation, alert configuration, first full audit |
Total: 5 months from kickoff to first full stock audit. Team of 3 engineers + 1 field coordinator for physical tagging.
Technical Challenges
Challenge 1: Tagging 12,847 Assets
Every single medical device — from ₹12 lakh ventilators to ₹500 wheelchairs — needed a unique, durable barcode tag. Tags had to survive autoclave sterilization, chemical disinfection, and daily handling.
Solution: Used polyester asset labels rated for autoclave (134°C) and chemical resistance. Each tag linked to a unique asset ID in the system. A field coordinator worked department-by-department, photographing and tagging each device with staff present for identification.
Challenge 2: Staff Adoption
Hospital staff — nurses, technicians, biomedical engineers — were accustomed to paper registers. Scanning devices with every transfer felt like extra work.
Solution: Made the mobile app dead simple — open, point, scan, done. Under 5 seconds per scan. Gamified compliance with department leaderboards showing scan rates. Within 8 weeks, daily scan compliance reached 92%.
Challenge 3: Network Coverage
Not all hospital areas had reliable WiFi — basements, storage rooms, old building wings. Scans needed to work offline.
Solution: Mobile app works fully offline. Scans are stored locally and synced when connectivity returns. The app queues up to 500 scans offline with GPS/department tagging for location context.
Lessons Learned
- The first audit is the hook. When hospital leadership saw ₹15 lakh in missing nebulizers, every subsequent budget request for the platform was approved instantly. Start with a stock audit — the findings sell the project.
- CFO dashboards drive executive support. The biomedical team wanted equipment tracking. The CFO wanted financial visibility. Building both in one platform ensured C-suite support.
- Physical tagging is the bottleneck. Software was built in weeks. Tagging 12,847 devices took 4 weeks with a dedicated field coordinator. Plan for this — it's the critical path.
- Maintenance compliance saves lives. Within 3 months, we caught 4 life-support devices with overdue maintenance that were still in active patient use. Predictive maintenance isn't just about cost savings — it's patient safety.
Share
Related Case Studies
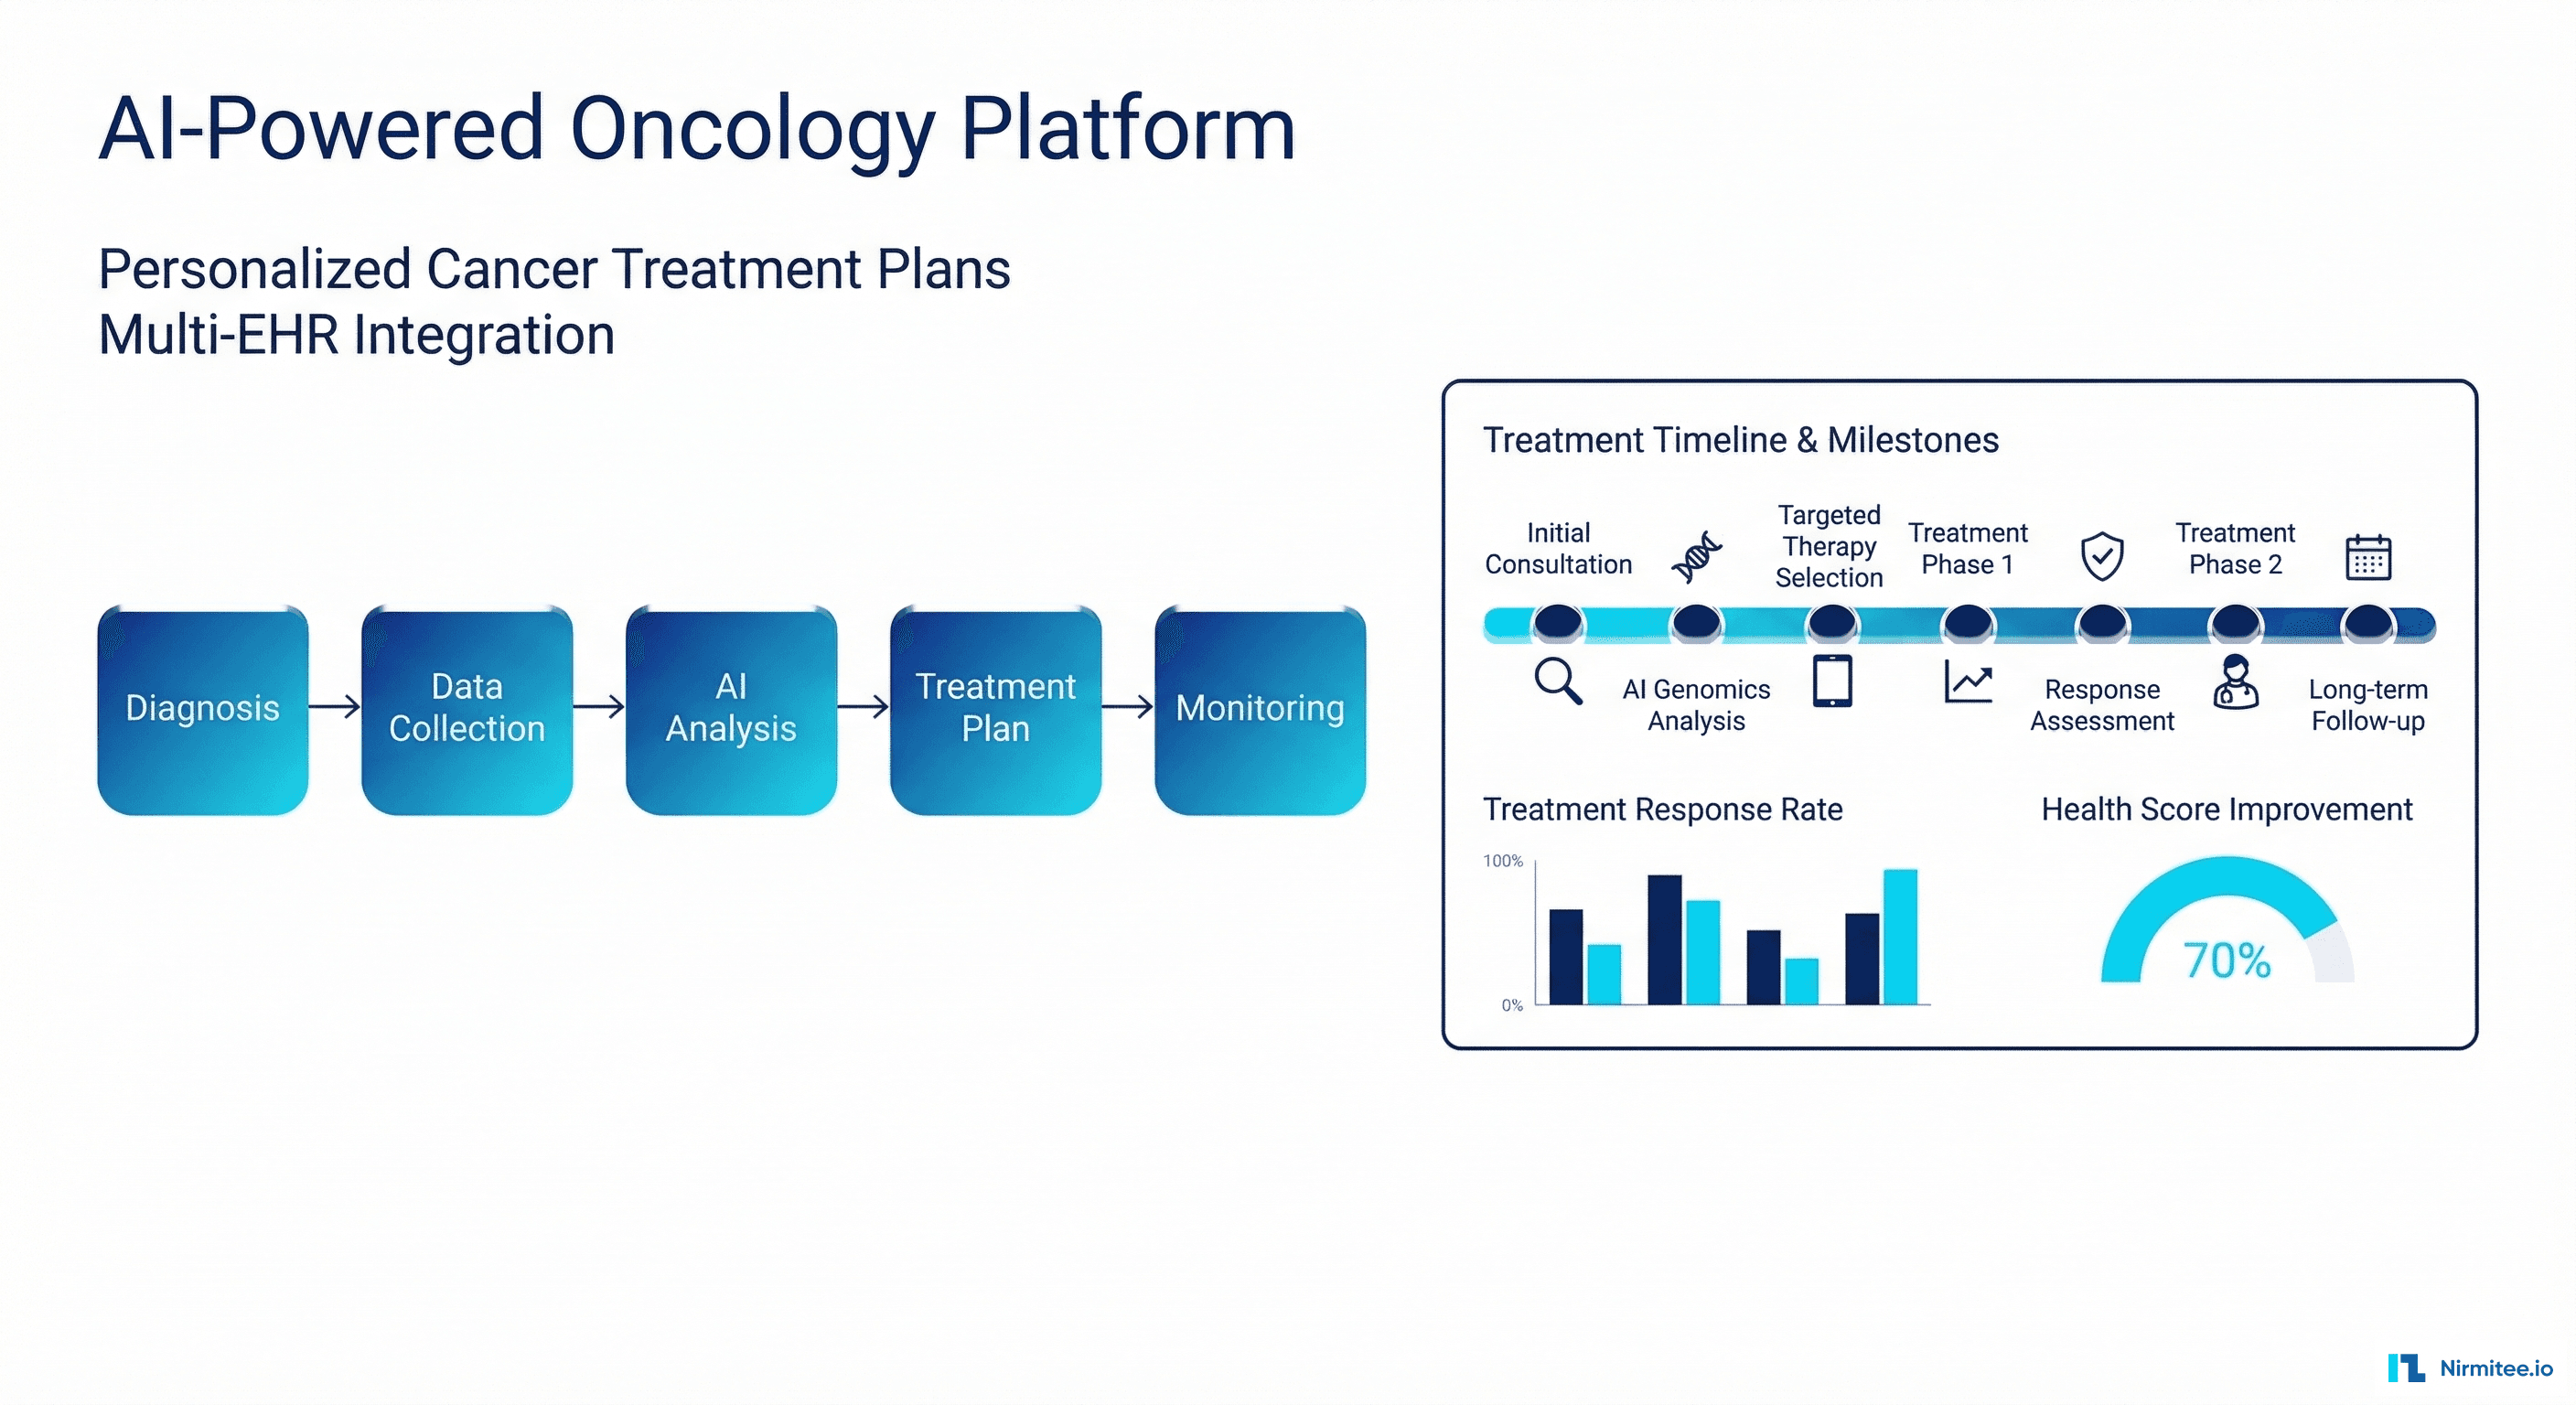
AI-Powered Personalized Oncology Treatment Platform: A Technical Case Study
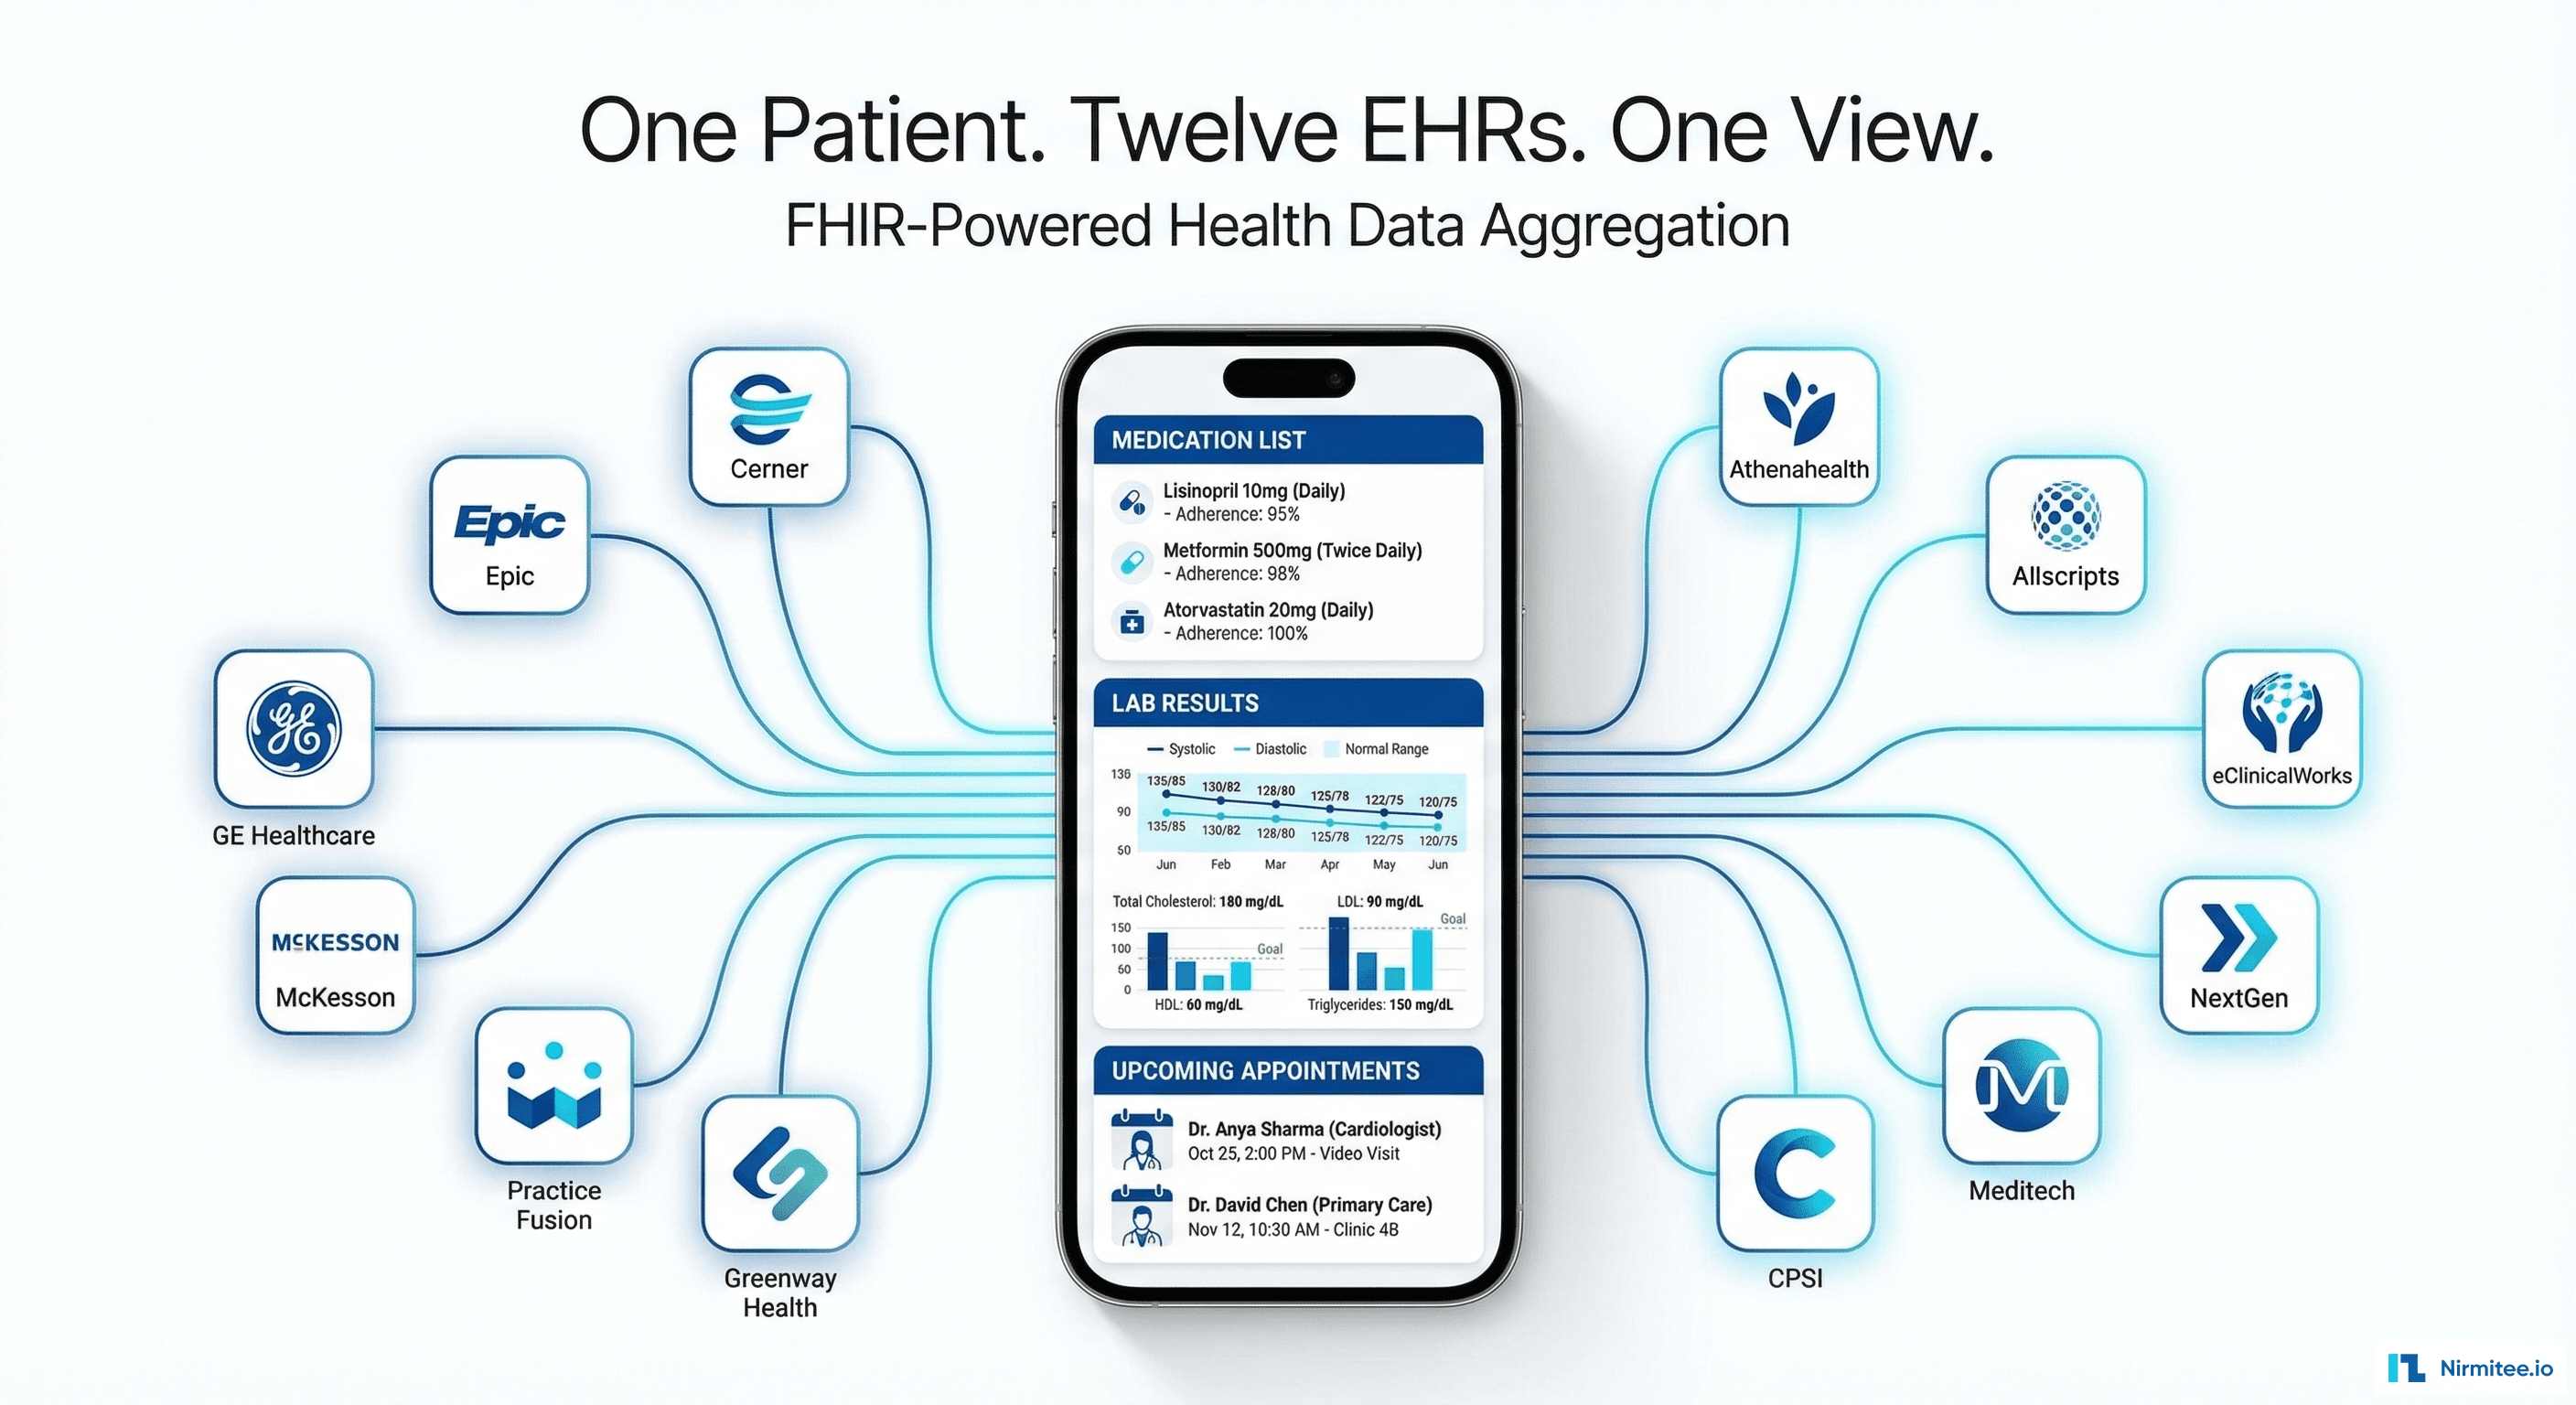
Building a Patient-First Health Record Platform: Connecting 12 US EMRs Into One View