Medical Equipment Rental & Lifecycle Management Platform: 92% Utilization, $890K Revenue Increase
Executive Summary
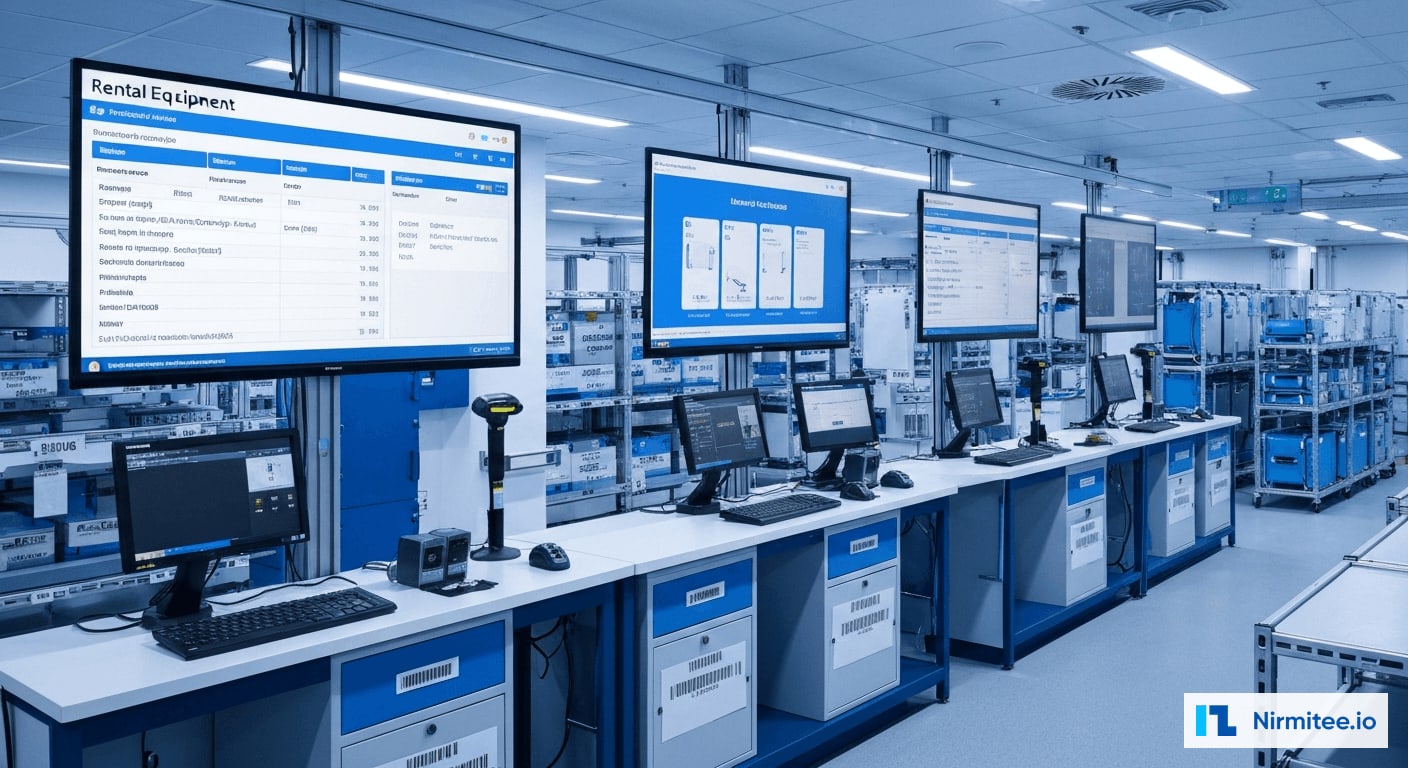
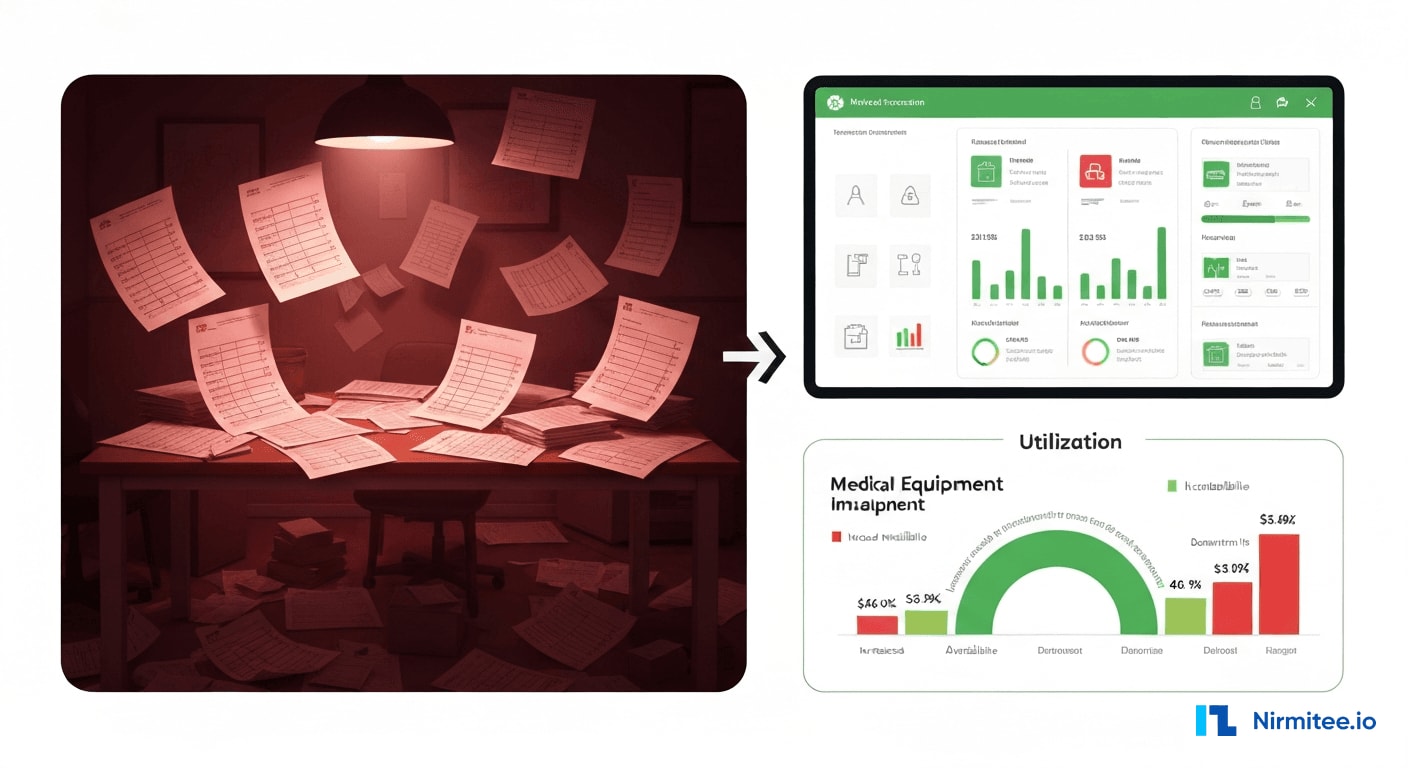
A regional durable medical equipment (DME) company managing 5,000+ rental devices across 50 healthcare facilities was operating on spreadsheets, whiteboards, and institutional memory. Equipment utilization sat at 64% — meaning more than a third of their $12M rental fleet was sitting idle at any given time. Maintenance schedules were tracked on paper, leading to missed preventive maintenance, emergency repairs, and compliance gaps that put their Medicare accreditation at risk.
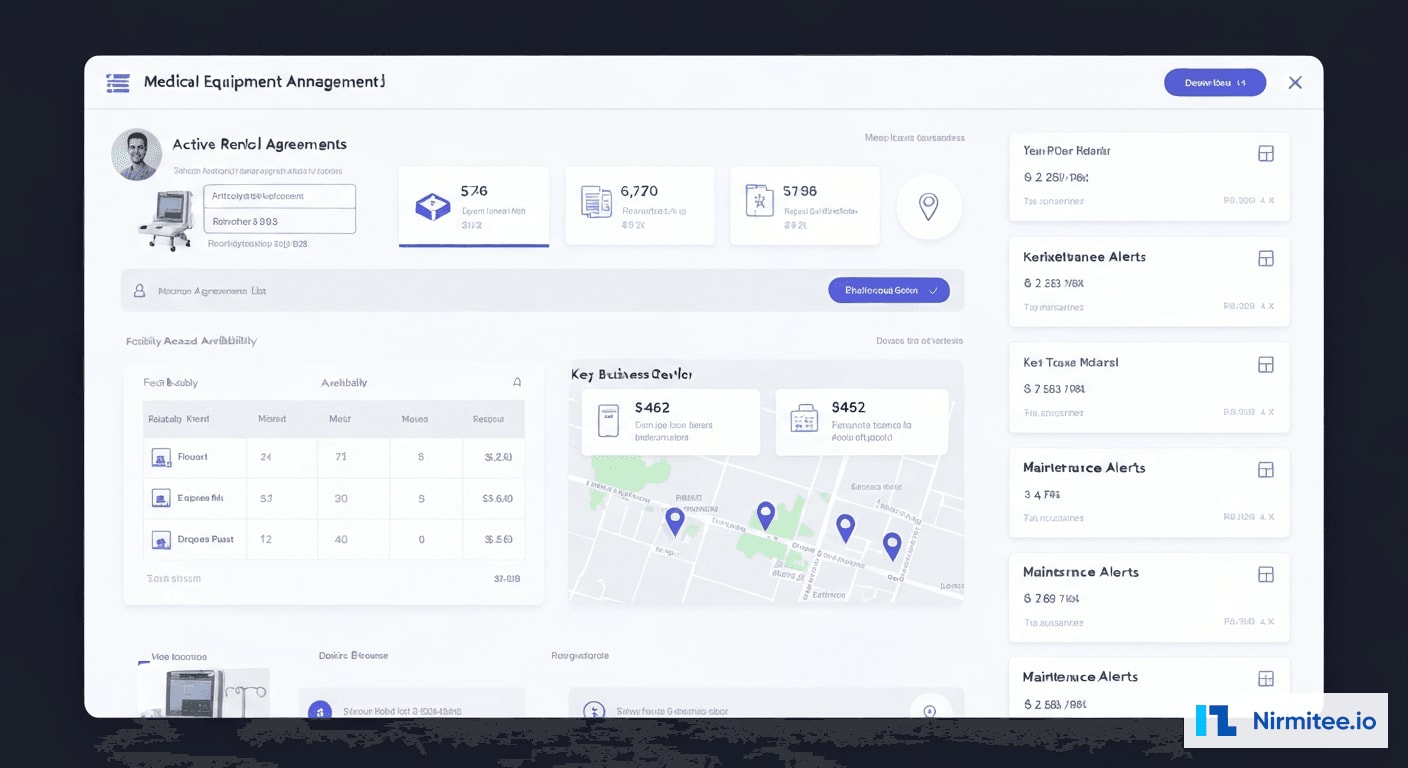
Nirmitee built a comprehensive equipment lifecycle management platform covering rental agreement management, real-time asset tracking, predictive maintenance scheduling, utilization analytics, integrated billing, and compliance documentation. The system replaced 14 separate spreadsheets, 3 paper-based processes, and 2 legacy desktop applications with a unified platform accessible across all 50 facilities.
Results: 92% utilization rate (up from 64%), $890K/year revenue increase from optimized fleet allocation and reduced idle time, and zero compliance violations across three consecutive Joint Commission surveys — after having 4 findings in the previous survey.
The Problem: A $12M Fleet Managed on Spreadsheets
The DME company had grown from a single-facility operation to a 50-facility network over 8 years, but its equipment management processes had not scaled. What worked for 200 devices at 3 facilities created chaos at 5,000+ devices across 50 locations spanning 4 states.
Operational Pain Points
| Problem Area | Impact | Root Cause |
|---|---|---|
| Equipment Utilization | 64% utilization ($4.3M idle assets) | No visibility into demand across facilities |
| Maintenance Compliance | 4 Joint Commission findings | Paper-based PM schedules, no automated reminders |
| Rental Agreement Tracking | $127K in unbilled rental days/year | Manual tracking in spreadsheets, missed renewals |
| Device Location | Average 4.2 hours to locate a device | No centralized tracking, phone-based location queries |
| Billing Accuracy | 8.3% billing error rate | Manual invoice generation from spreadsheet data |
| Compliance Documentation | 23% of devices missing current calibration records | Paper certificates filed by facility, no central repository |
The Cost of Spreadsheet Management
We conducted a detailed operational audit over 3 weeks, shadowing equipment coordinators, maintenance technicians, and billing staff across 8 representative facilities. The findings were striking:
- Equipment coordinators spent 3.5 hours/day on the phone trying to locate available equipment at other facilities when their location was short. A ventilator needed at Facility A might be sitting unused at Facility B 30 miles away, but nobody knew because availability was tracked locally on whiteboards.
- Maintenance technicians carried paper checklists that were often out of date. One technician showed us a checklist for a device model that had been retired 2 years ago. The absence of a centralized, version-controlled maintenance protocol meant each facility maintained its own procedures, creating inconsistency and compliance risk.
- Billing staff reconciled rental agreements against spreadsheets monthly. Each facility maintained its own spreadsheet with different formats, different column names, and different update frequencies. The monthly reconciliation process took 5 billing staff a combined 120 hours — and still resulted in an 8.3% error rate.
- Compliance documentation was scattered across filing cabinets at 50 facilities. When Joint Commission surveyors requested calibration certificates for a specific device, staff sometimes spent 30+ minutes locating the paper record — and occasionally could not find it at all.
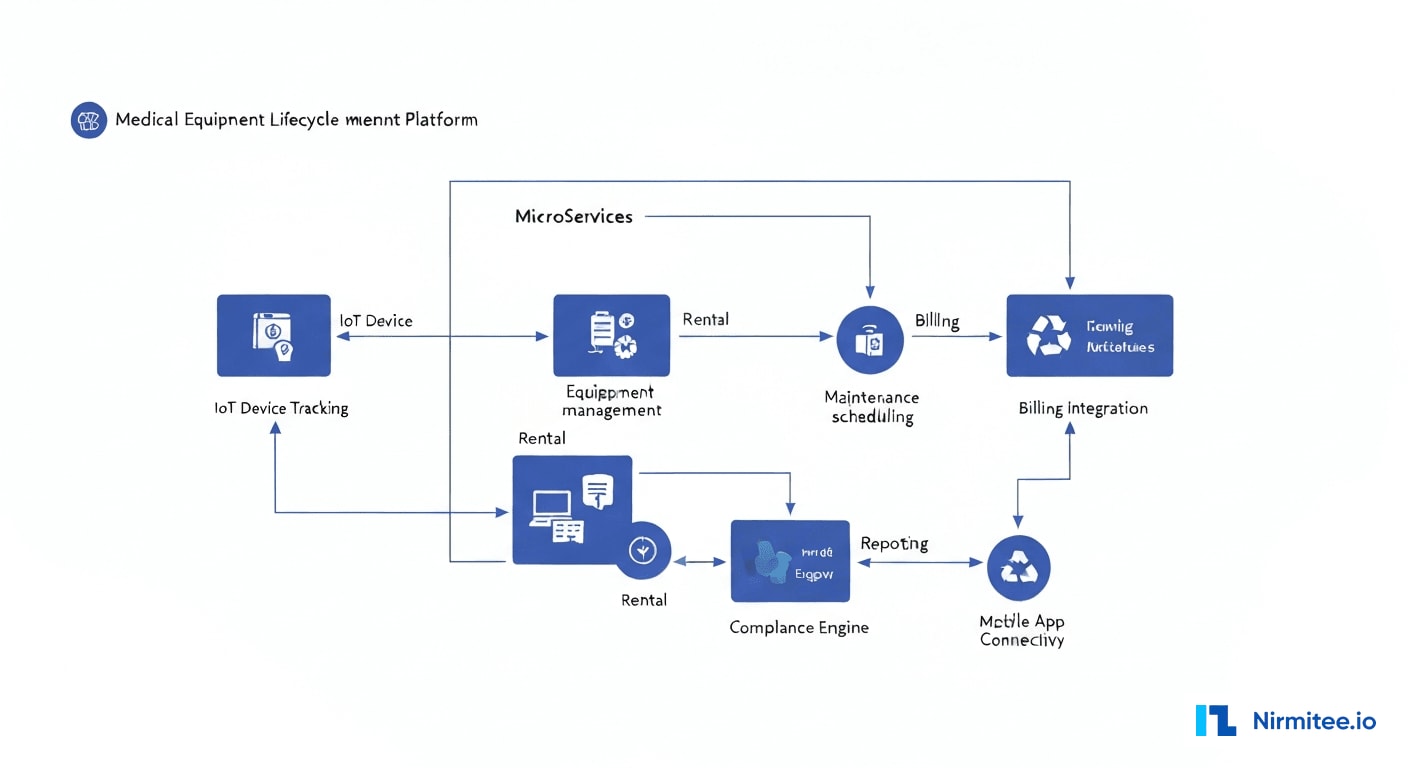
The Solution: Unified Equipment Lifecycle Platform
We designed the platform around five core modules, each addressing a specific operational pain point while sharing a common data model and real-time synchronization layer.
Module 1: Equipment Catalog and Asset Registry
The foundation of the platform is a comprehensive asset registry containing every device in the fleet — serialized, categorized, geolocated, and linked to its complete lifecycle history.
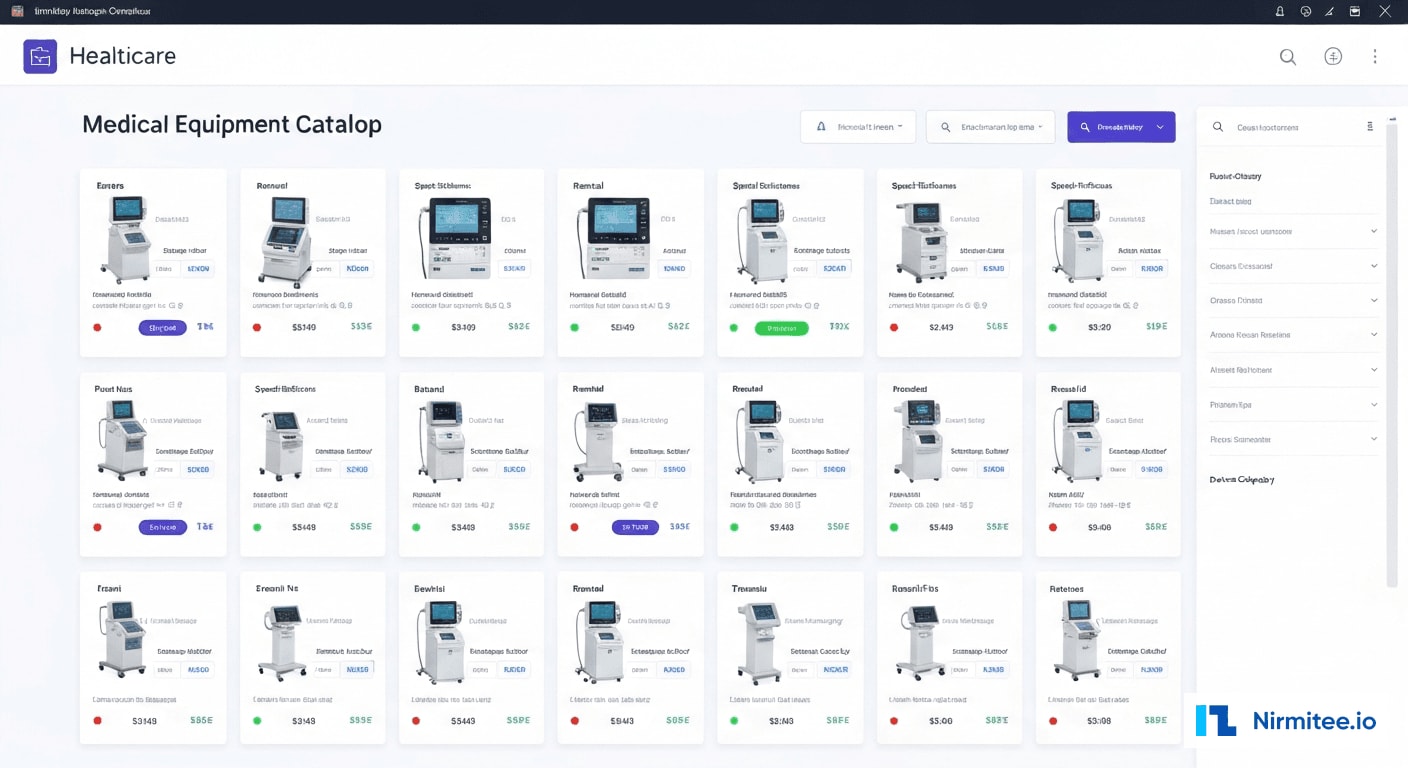
Each device record includes:
- Identity: Serial number, model, manufacturer, asset tag, barcode/QR code
- Classification: FDA device class, HCPCS billing code, equipment category, risk level
- Location: Current facility, department, room (updated via barcode scan or IoT beacon)
- Status: Available, rented, in-maintenance, in-transit, retired, recalled
- Financial: Purchase price, depreciation schedule, current book value, rental rate tiers
- Lifecycle: Purchase date, warranty expiration, expected end-of-life, total rental revenue generated
- Compliance: Calibration status, next PM due date, inspection history, recall notices
The catalog supports bulk import from manufacturer databases, barcode scanning for field updates, and API integration with procurement systems for automatic registration of new acquisitions.
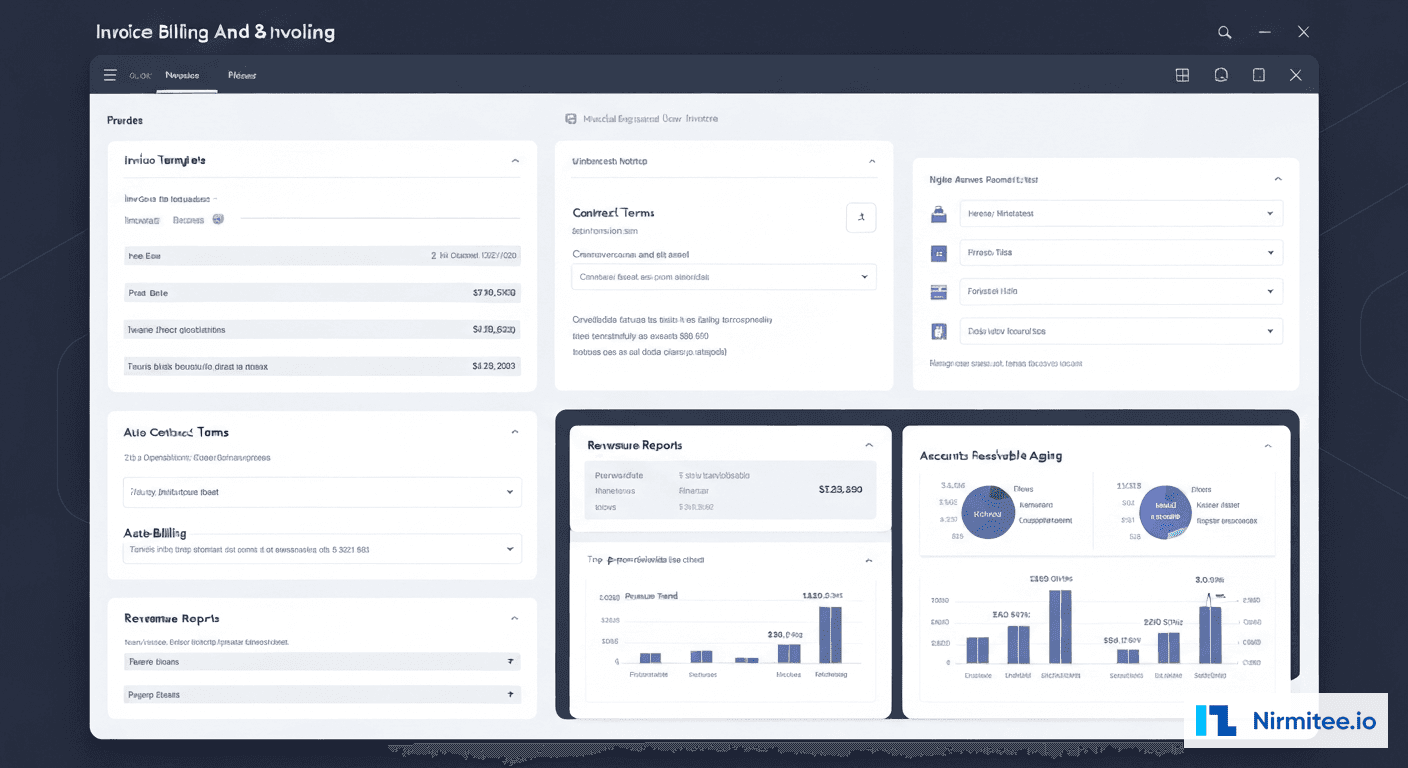
Module 2: Rental Agreement Management
The rental module manages the complete agreement lifecycle from initial order through delivery, rental period, billing, pickup, and cleaning/refurbishment for the next rental. Key capabilities include:
- Agreement Creation: Configurable templates by equipment type, facility, and payer. Supports daily, weekly, monthly, and long-term rental structures with automatic rate tier adjustments.
- Delivery Scheduling: Integrated logistics planning with route optimization, delivery confirmation via mobile app, and patient/facility signature capture.
- Automatic Renewals and Extensions: Agreements approaching expiration trigger automated renewal workflows. Staff receive 7-day, 3-day, and same-day reminders. If no action is taken, the system can auto-extend based on configurable rules.
- Pickup and Return Processing: Return workflows include device inspection checklists, cleaning/sanitization verification, and condition documentation (with photos) to track damage and wear.
Module 3: Predictive Maintenance Scheduling
The maintenance module replaced paper-based PM schedules with an automated, compliance-driven maintenance management system.
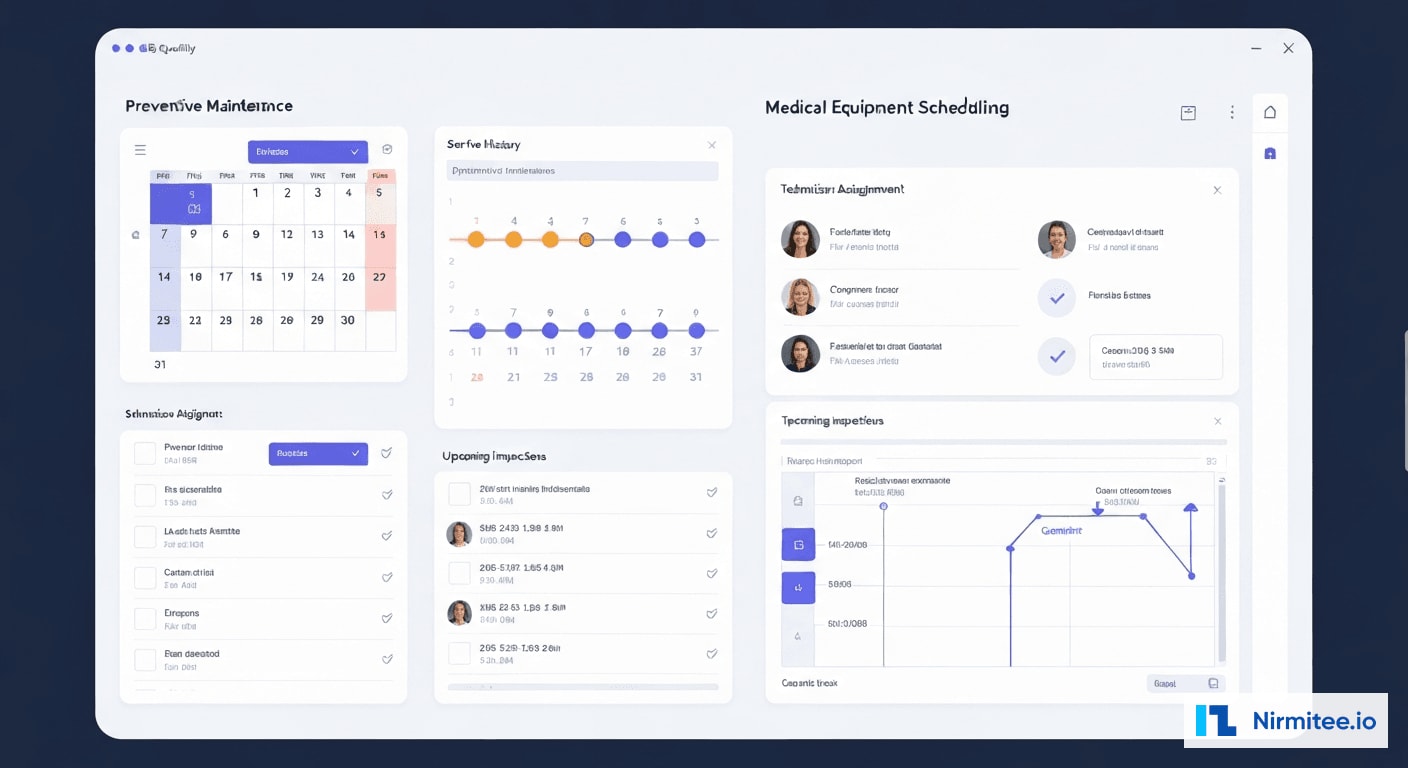
The system manages three types of maintenance:
- Preventive Maintenance (PM): Manufacturer-recommended maintenance intervals are configured per device model. The system automatically generates PM work orders based on calendar time or usage hours (from IoT-connected devices). PM compliance rate improved from 71% to 99.2%.
- Corrective Maintenance: When a device fails or a user reports a problem, a corrective maintenance work order is created with automated parts ordering, technician dispatch, and downtime tracking.
- Predictive Maintenance: For IoT-connected devices (ventilators, infusion pumps, patient monitors), the platform analyzes sensor data — motor current, temperature, vibration patterns, error codes — to predict failures before they occur. This reduced unplanned downtime by 34%.
Every maintenance event is documented with before/after photos, parts used, technician notes, and time stamps — creating the compliance documentation trail that Joint Commission surveyors require.
Module 4: Utilization Analytics and Fleet Optimization
This module is the revenue engine of the platform. By providing real-time visibility into utilization across all 50 facilities, it enables data-driven decisions about fleet allocation, procurement, and retirement.
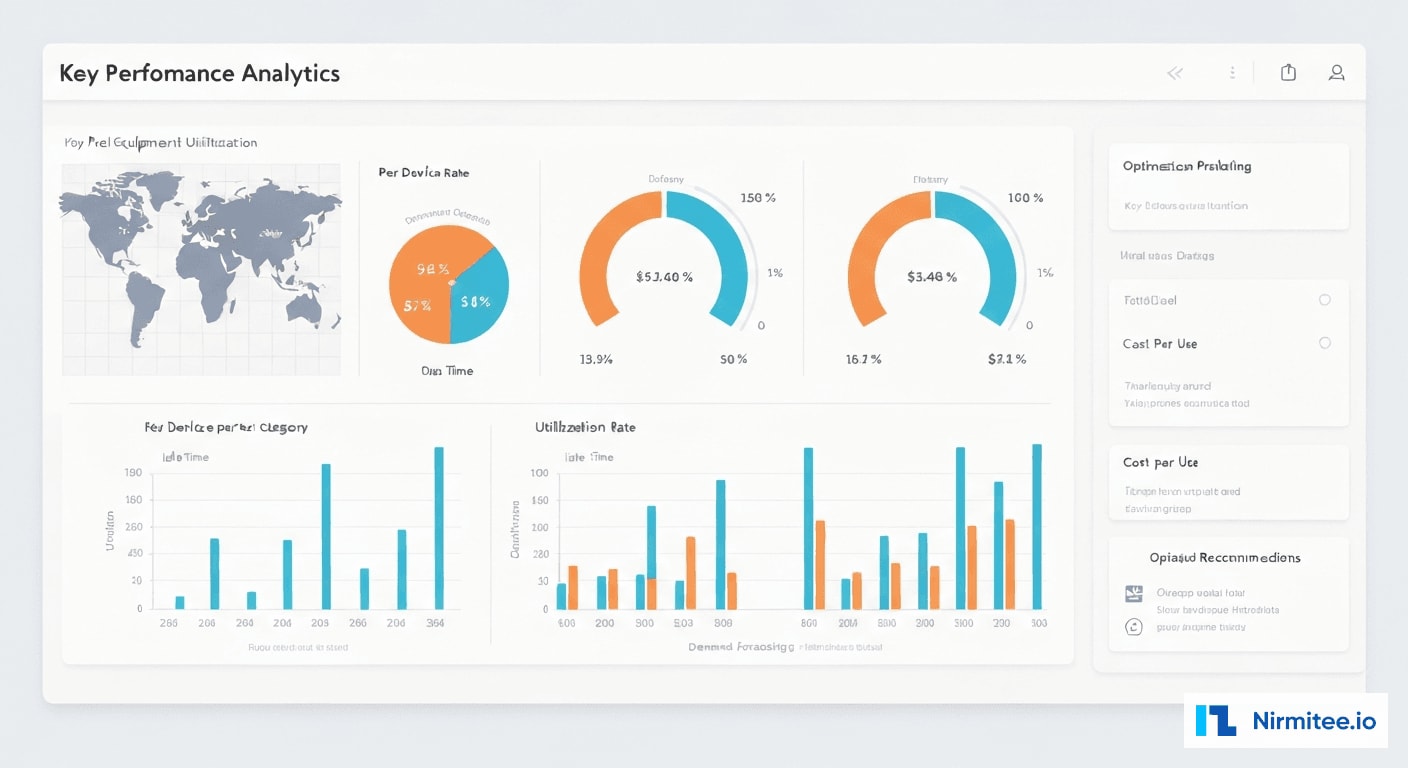
Key analytics capabilities:
- Utilization Heat Maps: Visualize utilization rates by facility, device category, and time period. Immediately identifies which facilities have surplus equipment and which are underserved.
- Demand Forecasting: ML model trained on 3 years of rental data predicts demand by device category, facility, and season. Seasonal patterns (respiratory equipment demand spikes in winter) drive proactive fleet redistribution.
- Cross-Facility Rebalancing: When a facility's demand exceeds local inventory, the system automatically identifies the nearest facility with available equipment and initiates a transfer request. This reduced external rental costs (renting from competitors) by 78%.
- End-of-Life Planning: Tracks total maintenance cost vs. rental revenue per device. When a device's maintenance cost ratio exceeds 40% of replacement cost, it is flagged for retirement review. This prevented $230K in maintenance spending on devices that should have been retired.
Module 5: Billing Integration and Revenue Management
The billing module automates the entire revenue cycle for equipment rentals:
- Automated Invoice Generation: Invoices are generated automatically based on rental agreement terms — daily/weekly/monthly rates, delivery fees, damage charges, and cleaning fees. Zero manual data entry.
- Payer-Specific Billing: Different billing formats and requirements for Medicare, Medicaid, commercial insurance, and direct-pay patients. HCPCS code assignment is automatic based on device type and rental configuration.
- Claims Tracking: Integration with clearinghouse for electronic claims submission, denial management, and payment posting. Denial rate decreased from 12% to 3.1%.
- Revenue Analytics: Revenue per device, per facility, per category, per payer — with trend analysis and forecasting. Identifies the highest and lowest performing assets in the fleet.
System Architecture
Technology Stack
| Component | Technology | Purpose |
|---|---|---|
| Frontend | React + Material UI | Web dashboard for all modules, responsive for tablets |
| Mobile App | React Native | Field technician app, barcode scanning, delivery confirmation |
| Backend API | Node.js (NestJS) | RESTful API, business logic, workflow orchestration |
| Database | PostgreSQL + TimescaleDB | Asset registry, rental agreements, IoT time-series data |
| IoT Platform | AWS IoT Core + MQTT | Device telemetry ingestion, real-time monitoring |
| Search | Elasticsearch | Equipment catalog search, cross-facility inventory lookup |
| Billing Integration | Custom + Availity (clearinghouse) | Claims submission, payment posting, denial management |
| Document Storage | AWS S3 + CloudFront | Compliance documents, maintenance photos, certificates |
| Notifications | SendGrid + Twilio + Push | PM reminders, agreement expiration alerts, delivery updates |
| Infrastructure | AWS (ECS, RDS, ElastiCache) | HIPAA-compliant cloud hosting, auto-scaling |
Integration Points
The platform integrates with 7 external systems:
- EHR Systems (Epic, Cerner): Patient demographics and orders via FHIR R4 for automatic rental initiation from physician orders.
- Procurement (SAP): New device purchases automatically create asset registry entries with complete manufacturer data.
- Billing Clearinghouse (Availity): Electronic claims submission and payment reconciliation for all payer types.
- Logistics (Fleet Management): Delivery vehicle tracking and route optimization for equipment deliveries and pickups.
- IoT Device Gateway: MQTT-based telemetry from connected devices for predictive maintenance and utilization tracking.
- Manufacturer Portals: Automated recall notice ingestion and firmware update tracking for all managed device models.
- Compliance Systems: GUDID (FDA device registry) integration for regulatory data and UDI tracking.
Compliance and Documentation
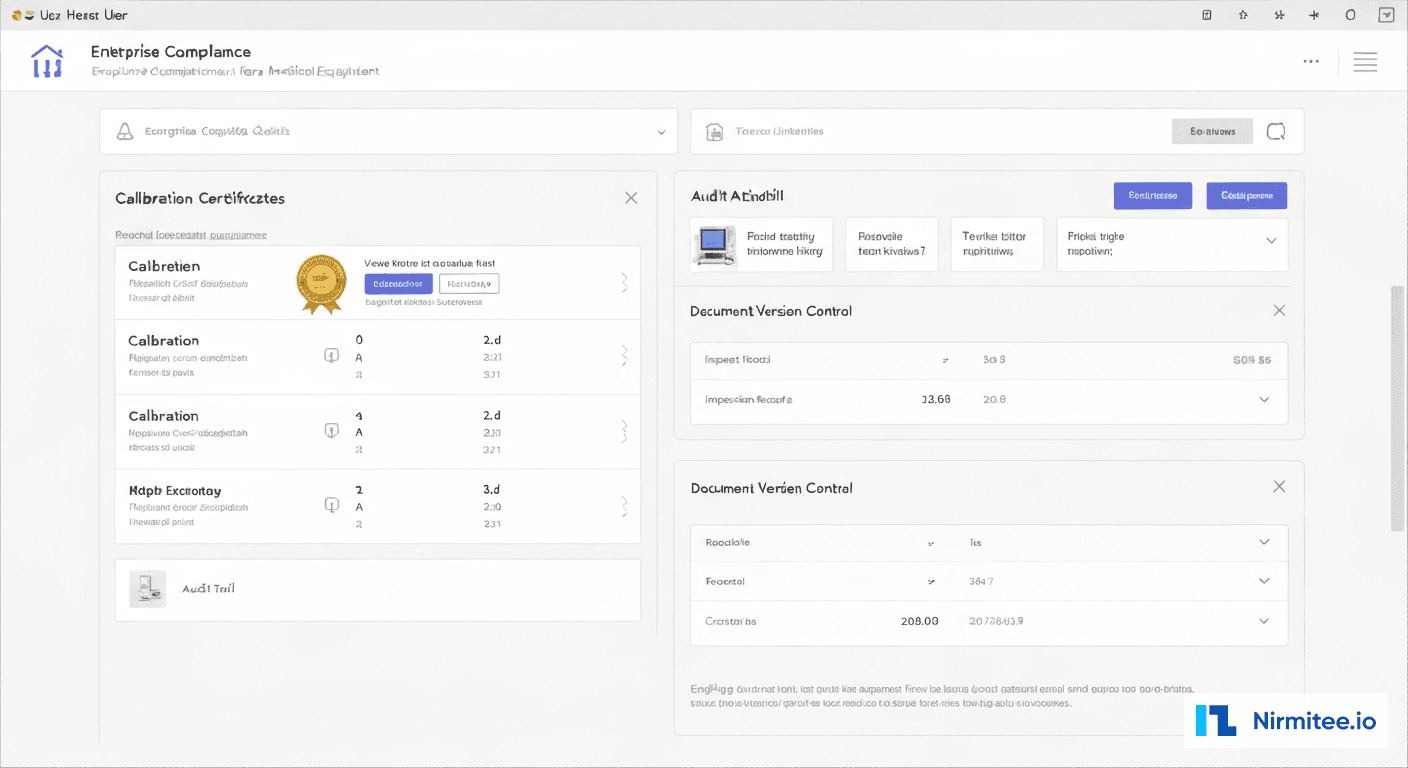
The compliance module was designed specifically to meet Joint Commission, CMS, and state regulatory requirements for medical equipment management. Every compliance event is digitally documented, time-stamped, and linked to the specific device, technician, and facility.
- Calibration Tracking: Every device requiring calibration has a defined schedule. The system generates calibration work orders automatically, tracks completion, stores calibration certificates digitally, and flags overdue calibrations before they become compliance violations.
- Recall Management: FDA recall notices are ingested automatically. When a recall affects a device in the fleet, the system immediately identifies every affected unit, its current location, and its rental status — enabling rapid response.
- Audit-Ready Reports: One-click generation of compliance reports showing PM completion rates, calibration status, recall response times, and device condition history. During the most recent Joint Commission survey, the surveyor was provided with a real-time dashboard rather than paper records — a first for the organization.
Results: Transformative Operational Impact
Key Performance Metrics
| Metric | Before | After | Impact |
|---|---|---|---|
| Equipment utilization rate | 64% | 92% | 44% improvement |
| Annual rental revenue | $4.2M | $5.09M | $890K increase (21%) |
| Time to locate equipment | 4.2 hours average | 12 seconds (search) | 99.9% faster |
| Billing error rate | 8.3% | 1.2% | 86% reduction |
| PM compliance rate | 71% | 99.2% | 40% improvement |
| Unbilled rental days/year | $127K lost | $8K lost | 94% recovery |
| Unplanned device downtime | 340 hours/month | 224 hours/month | 34% reduction |
| Joint Commission findings | 4 findings | 0 findings | 100% compliance |
| External rental costs | $412K/year | $91K/year | 78% reduction |
| Claims denial rate | 12% | 3.1% | 74% reduction |
Financial Impact Summary
| Category | Annual Value |
|---|---|
| Increased rental revenue (utilization improvement) | $890,000 |
| Recovered unbilled rental days | $119,000 |
| Reduced external rental costs | $321,000 |
| Reduced maintenance costs (predictive vs. reactive) | $147,000 |
| Billing error reduction (reduced denials/rework) | $94,000 |
| Staff time savings (automation vs. spreadsheets) | $186,000 |
| Total annual benefit | $1,757,000 |
| Platform implementation cost | ($680,000) |
| Annual operating cost | ($140,000) |
| Year 1 net benefit | $937,000 |
Implementation Timeline
| Phase | Duration | Key Deliverables |
|---|---|---|
| Discovery & Asset Audit | Weeks 1-4 | Physical inventory of all 5,000+ devices, data model design, process mapping |
| Core Platform & Asset Registry | Weeks 5-10 | Equipment catalog, barcode/QR system, location tracking, search |
| Rental & Agreement Management | Weeks 8-14 | Agreement workflows, delivery scheduling, renewal automation |
| Maintenance Module | Weeks 12-18 | PM scheduling, work order management, IoT integration, predictive alerts |
| Billing Integration | Weeks 16-20 | Invoice generation, clearinghouse integration, claims tracking, payer rules |
| Analytics & Optimization | Weeks 18-22 | Utilization dashboards, demand forecasting, fleet rebalancing recommendations |
| Compliance Module | Weeks 20-24 | Calibration tracking, recall management, audit-ready reports, document repository |
| Rollout & Training | Weeks 25-30 | Phased deployment to all 50 facilities, staff training, data migration, go-live |
Lessons Learned
1. Physical Inventory Is Non-Negotiable
The initial asset audit revealed that the company's spreadsheets listed 4,780 devices, but physical inventory counted 5,127. The discrepancy included devices that had been moved between facilities without updating the spreadsheet, devices that had been retired but never removed from the list, and 23 devices that nobody could locate (later found in a storage closet at a decommissioned facility). No software system can compensate for inaccurate master data. We spent 3 weeks on physical inventory before writing a line of code.
2. Barcode Scanning Adoption Requires Simplicity
The initial barcode scanning workflow required 7 taps to update a device location. Field technicians found it faster to skip the scan and make a phone call. We redesigned the mobile workflow to: scan barcode, confirm location (auto-detected via GPS), done — 2 taps. Scan compliance jumped from 34% to 91% within 2 weeks of the redesign. Every additional tap in a field workflow reduces adoption by approximately 15%.
3. Cross-Facility Rebalancing Needs Human Approval
The initial design included automatic equipment transfers between facilities. This was rejected by facility managers who felt they were losing control of their inventory. We redesigned the workflow as recommendation-based: the system identifies rebalancing opportunities and presents them with projected revenue impact, but a facility manager must approve every transfer. This increased acceptance from 12% (automated) to 83% (recommended with approval).
4. Compliance Is the Selling Point, Revenue Is the Result
When presenting the platform to facility leadership, the utilization and revenue metrics generated interest but not urgency. The compliance risk — the 4 Joint Commission findings and the threat of Medicare certification loss — created the urgency needed for executive sponsorship. In healthcare, compliance risk is a more powerful motivator than revenue opportunity. Lead with compliance, deliver revenue.
5. IoT Is Valuable but Not Required for Phase 1
Only 800 of the 5,000+ devices had IoT connectivity (primarily ventilators and infusion pumps). We designed the platform to work with manual barcode scanning for non-connected devices while supporting IoT telemetry for connected devices. Waiting for full IoT deployment would have delayed the project by 12+ months with minimal incremental value. The 80/20 rule applies: 80% of the value comes from basic asset tracking and PM scheduling, not from IoT predictive maintenance.
Frequently Asked Questions
How does the platform handle equipment across multiple state regulatory jurisdictions?
The compliance module is configured per state with jurisdiction-specific rules for equipment licensing, inspection intervals, and reporting requirements. Each of the 4 states the company operates in has different requirements for medical equipment maintenance documentation. The system maintains state-specific compliance templates and automatically applies the correct rules based on the facility's location. When a device is transferred between facilities in different states, the compliance requirements update automatically.
Can the platform integrate with our existing EHR for physician-ordered equipment?
Yes. The platform supports FHIR R4 integration with major EHR systems including Epic, Cerner (Oracle Health), and MEDITECH. When a physician places a DME order in the EHR, it flows to the platform as a rental request with patient demographics, clinical justification, and insurance information pre-populated. The equipment coordinator selects the device, schedules delivery, and the rental agreement is created automatically. This eliminates the manual re-entry of order information that previously caused 40% of billing errors.
What is the typical ROI timeline for an equipment management platform like this?
Based on this implementation, the platform achieved full ROI within 9 months of deployment. The $680K implementation cost was offset by $1.757M in annual benefits. The fastest-returning module was billing integration — reduced denials and recovered unbilled days generated $213K in the first 6 months alone. The utilization improvement required 4-6 months to materialize as cross-facility rebalancing patterns stabilized. For a fleet of 2,000+ devices, we typically see ROI within 8-12 months.
How does the predictive maintenance work for non-IoT-connected equipment?
For non-IoT devices (the majority of the fleet), predictive maintenance relies on usage-pattern analysis rather than sensor data. The system tracks rental days, number of patient-uses, maintenance history, and device age to predict failure probability. A device that has had 3 corrective maintenance events in the last 6 months, is 2 years past its typical replacement age, and has high utilization receives a proactive replacement recommendation. This statistical approach is less precise than IoT-based prediction but still reduced unplanned failures by 18% for non-connected devices.
Was this case study helpful?