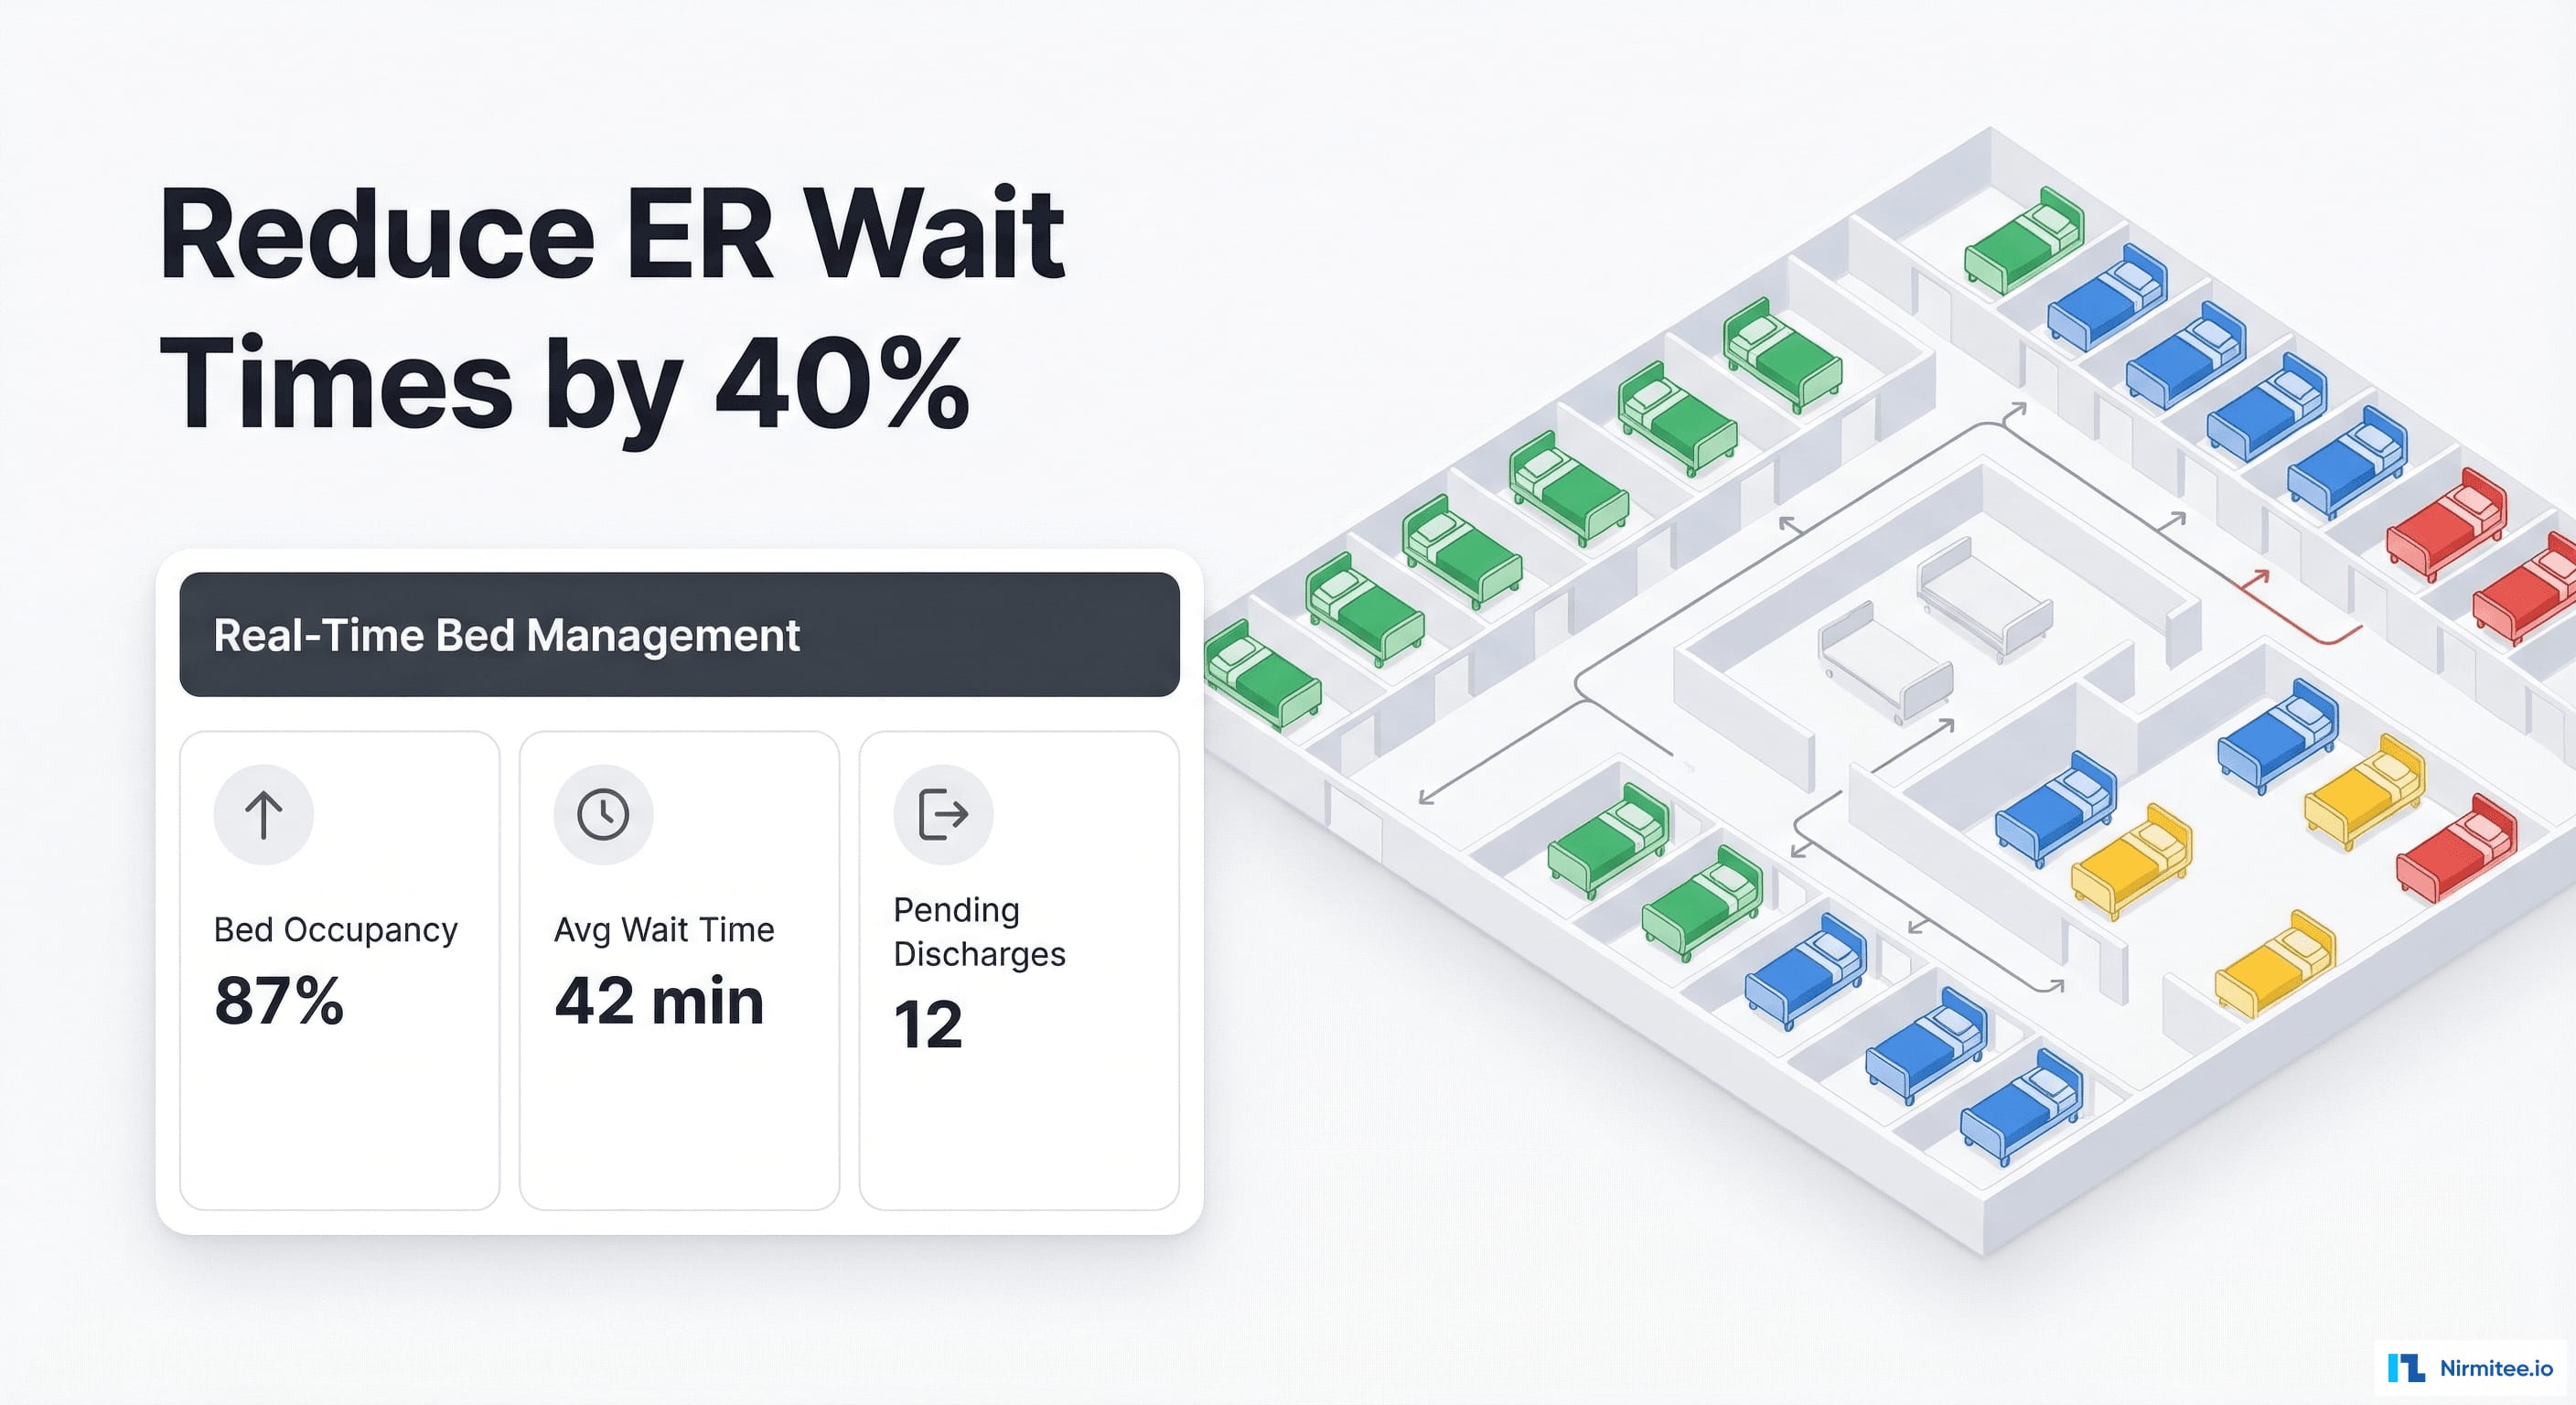
Real-Time Bed Management: How a 312-Bed Hospital Cut ER Wait Times by 40% with ML Discharge Prediction
Executive Summary
A 312-bed acute care hospital was losing patients to competing facilities — not because of care quality, but because of 4.2-hour average ER wait times. The bottleneck wasn't the ER itself; it was bed availability. Admitted patients waited hours in the ER for an inpatient bed because nobody knew in real-time which beds were available, which patients were about to discharge, or which rooms were being cleaned.
We built a real-time bed management and patient flow system — live bed status boards integrated with ADT feeds, ML-powered discharge prediction, automated housekeeping dispatch, transport coordination, and a hospital command center dashboard. All feeding from existing HL7 ADT messages — no new hardware required.
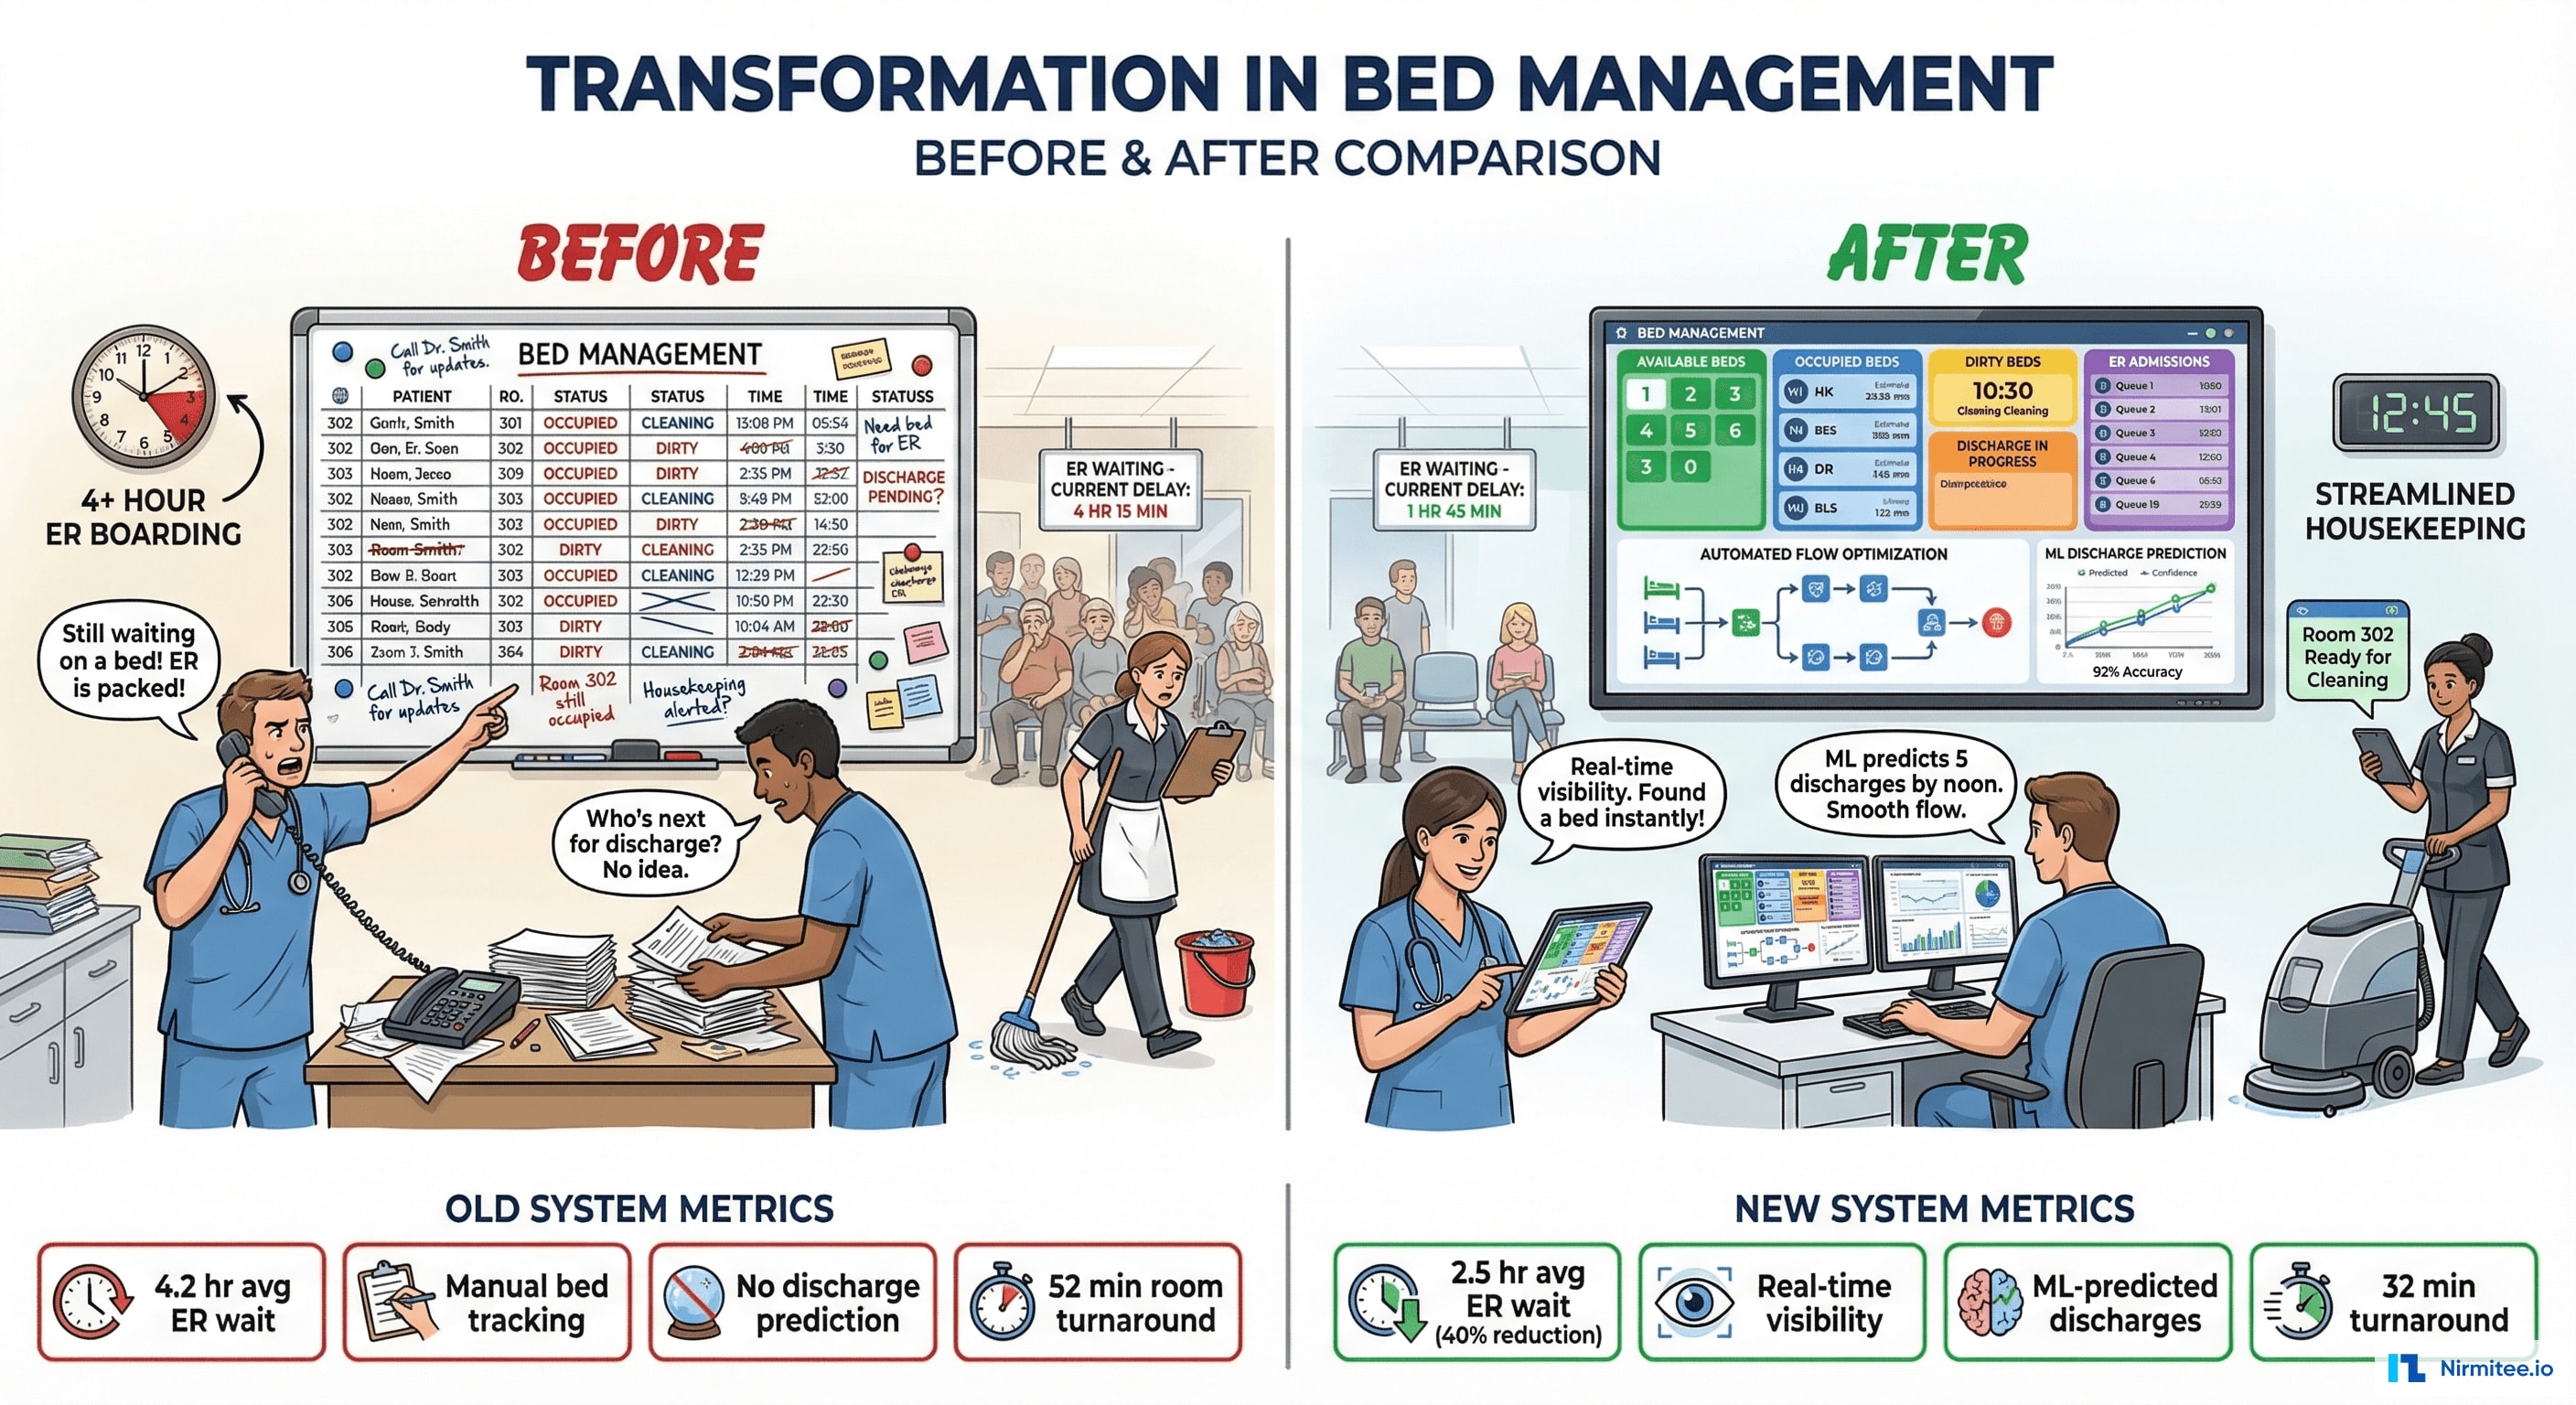
Results: ER wait time reduced from 4.2 hours to 2.5 hours (40% reduction), room turnaround from 52 minutes to 32 minutes (38% faster), and the hospital recovered an estimated $2.8M/year in previously lost admissions from patients who left the ER without being seen.
The Problem: Beds Are Available, But Nobody Knows
- Whiteboard bed tracking: bed status managed on physical whiteboards at each nursing station. Updated by hand. Often wrong — a bed shown as "occupied" was actually vacated 2 hours ago, and nobody updated the board.
- Phone tag for bed assignment: ER charge nurse calls bed management, who calls the unit, who calls housekeeping, who calls transport. A 5-minute bed assignment became a 45-minute phone tree.
- No discharge prediction: nobody knew which patients were likely to discharge today. Discharges clustered around 4 PM, creating an afternoon bed crunch while morning beds sat empty.
- Housekeeping delays: EVS (Environmental Services) wasn't notified of discharges until someone thought to call them. Average room turnaround: 52 minutes — half of which was wait time for notification.
- LWBS (Left Without Being Seen): 8.7% of ER patients left before being seen due to long waits. At $3,200 average revenue per admission, this was $2.8M/year in lost revenue.
Live Bed Status Map

The bed board replaces whiteboards with a real-time digital map:
- Green: available and clean — ready for a new patient immediately
- Blue: occupied — shows patient initials, hours since admission, and expected discharge time
- Yellow: being cleaned — EVS in progress with countdown timer
- Red: blocked — maintenance, isolation, or reserved for scheduled admission
Updated automatically via HL7 ADT messages — when a discharge order is placed (A03), the bed transitions to yellow and housekeeping is auto-dispatched. When EVS marks cleaning complete, the bed turns green. Zero manual updates required.
Patient Flow Pipeline
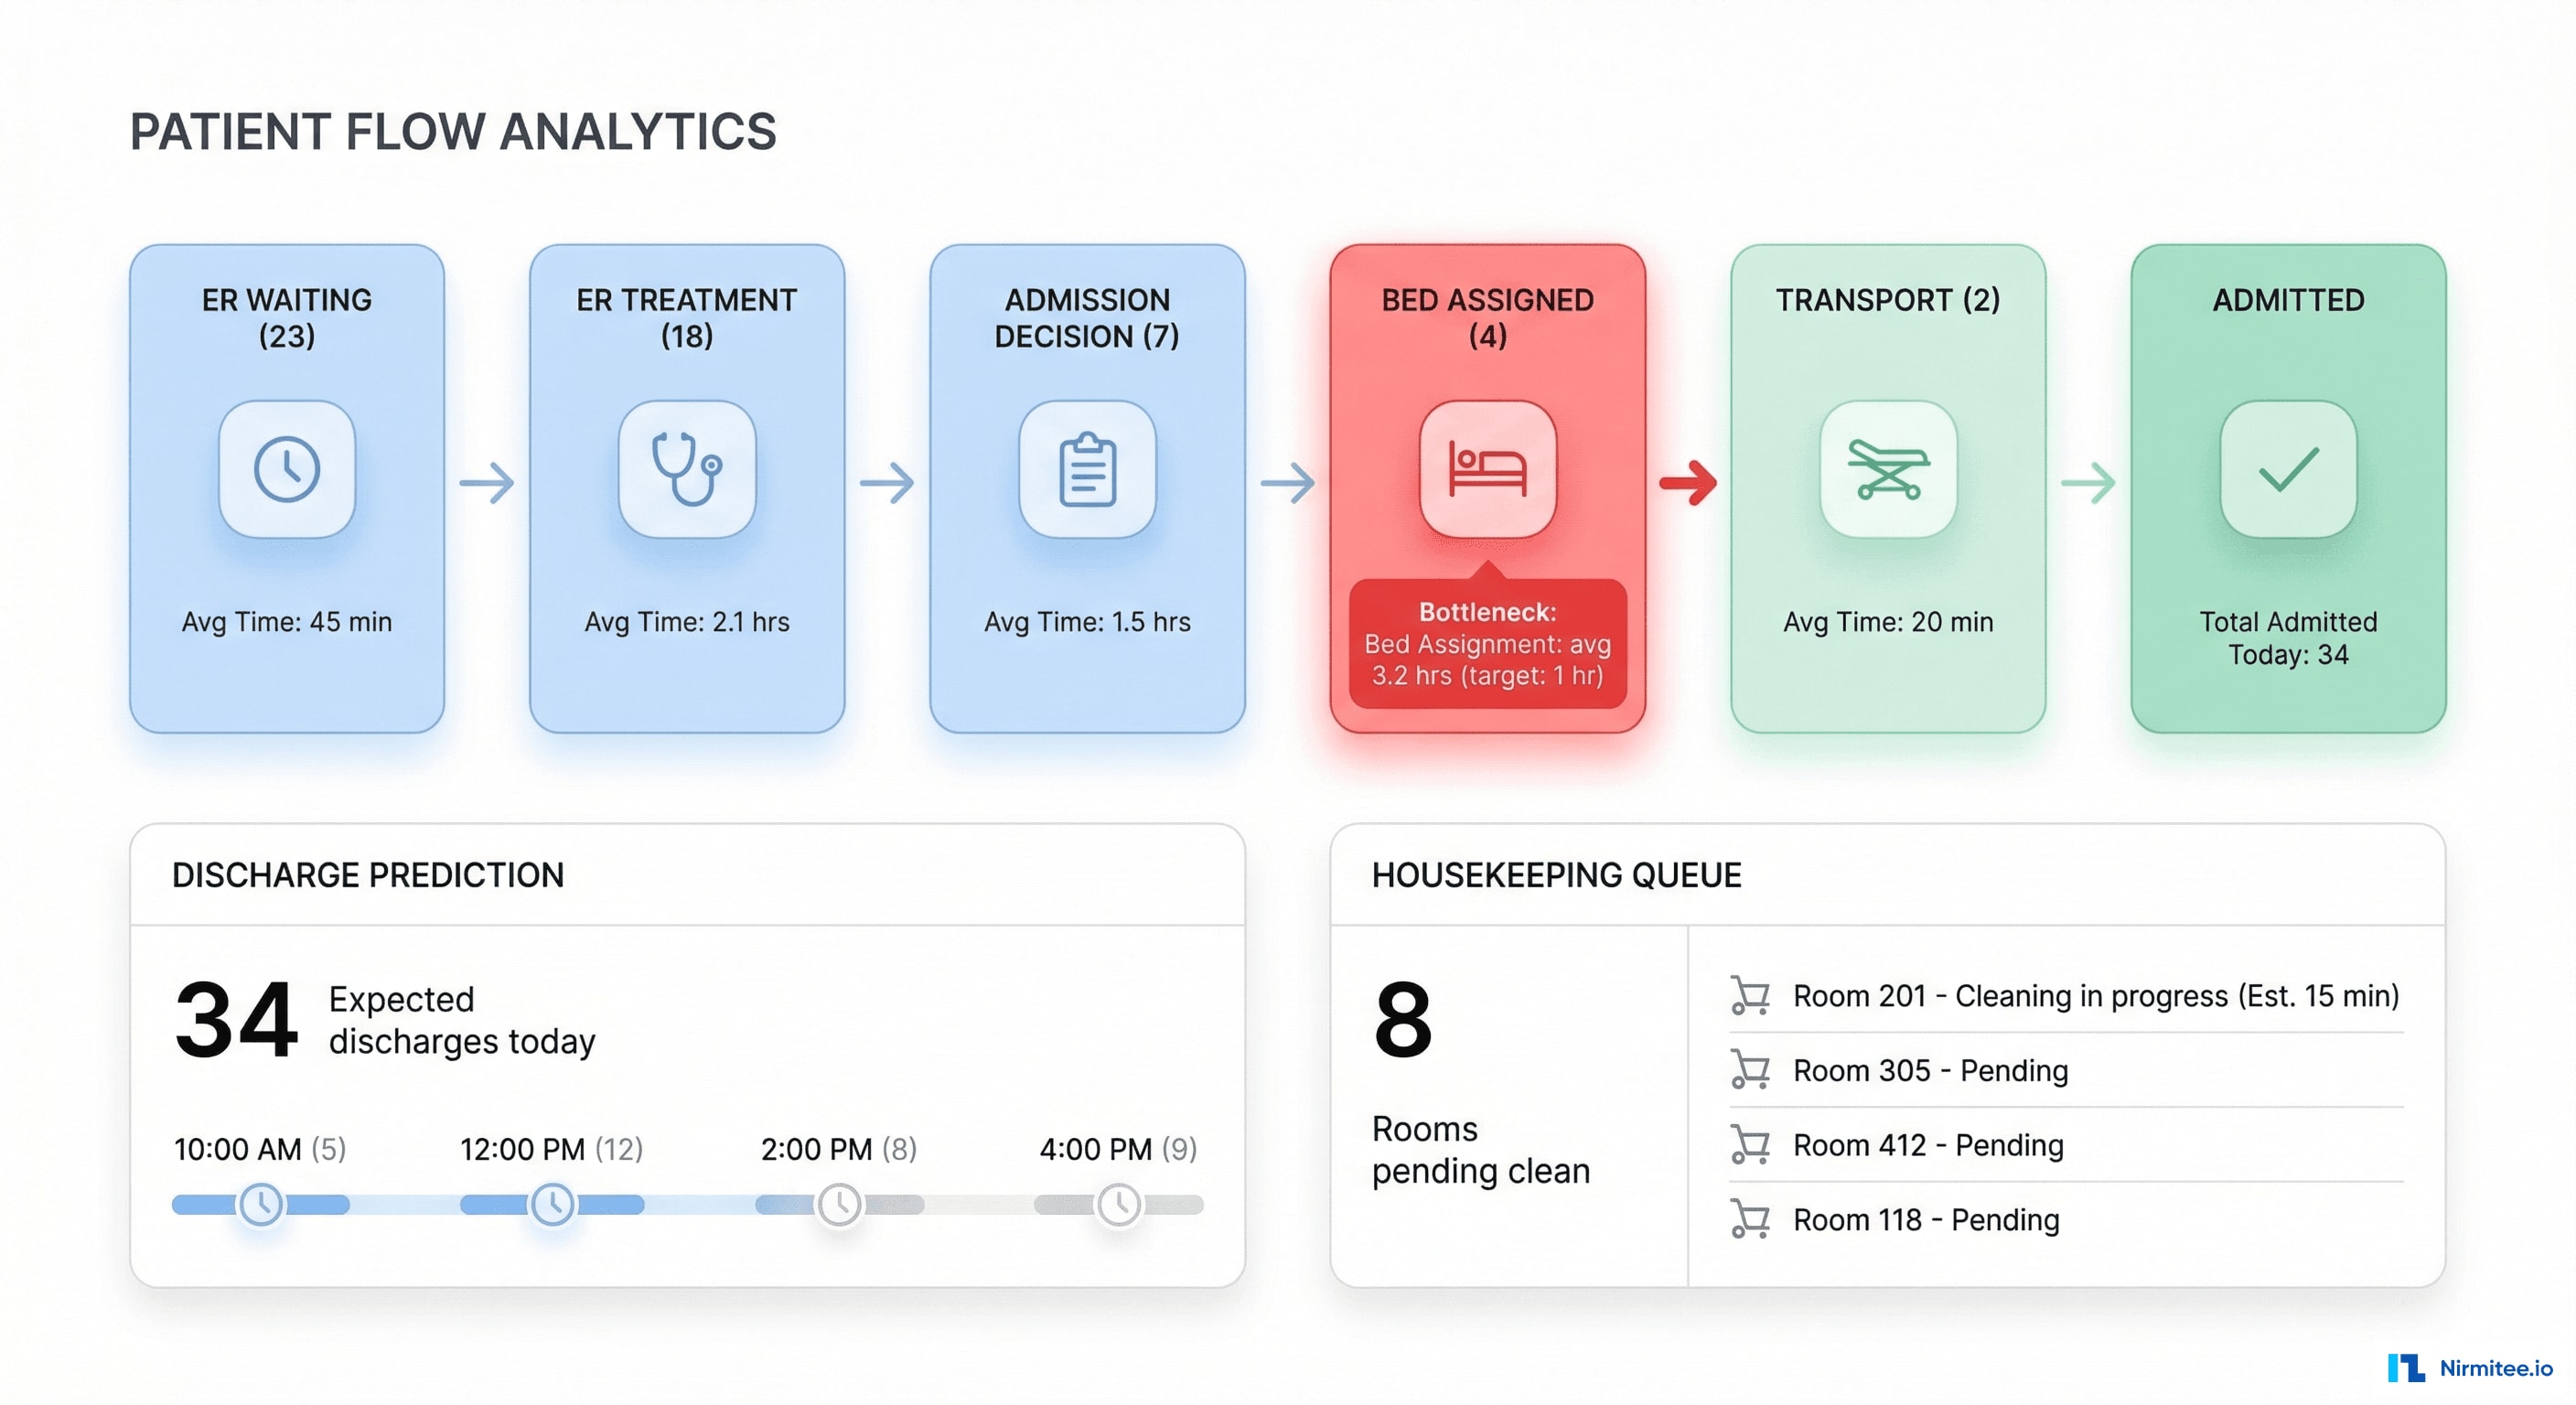
The patient flow dashboard shows the entire journey from ER arrival to inpatient bed:
- ER Waiting (23 patients): avg wait 42 min — within target
- ER Treatment (18): being evaluated by physician
- Admission Decision (7): admitted, waiting for bed assignment — this is the bottleneck
- Bed Assigned (4): bed found, waiting for room prep or transport
- Transport (2): being moved to assigned bed
The system highlights bottlenecks in red: "Bed Assignment: avg 3.2 hrs (target: 1 hr)" — immediately showing leadership where to focus.
Architecture
Technology Stack
| Component | Technology | Purpose |
|---|---|---|
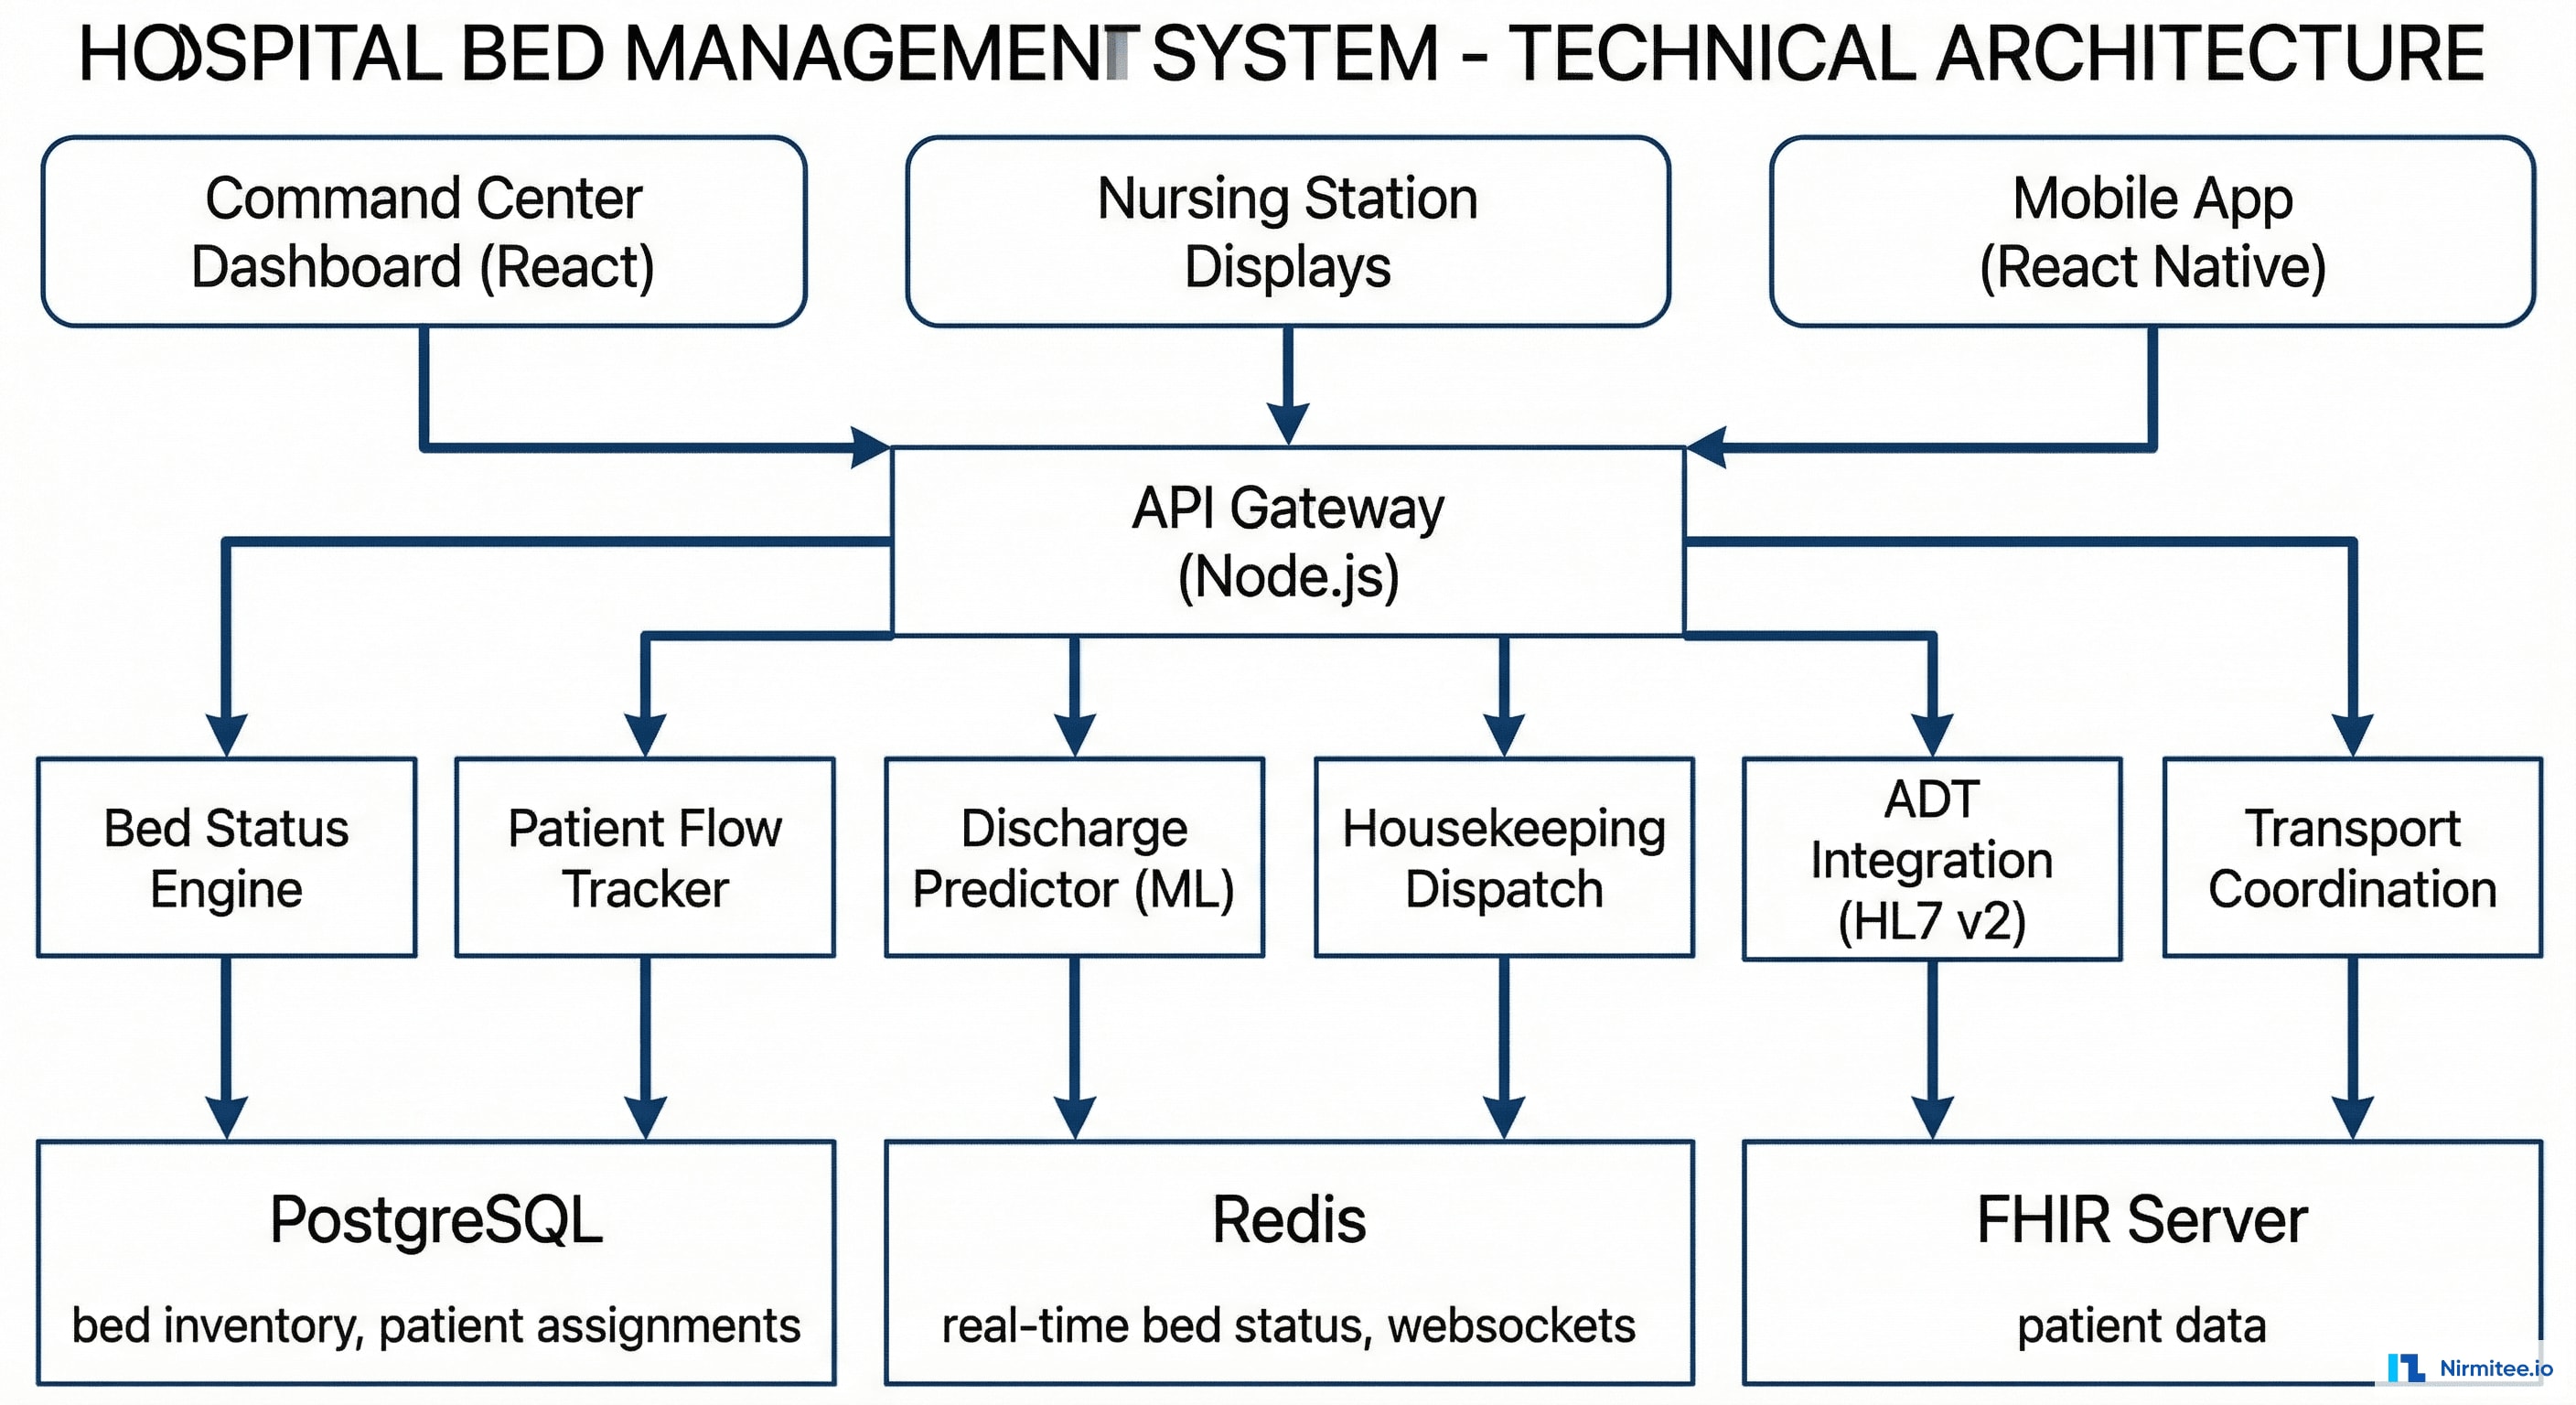
| Command Center Dashboard | React + WebSocket | Real-time bed board, flow metrics, alerts |
| Nursing Station Displays | React (read-only view) | Unit-level bed status on wall-mounted screens |
| Mobile App | React Native | Housekeeping dispatch, transport coordination |
| Backend | Node.js (Express + Socket.io) | Real-time event processing, bed status engine |
| Database | PostgreSQL | Bed inventory, patient assignments, history |
| Real-time | Redis + Socket.io | Live bed status updates, WebSocket pub/sub |
| ADT Integration | Mirth Connect (HL7 v2) | ADT A01/A02/A03 events drive bed status |
| ML Model | Python (XGBoost) | Discharge time prediction |
| FHIR | HAPI FHIR | Patient data, encounter data for discharge prediction |
ML Discharge Prediction
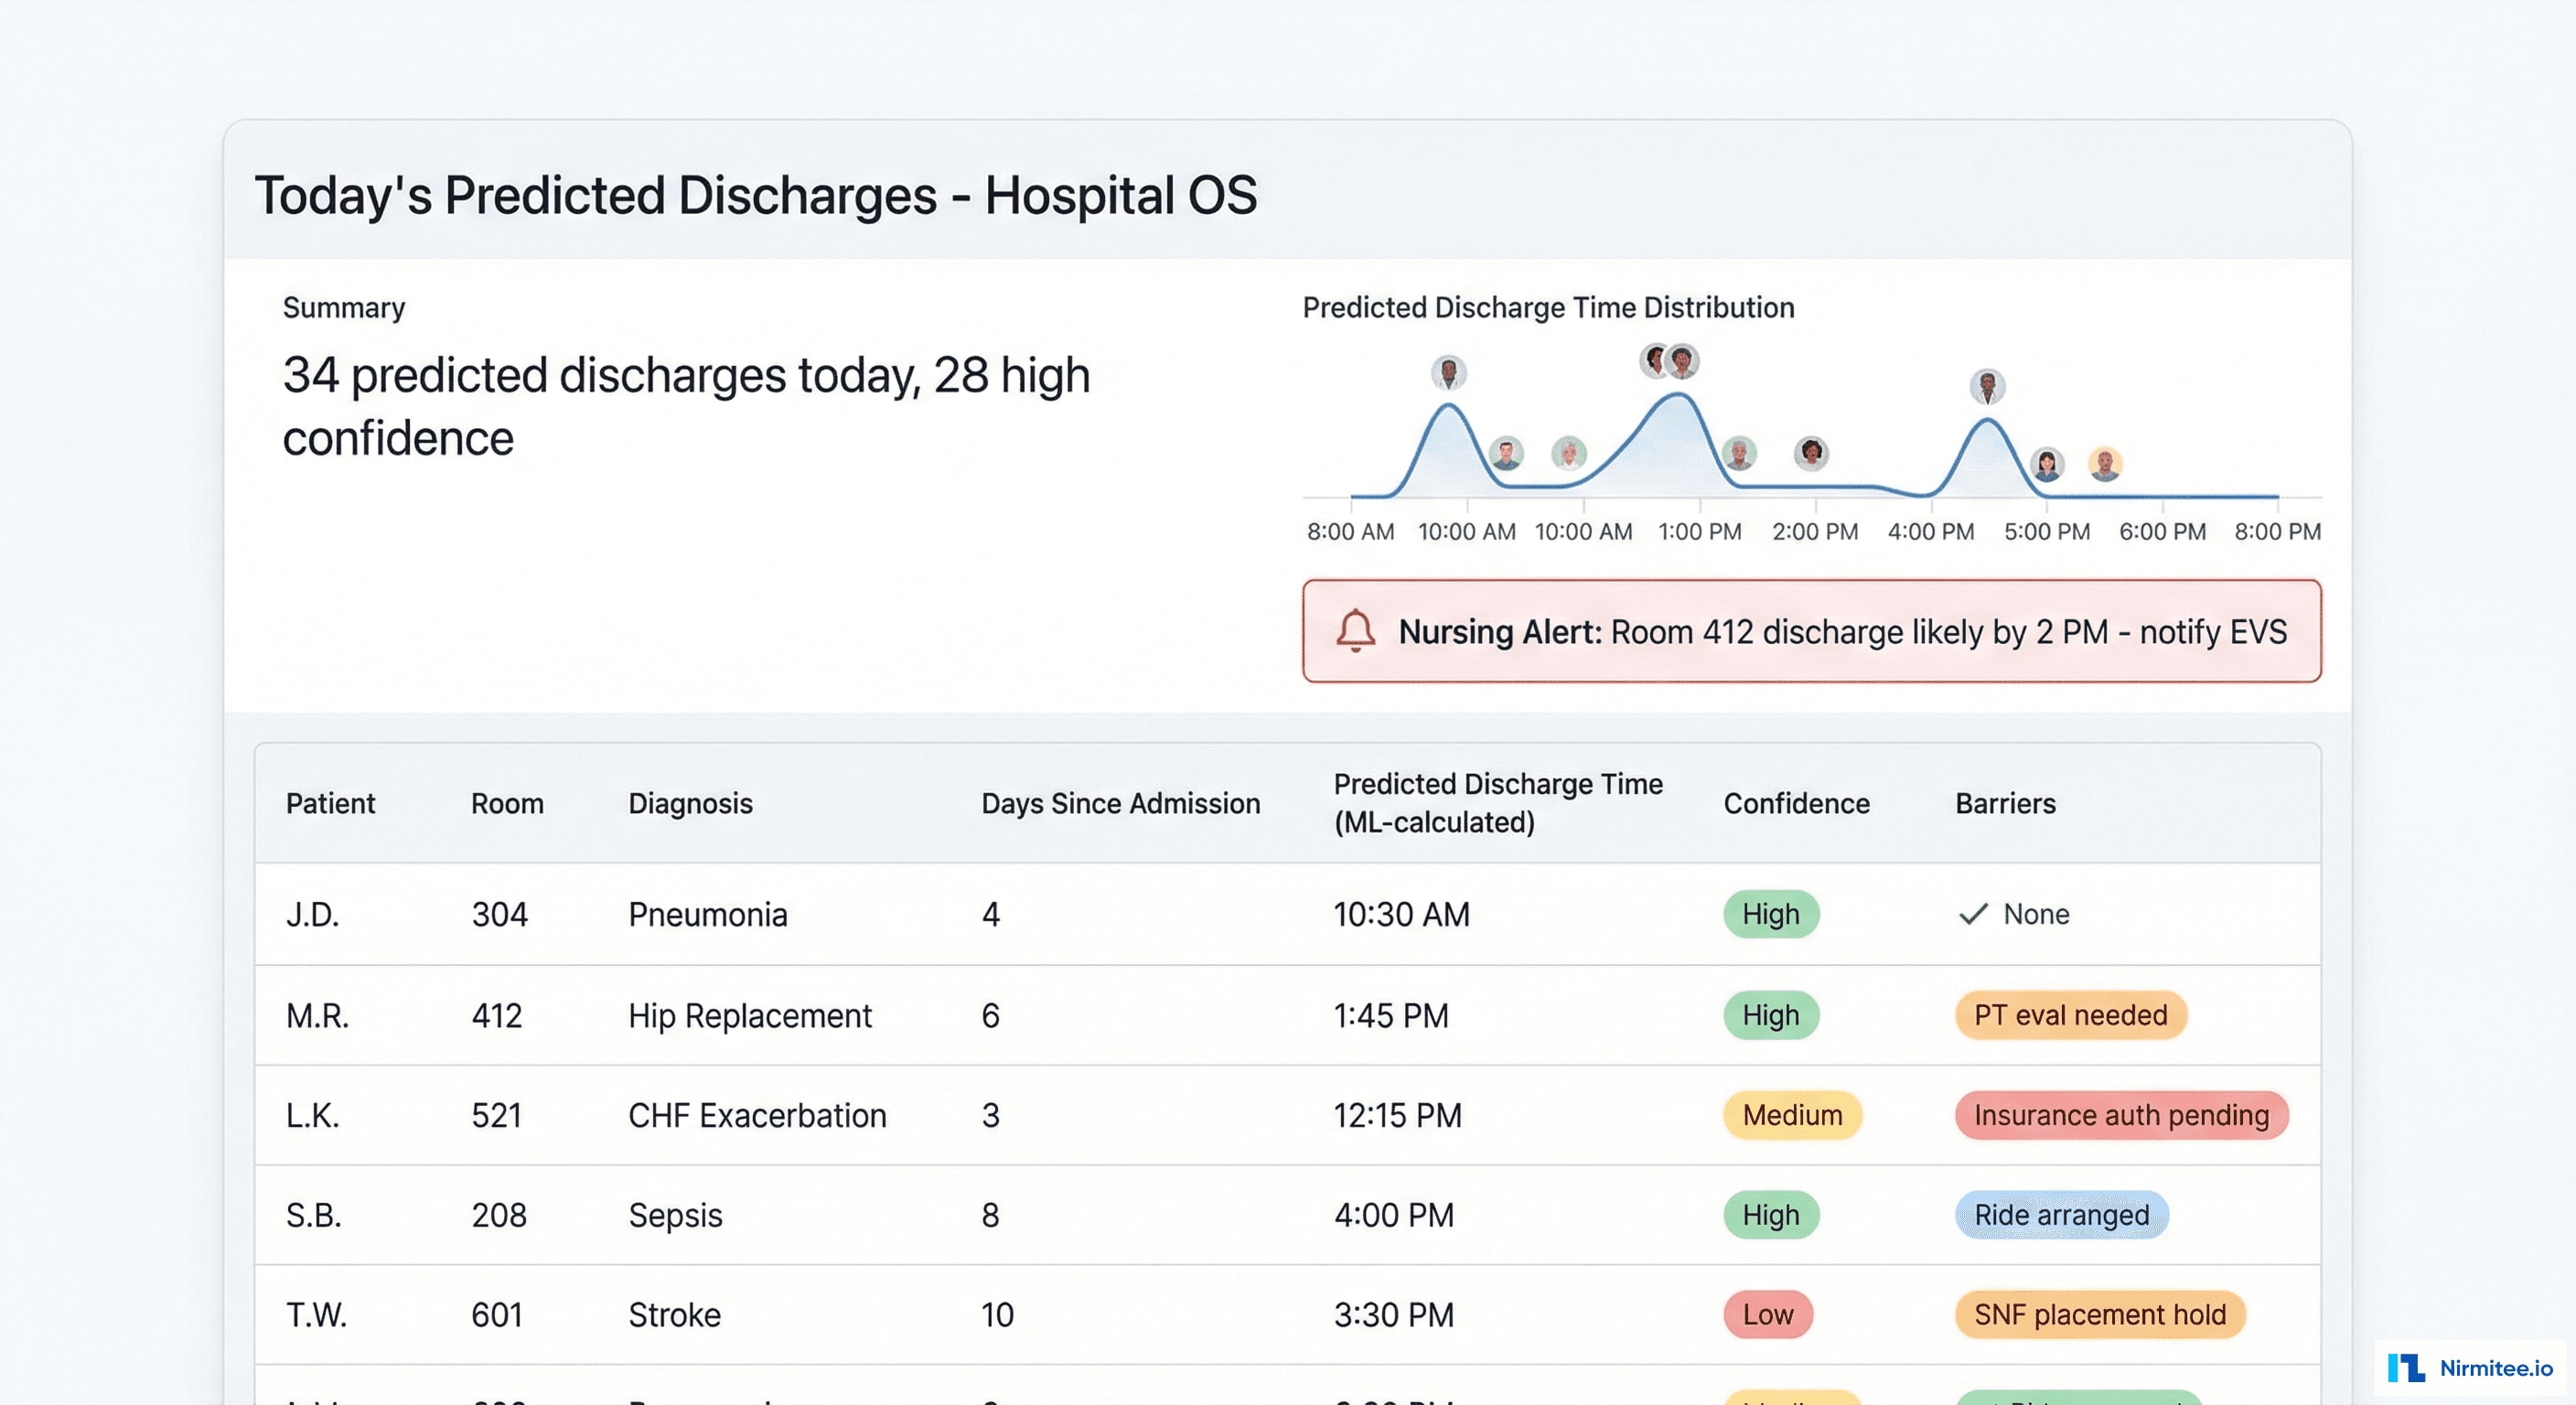
The discharge predictor uses an XGBoost model trained on 2 years of historical discharge data to predict when each patient is likely to leave:
- Features: diagnosis (DRG), length of stay, pending tests/procedures, physician rounding schedule, insurance authorization status, time of day, day of week
- Output: predicted discharge time with confidence level (High/Medium/Low)
- Accuracy: 78% of high-confidence predictions are within ±2 hours of actual discharge
- Impact: bed management can pre-assign beds for incoming patients BEFORE the current patient is officially discharged, cutting the bed assignment gap from hours to minutes
Housekeeping Dispatch
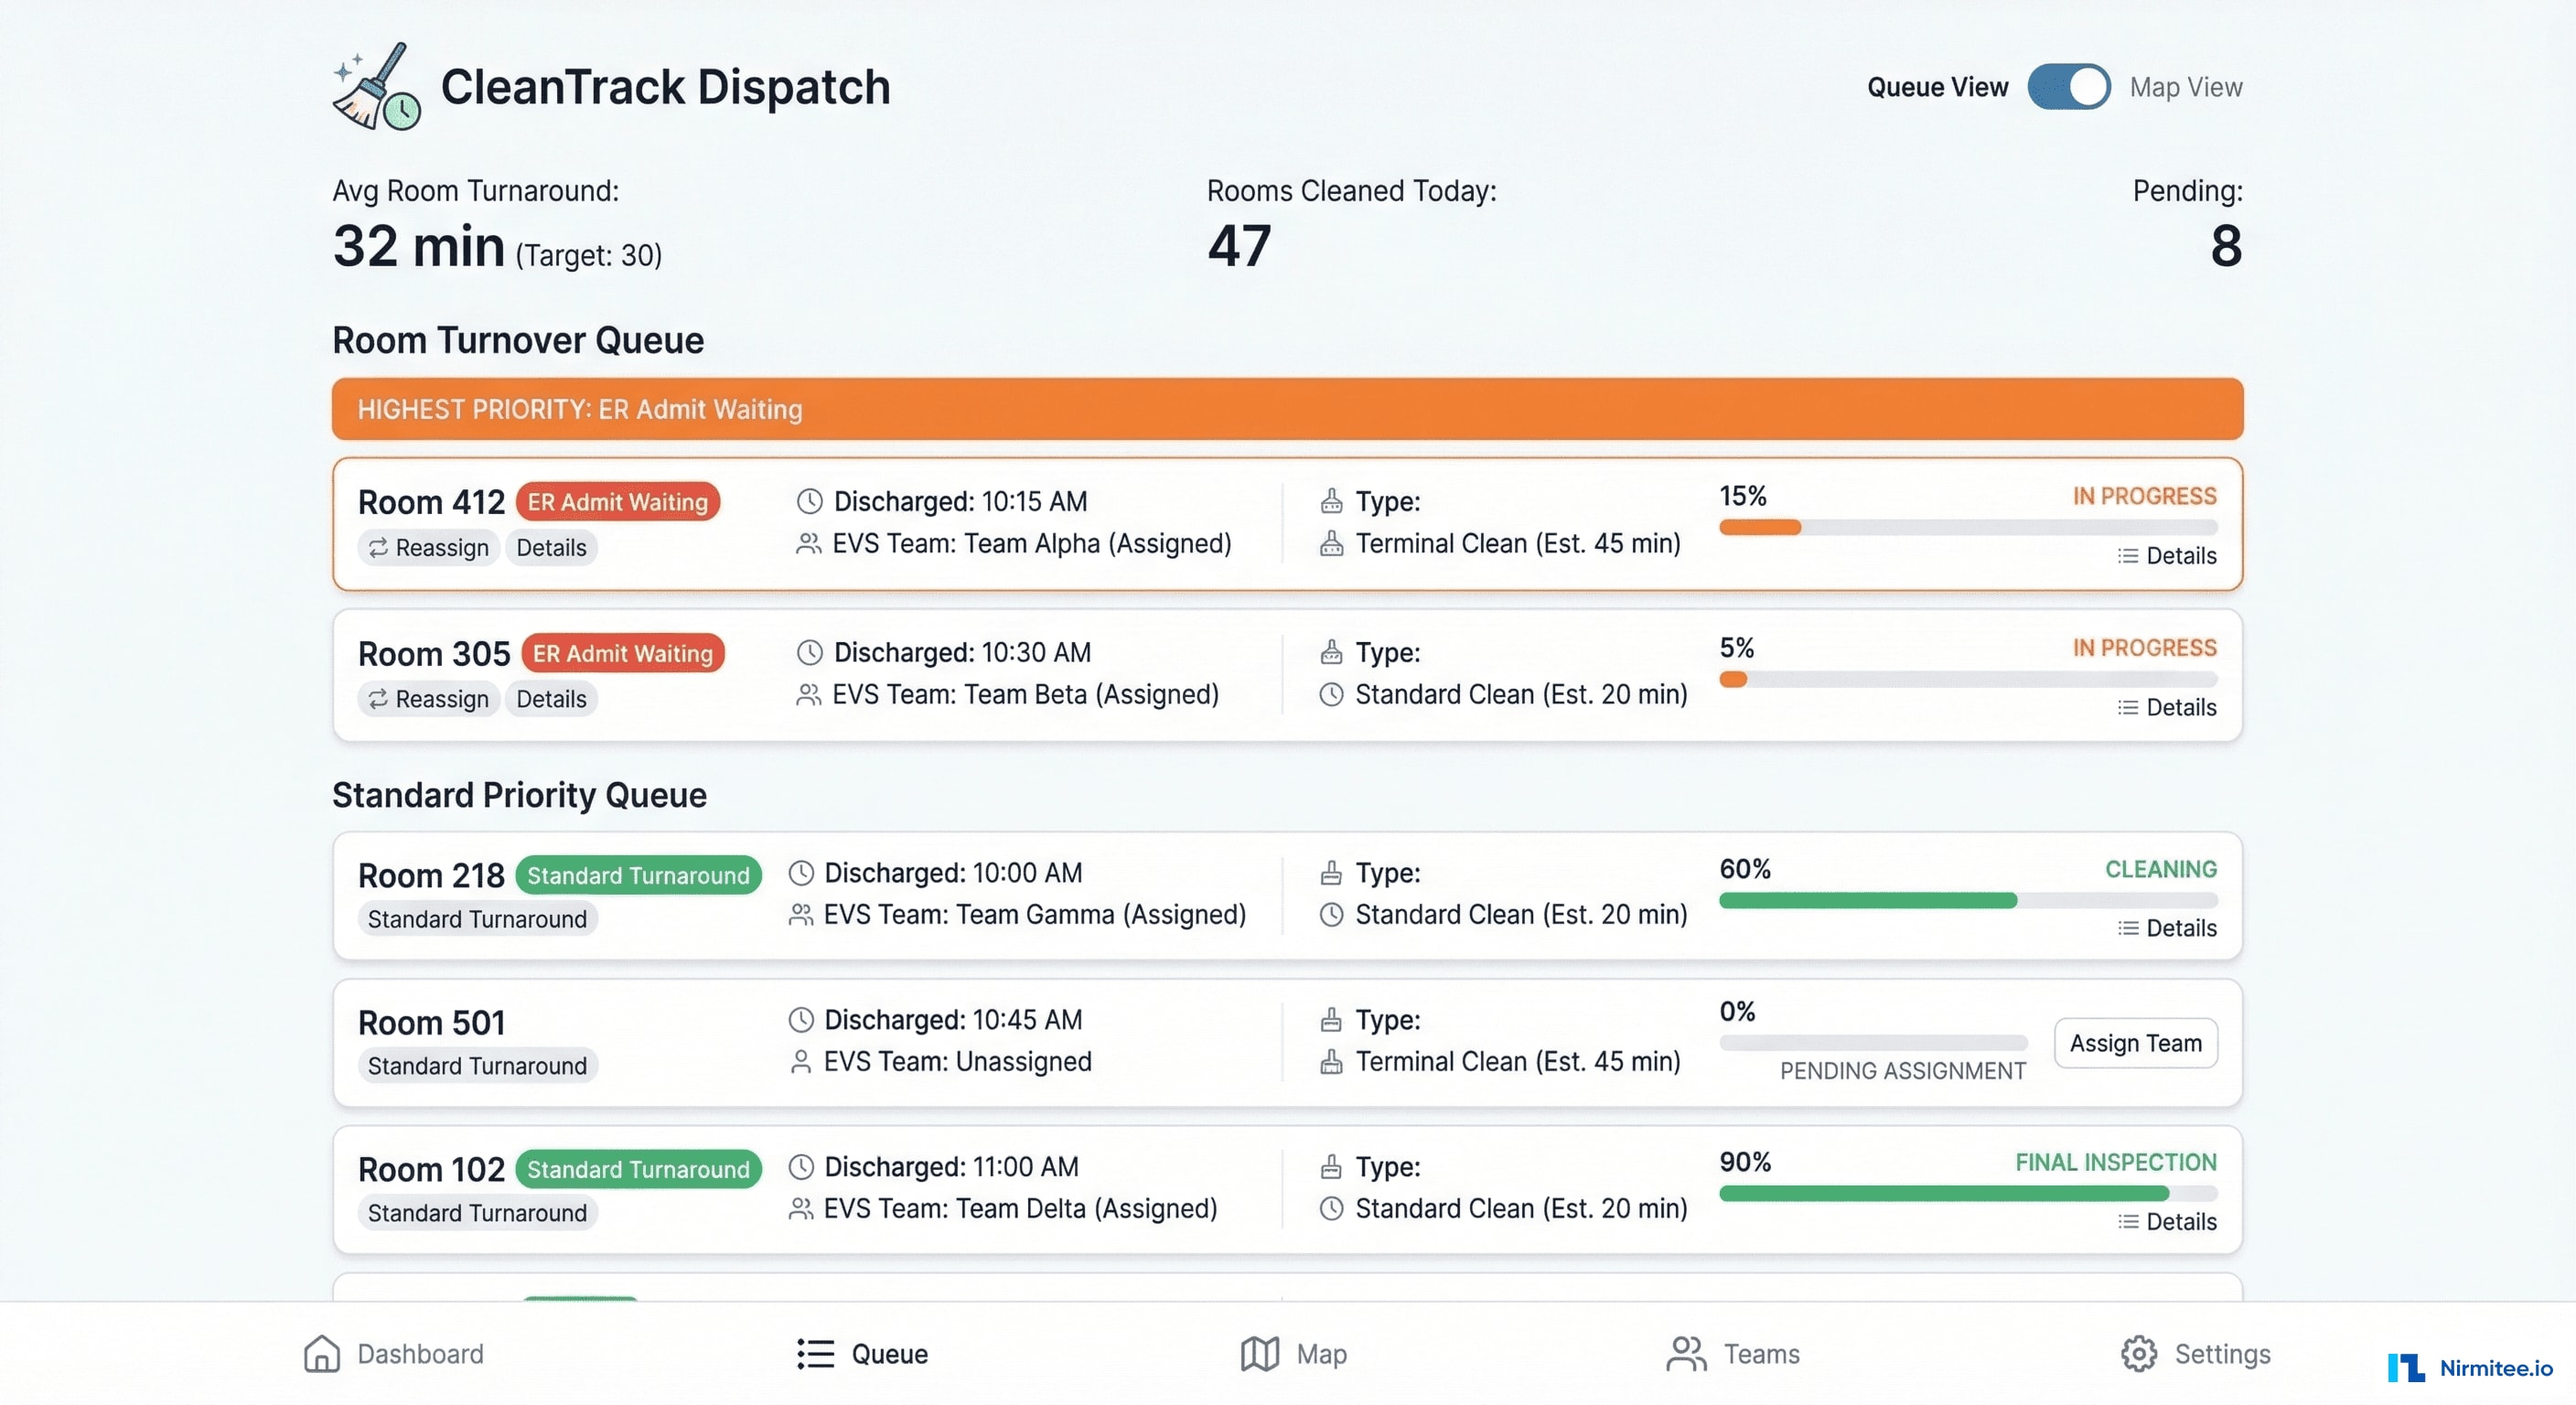
When a patient is discharged (ADT A03), the system automatically:
- Notifies the nearest available EVS team member via mobile app
- Assigns the room based on priority (ER patient waiting = highest, scheduled admission = medium, no pending assignment = standard)
- Tracks cleaning progress with start/complete timestamps
- Updates bed status to "available" the moment EVS marks complete
Room turnaround dropped from 52 minutes to 32 minutes — the biggest gains came from eliminating the notification delay (previously 15-20 minutes before someone called housekeeping).
Command Center
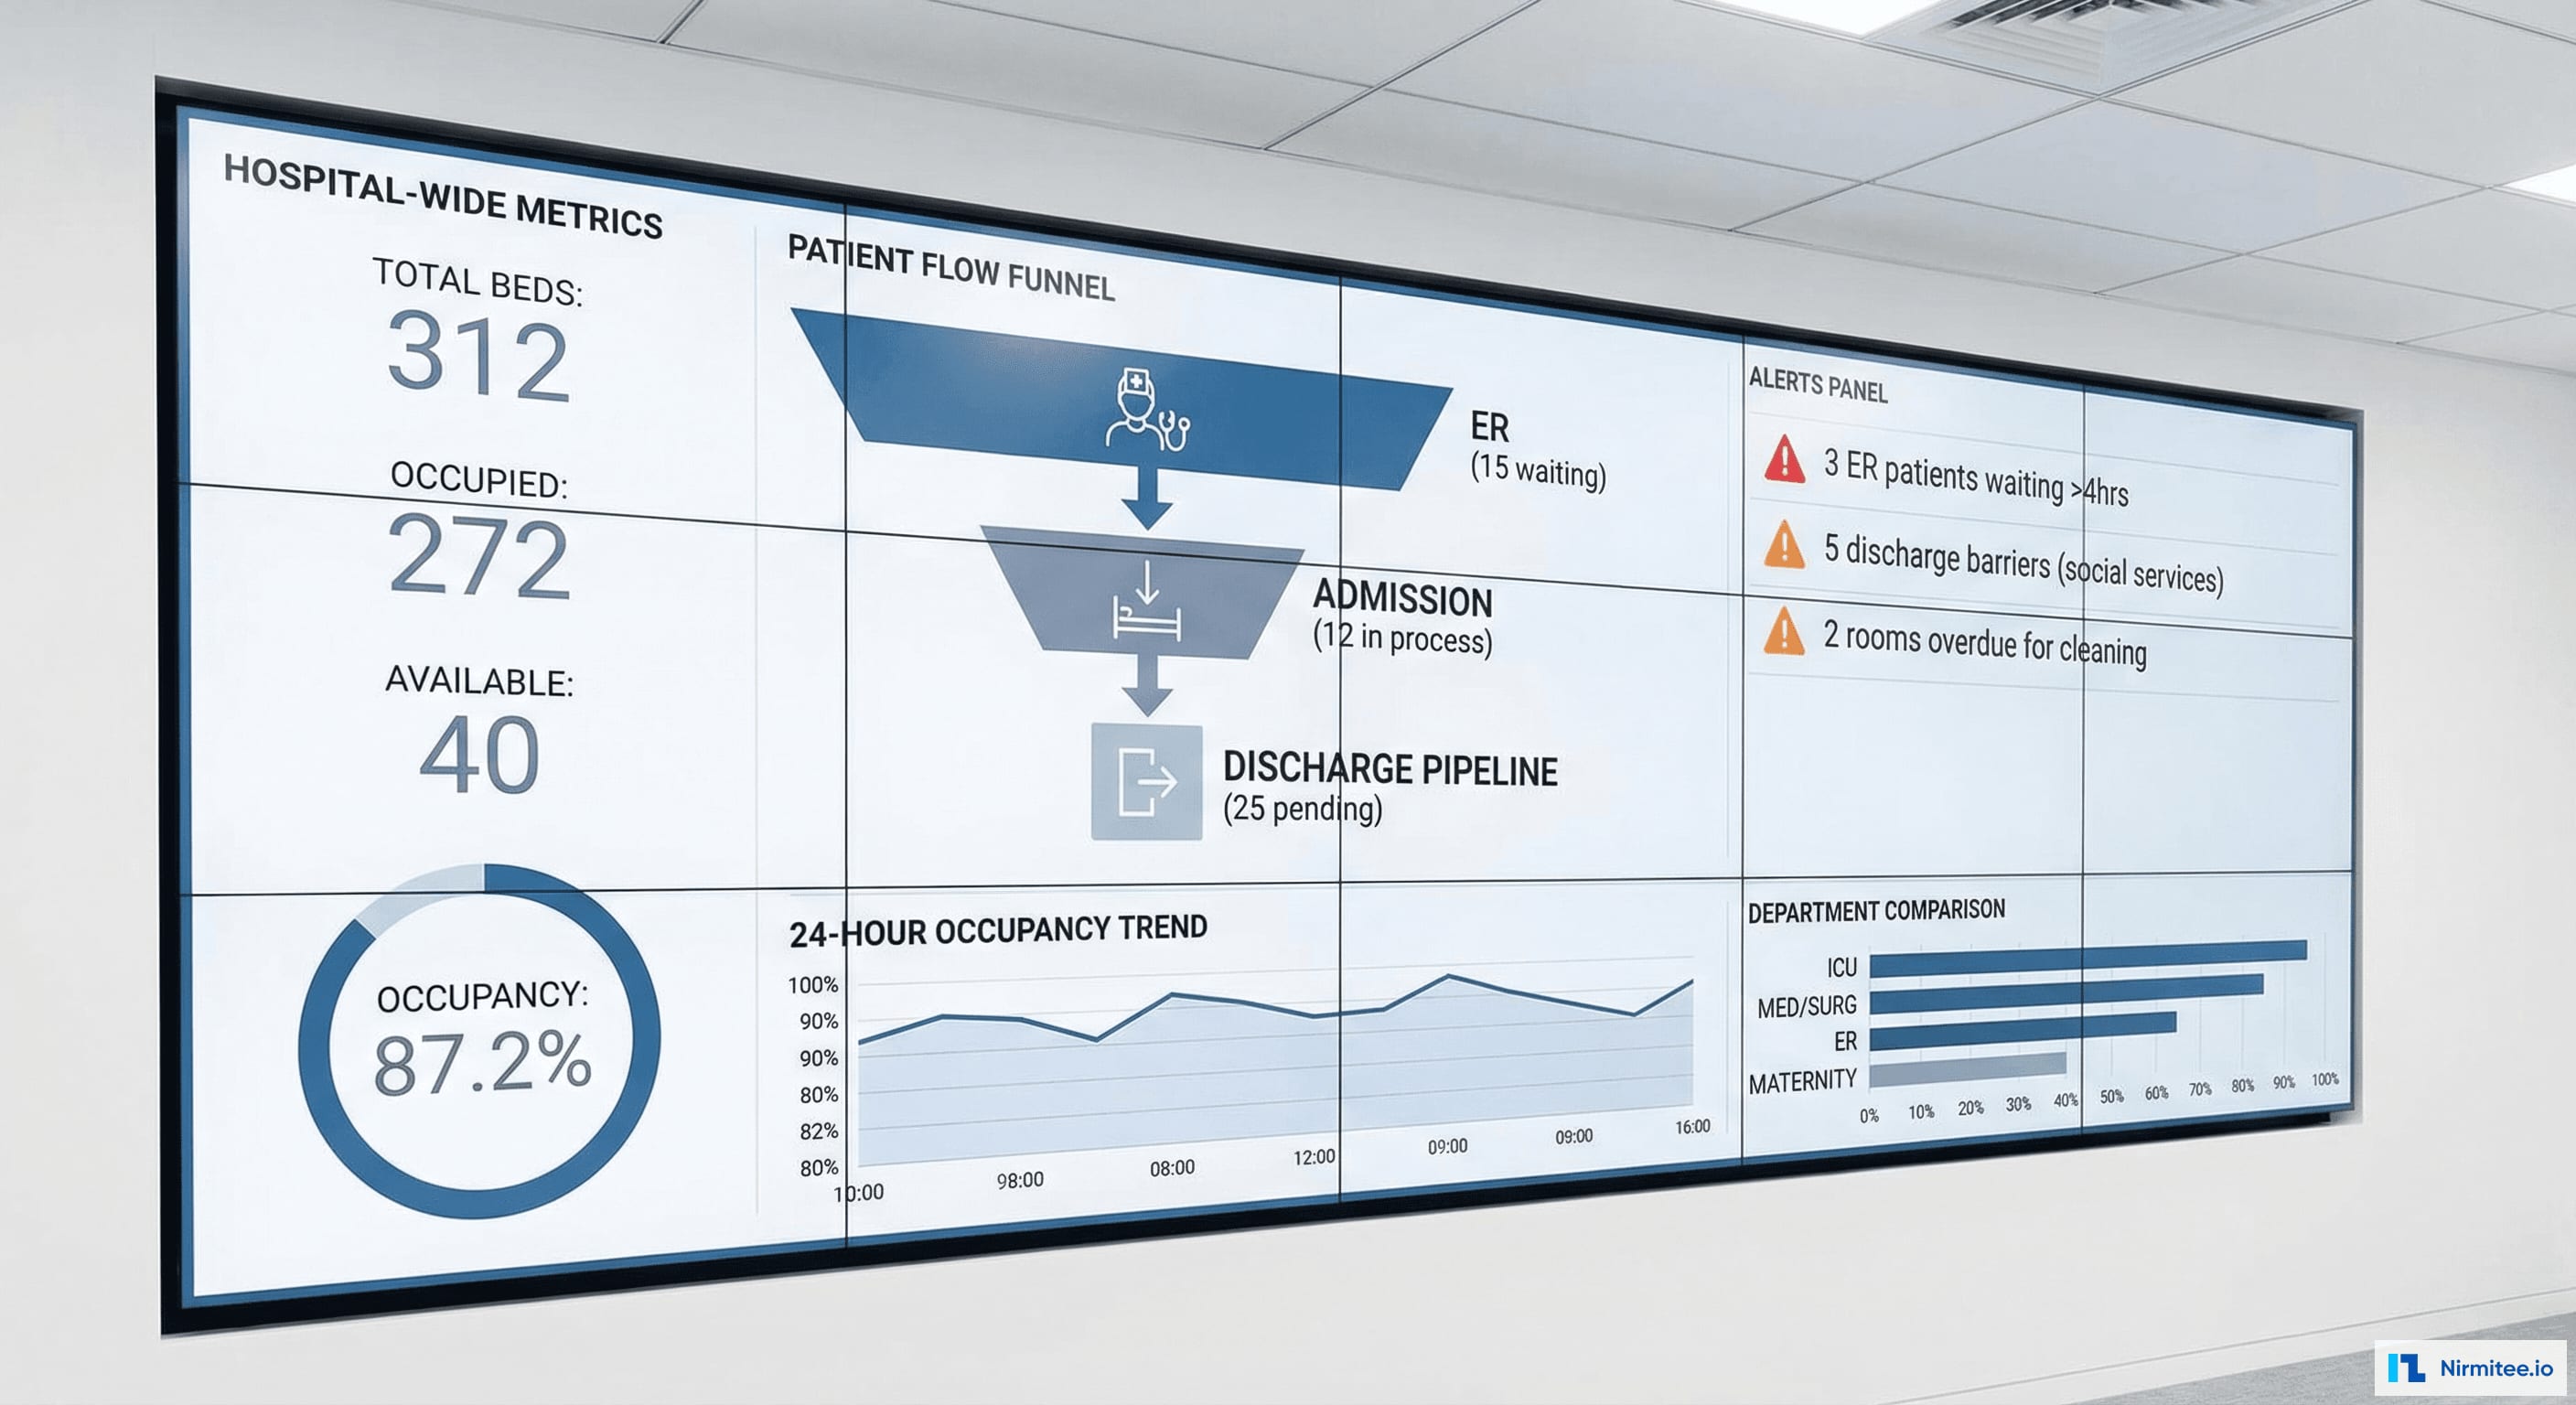
The command center dashboard is designed for wall-mounted displays in the hospital operations center — providing hospital-wide visibility: total bed capacity (312), real-time occupancy (87.2%), patient flow pipeline, critical alerts (patients waiting >4 hours), and 24-hour occupancy trends.
Transport Coordination

Patient transport — moving admitted patients from ER to their inpatient bed — is coordinated digitally: request queue, transporter assignment based on proximity (floor map tracking), priority levels (STAT vs. routine), and ETA tracking.
Results
| Metric | Before | After | Impact |
|---|---|---|---|
| ER average wait time | 4.2 hours | 2.5 hours | 40% reduction |
| Room turnaround time | 52 minutes | 32 minutes | 38% faster |
| LWBS (Left Without Being Seen) | 8.7% | 4.2% | 52% reduction |
| Bed assignment time (ER→inpatient) | 3.2 hours | 1.1 hours | 66% faster |
| Discharge prediction accuracy | N/A (no prediction) | 78% within ±2 hours | Proactive bed planning |
| Revenue recovered (LWBS reduction) | $2.8M/year lost | $1.5M/year recovered | $1.5M additional revenue |
| Phone calls for bed management | 200+/day | <20/day | 90% reduction |
| Bed tracking method | Whiteboard + phone | Real-time digital, ADT-driven | Zero manual updates |
Timeline
| Phase | Duration | Deliverables |
|---|---|---|
| Phase 1 | 4 weeks | ADT integration (Mirth), bed status engine, basic bed board, WebSocket real-time updates |
| Phase 2 | 4 weeks | Patient flow pipeline, housekeeping dispatch, mobile app, command center dashboard |
| Phase 3 | 4 weeks | Discharge prediction ML model, transport coordination, nursing station displays |
| Phase 4 | 3 weeks | Alert configuration, staff training, wall-mounted display deployment, go-live |
Total: 3.75 months with 3 engineers + 1 data scientist. No new hardware required for bed tracking — the system runs entirely on existing ADT feeds from the EHR.
Lessons Learned
- ADT is the single source of truth. We considered bed sensors, RFID, and staff-driven updates. All unnecessary. HL7 ADT messages (A01 admit, A02 transfer, A03 discharge) already capture every bed event. The data was always there — just not connected to a bed management view.
- Housekeeping dispatch is the highest-ROI feature. The 20-minute notification delay for housekeeping was the single biggest contributor to bed turnaround time. Automating this one step recovered 20 minutes per bed, per discharge — across 34 daily discharges, that's 11+ hours of bed availability recovered per day.
- Discharge prediction doesn't need to be perfect. 78% accuracy with ±2 hours is enough to enable proactive bed planning. The alternative (no prediction at all) means beds are only assigned after discharge — too late to prevent ER boarding. An imperfect prediction is dramatically better than no prediction.
- Wall-mounted displays change behavior. When the command center dashboard went live on 65-inch screens, the entire hospital operations culture shifted. Bed management became visible, measurable, and accountable. The display itself was the change management tool.
Was this case study helpful?