Executive Summary
Menopause affects 1.3 million women entering it annually in the US alone, yet most receive fragmented, reactive care — bouncing between gynecologists, PCPs, endocrinologists, and mental health providers with no unified view of their health journey. A femtech startup set out to change this.
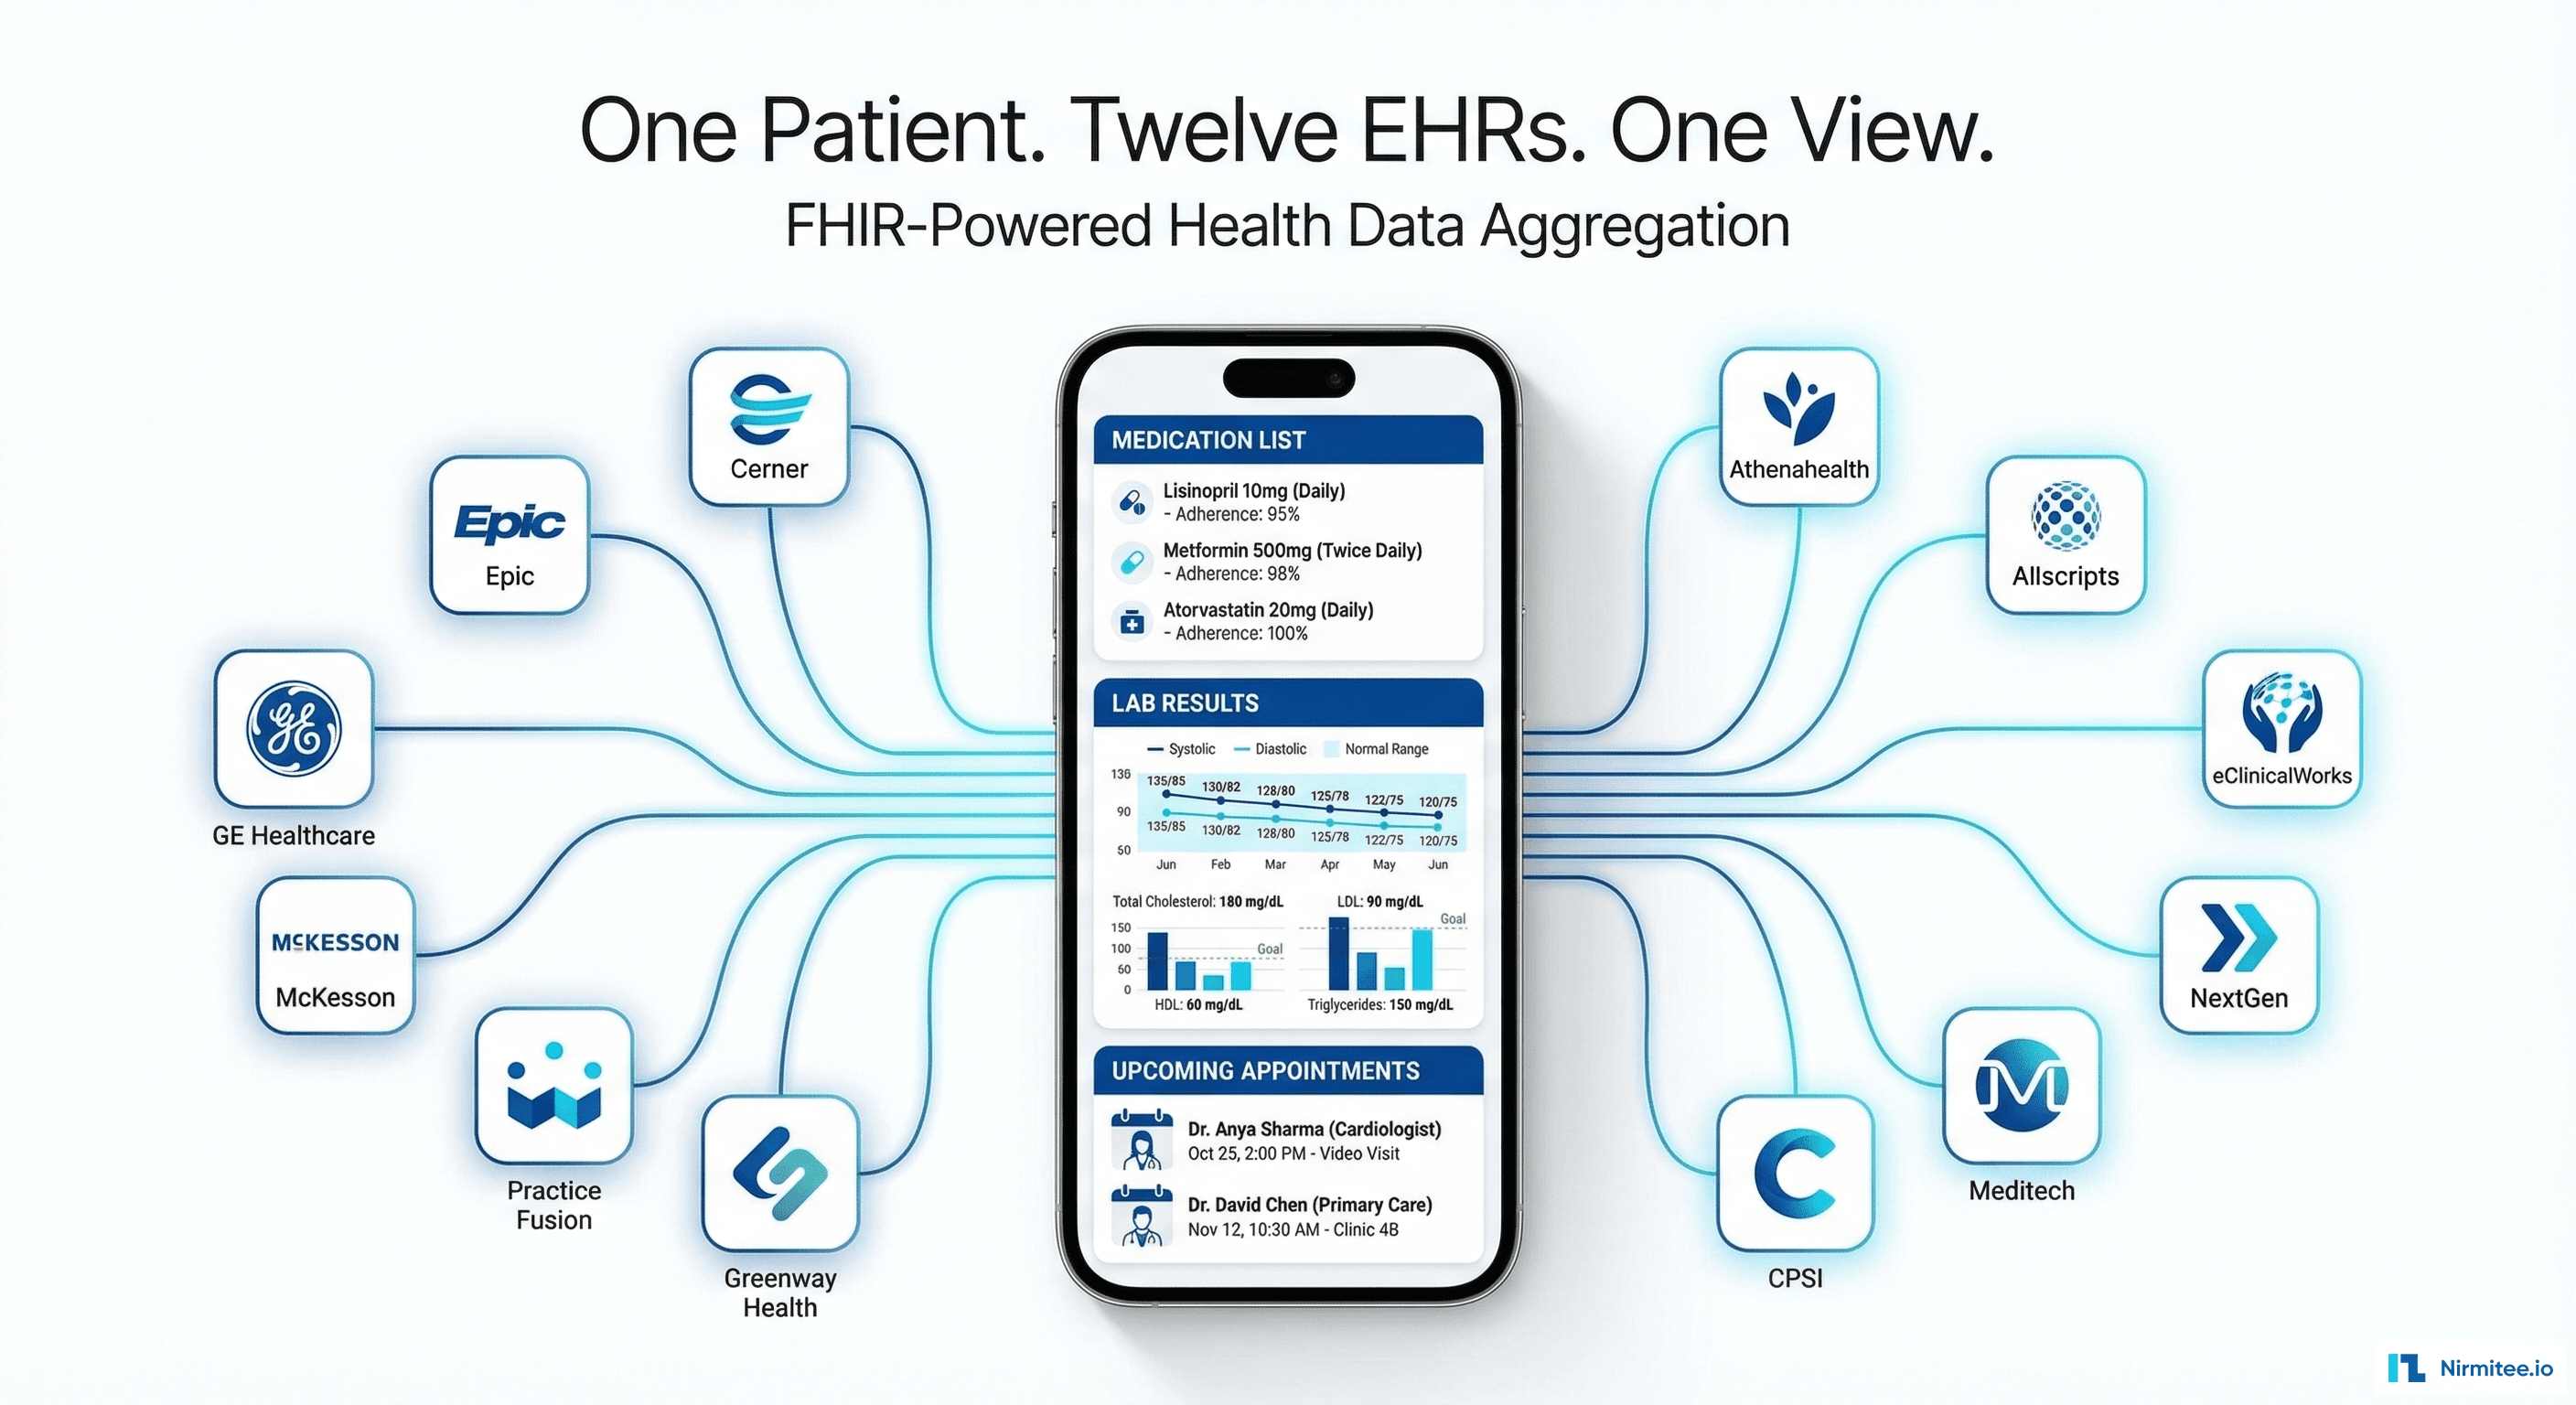
We built an AI-powered women's health platform that integrates with EHR systems via FHIR, connects wearable devices (Apple Watch, Oura Ring, Fitbit), and uses machine learning to detect symptom patterns, optimize treatment plans, and provide personalized menopause care. The platform serves both patients (mobile app) and providers (web dashboard).
Results: 73% symptom improvement in the first 6 months, 4x faster treatment optimization compared to traditional trial-and-error approaches, and 89% patient satisfaction rating.

The Problem: Menopause Care Is Broken
The average woman experiences menopause-related symptoms for 7-10 years. Yet the average time from first symptoms to effective treatment is 3+ years. Why?
Fragmented Care
- Multiple providers, zero coordination: a woman's menopause data is scattered across her gynecologist (Epic), PCP (Cerner), endocrinologist (athena), and therapist (separate system). No provider sees the full picture.
- Hormone labs at one clinic, symptoms at another: FSH, estradiol, and progesterone levels are in the lab system. Hot flash frequency and sleep disruption are in the patient's memory (or nowhere). Treatment decisions are made with incomplete data.
- Generic treatment protocols: most women start on the same HRT regimen regardless of their symptom profile, hormone levels, risk factors, and lifestyle. Treatment optimization is trial-and-error over months.
No Symptom Tracking Infrastructure
- Recall bias: "How many hot flashes did you have last month?" Most women can't accurately recall. Provider decisions based on inaccurate self-report.
- No objective data: wearable devices track sleep, HRV, temperature — all relevant to menopause — but this data never reaches the clinical workflow.
- Invisible patterns: correlations between stress, sleep, diet, exercise, and menopause symptoms exist but are invisible without continuous tracking and ML analysis.
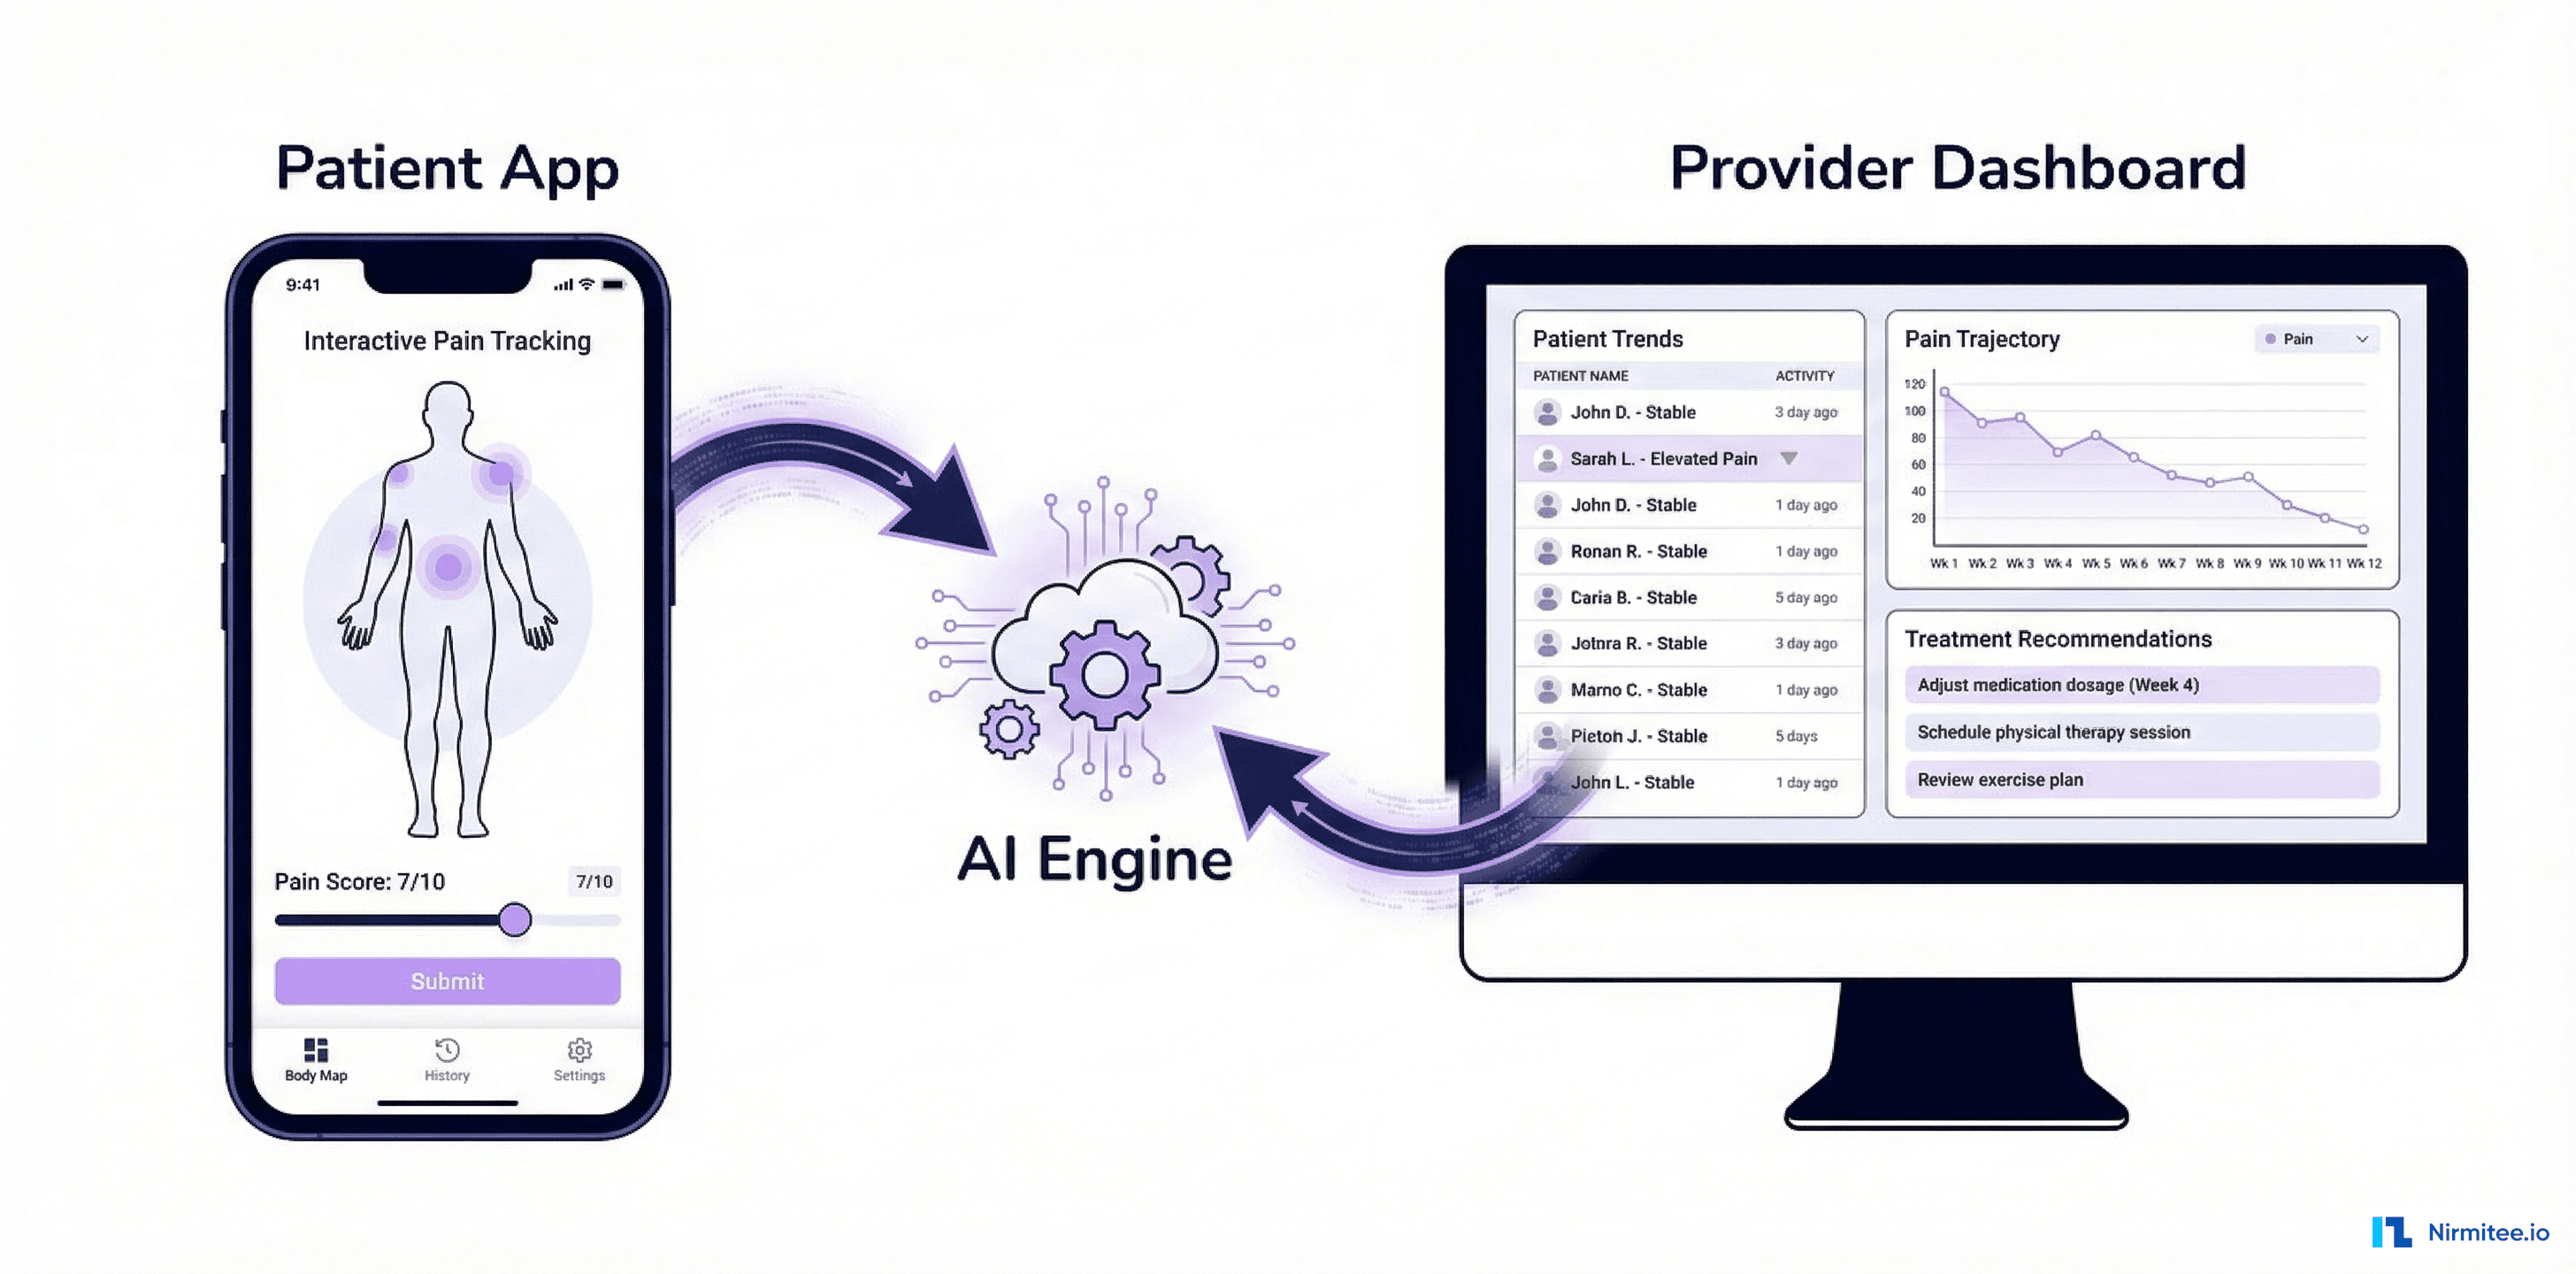
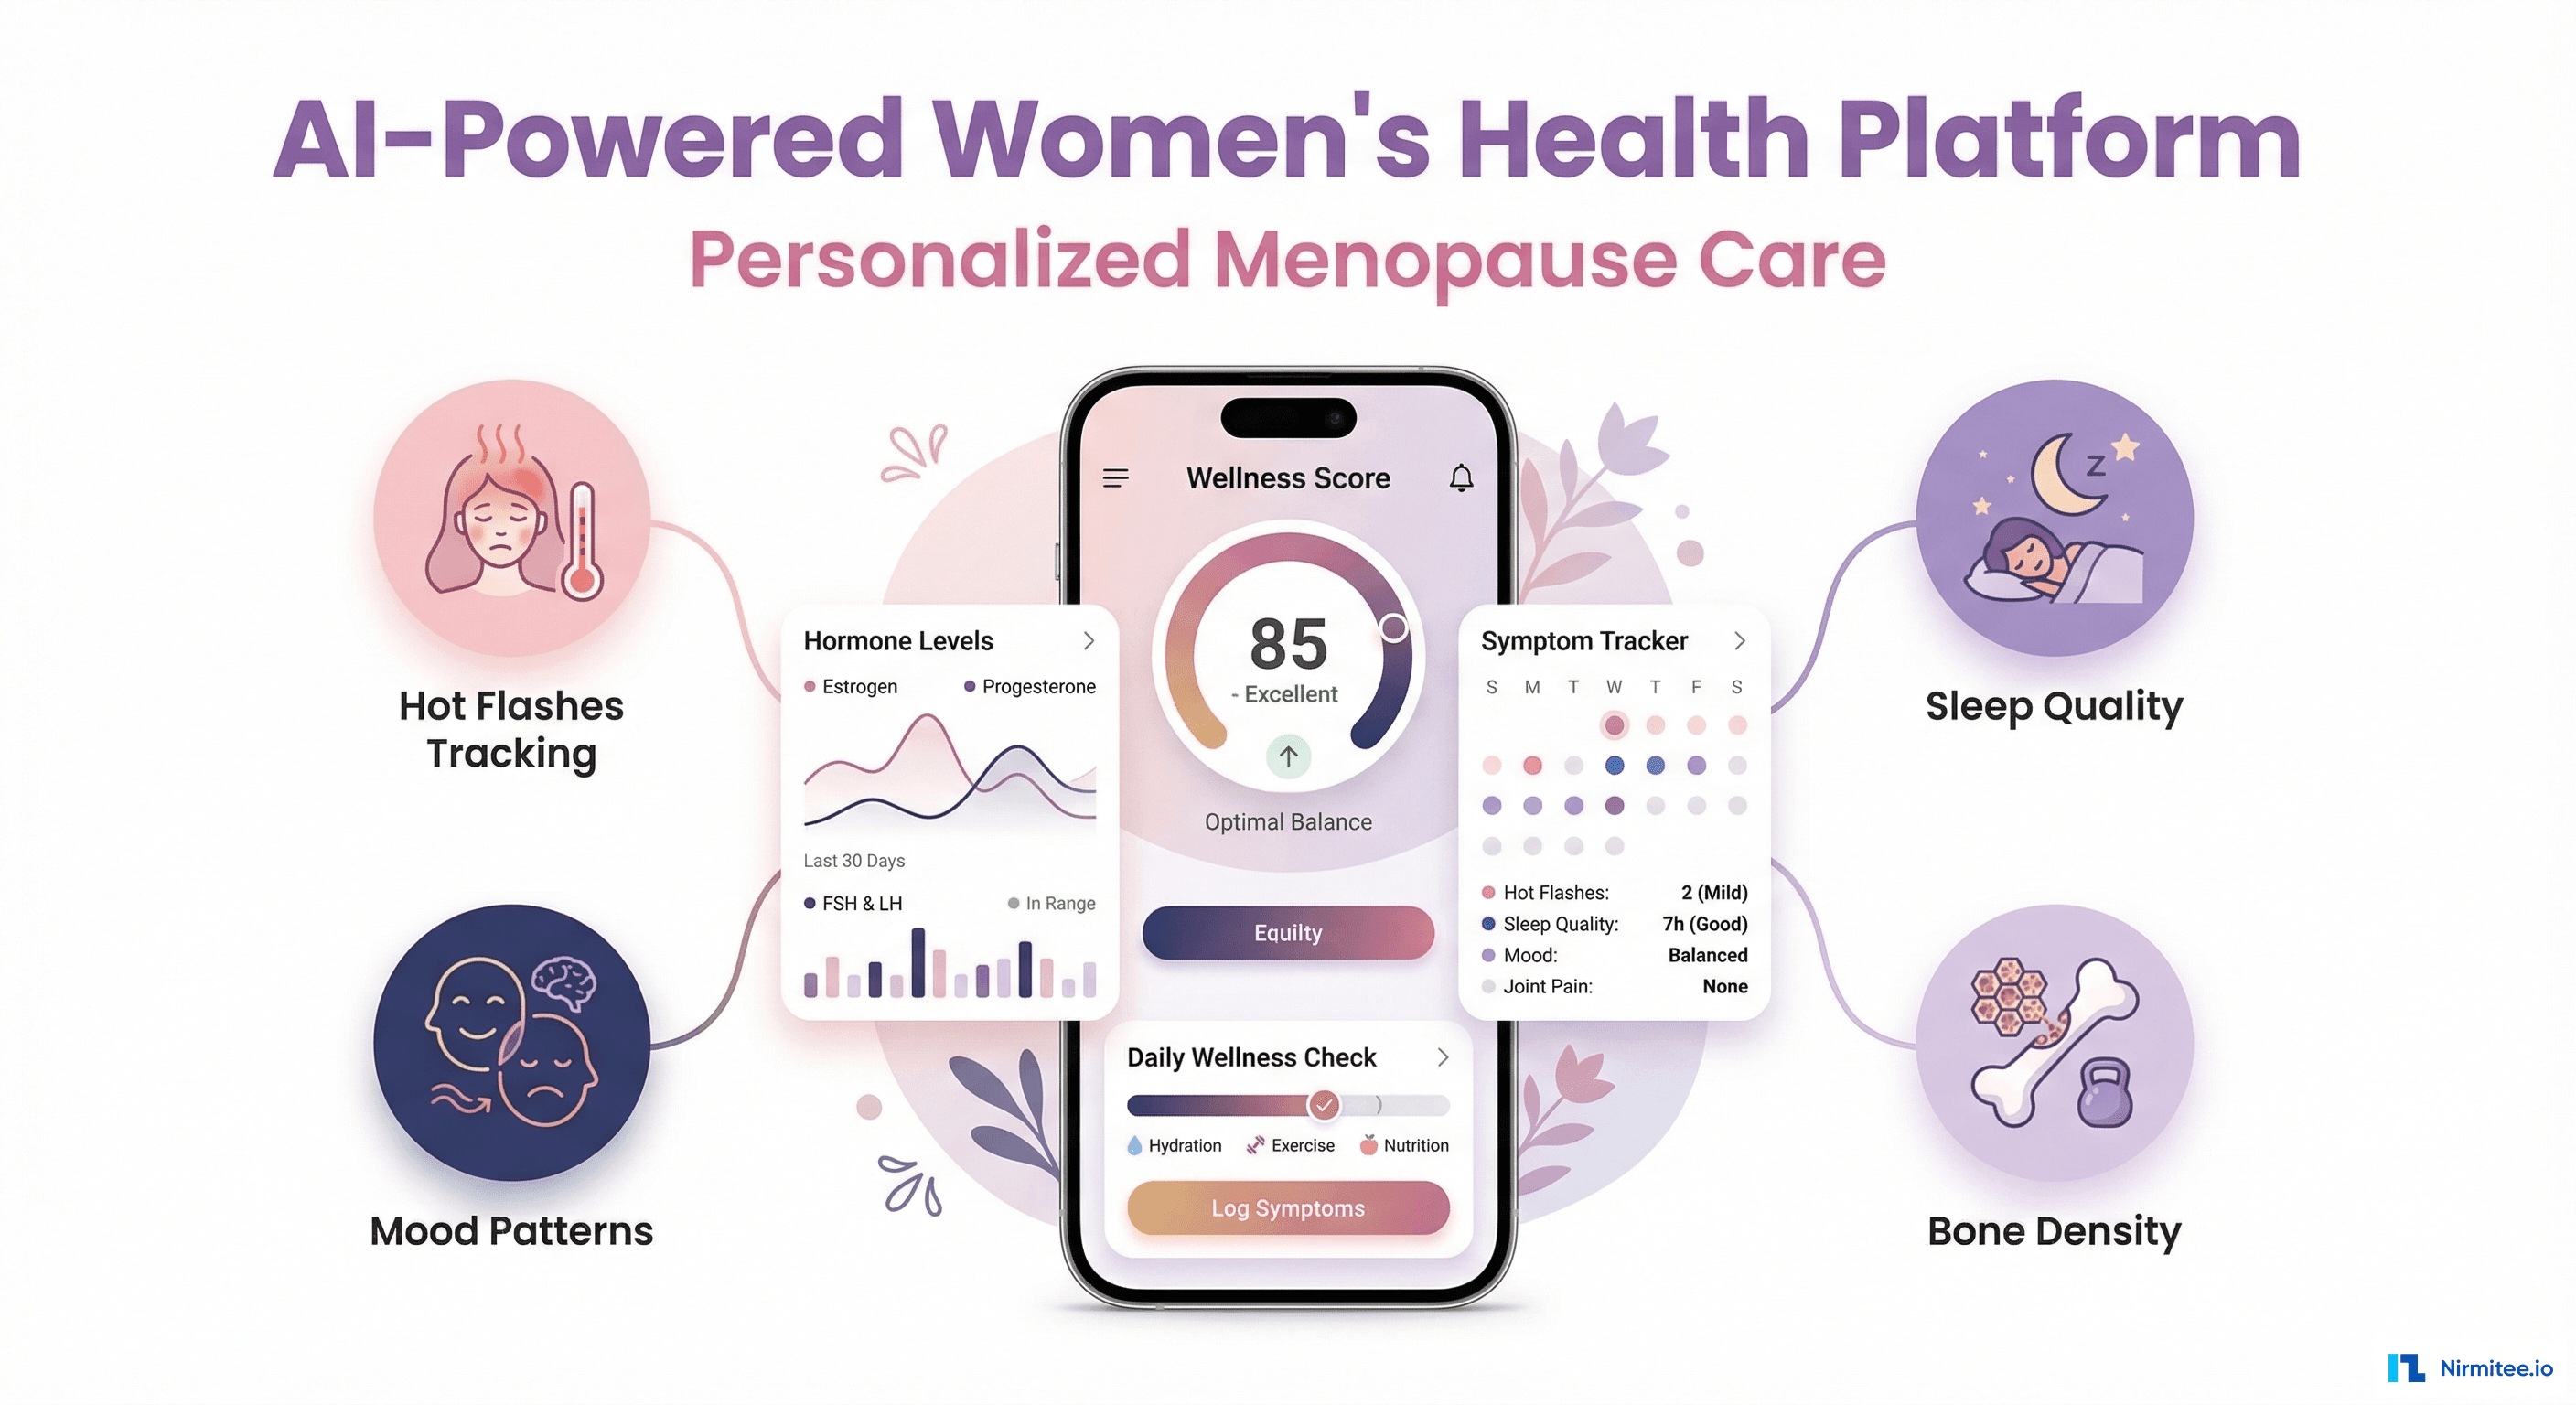
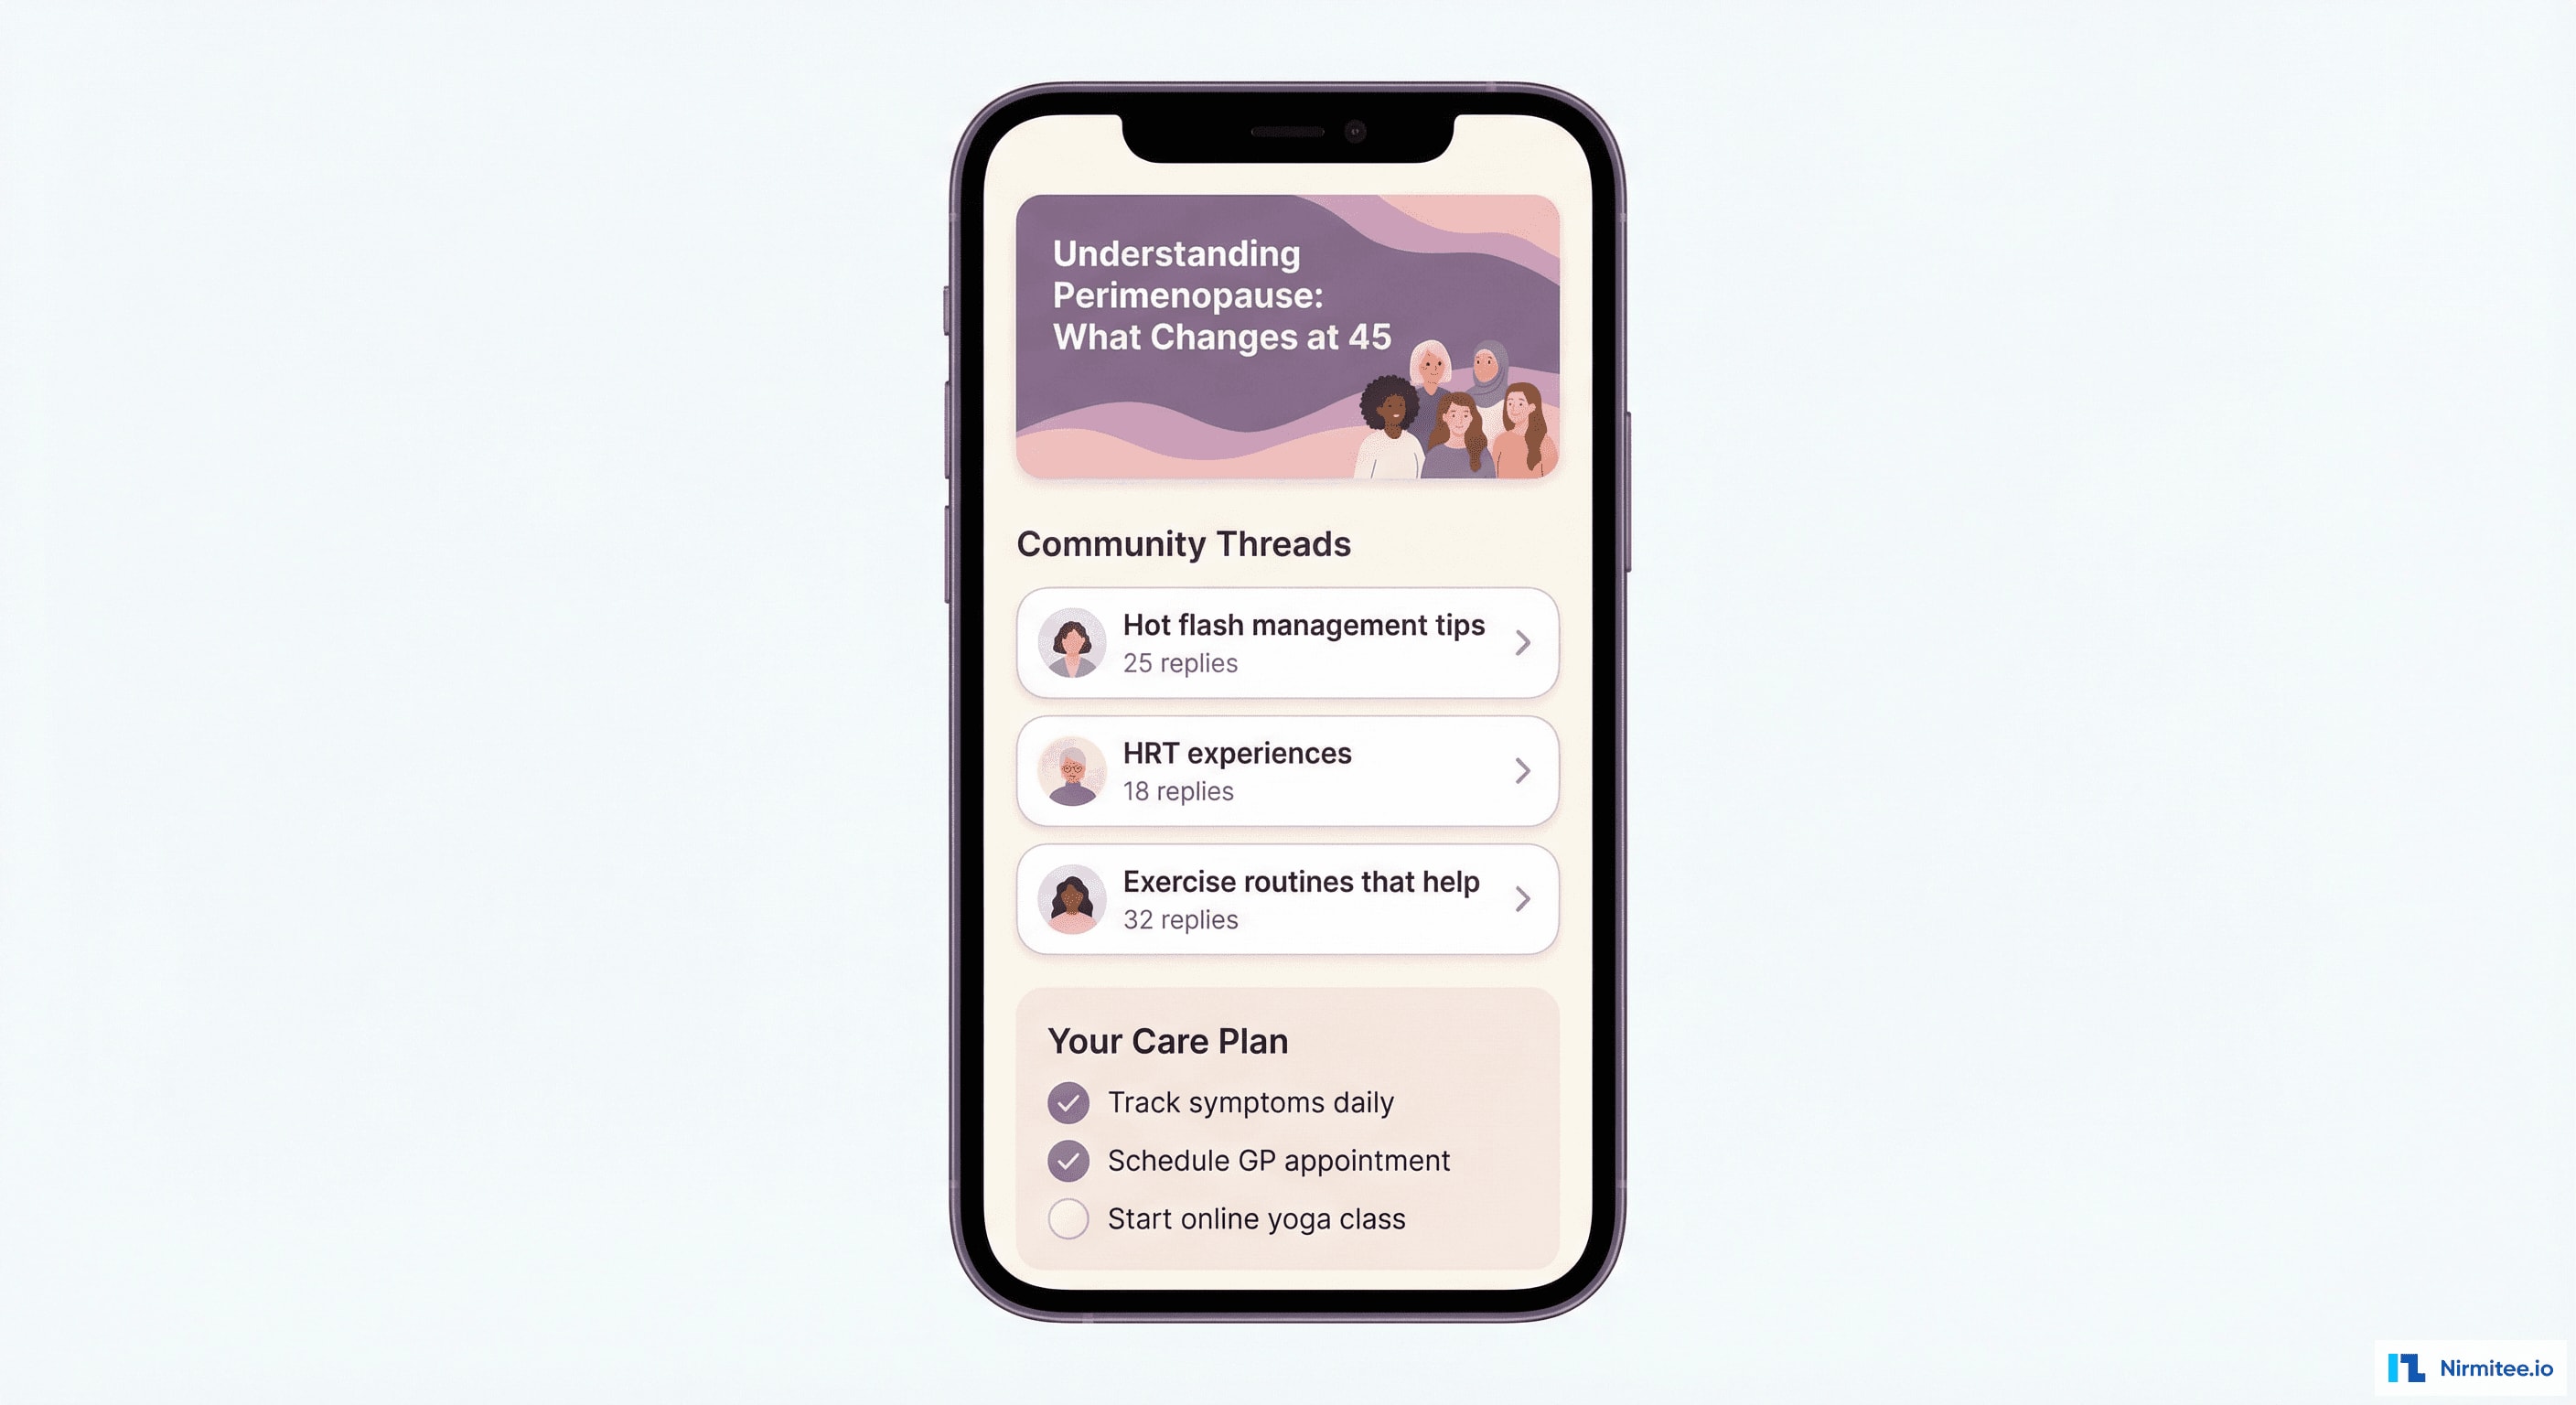
The Patient Mobile App

The patient app is designed to feel like a wellness companion, not a medical tool. Warm colors, empathetic language, and a daily rhythm of tracking and insights:
- Wellness Score (0-100): composite score based on symptom severity, sleep quality, activity level, and hormone trends — a single number that tells the patient "how am I doing?"
- Daily Symptom Logger: quick-tap logging for common menopause symptoms — hot flashes, night sweats, sleep disruption, mood changes, brain fog, joint pain, vaginal dryness. Severity levels with emoji-style indicators. Takes under 30 seconds/day.
- AI Insights: personalized daily cards — "Your hot flash frequency is down 40% this month", "Sleep quality improves on days you exercise", "Consider discussing estradiol adjustment with your provider"
- Wearable Data: automatic sync from Apple Watch, Oura Ring, and Fitbit — sleep stages, HRV, resting heart rate, skin temperature, activity minutes
- Community: moderated discussion forums, expert Q&As, and curated educational content about menopause stages, treatment options, and lifestyle strategies
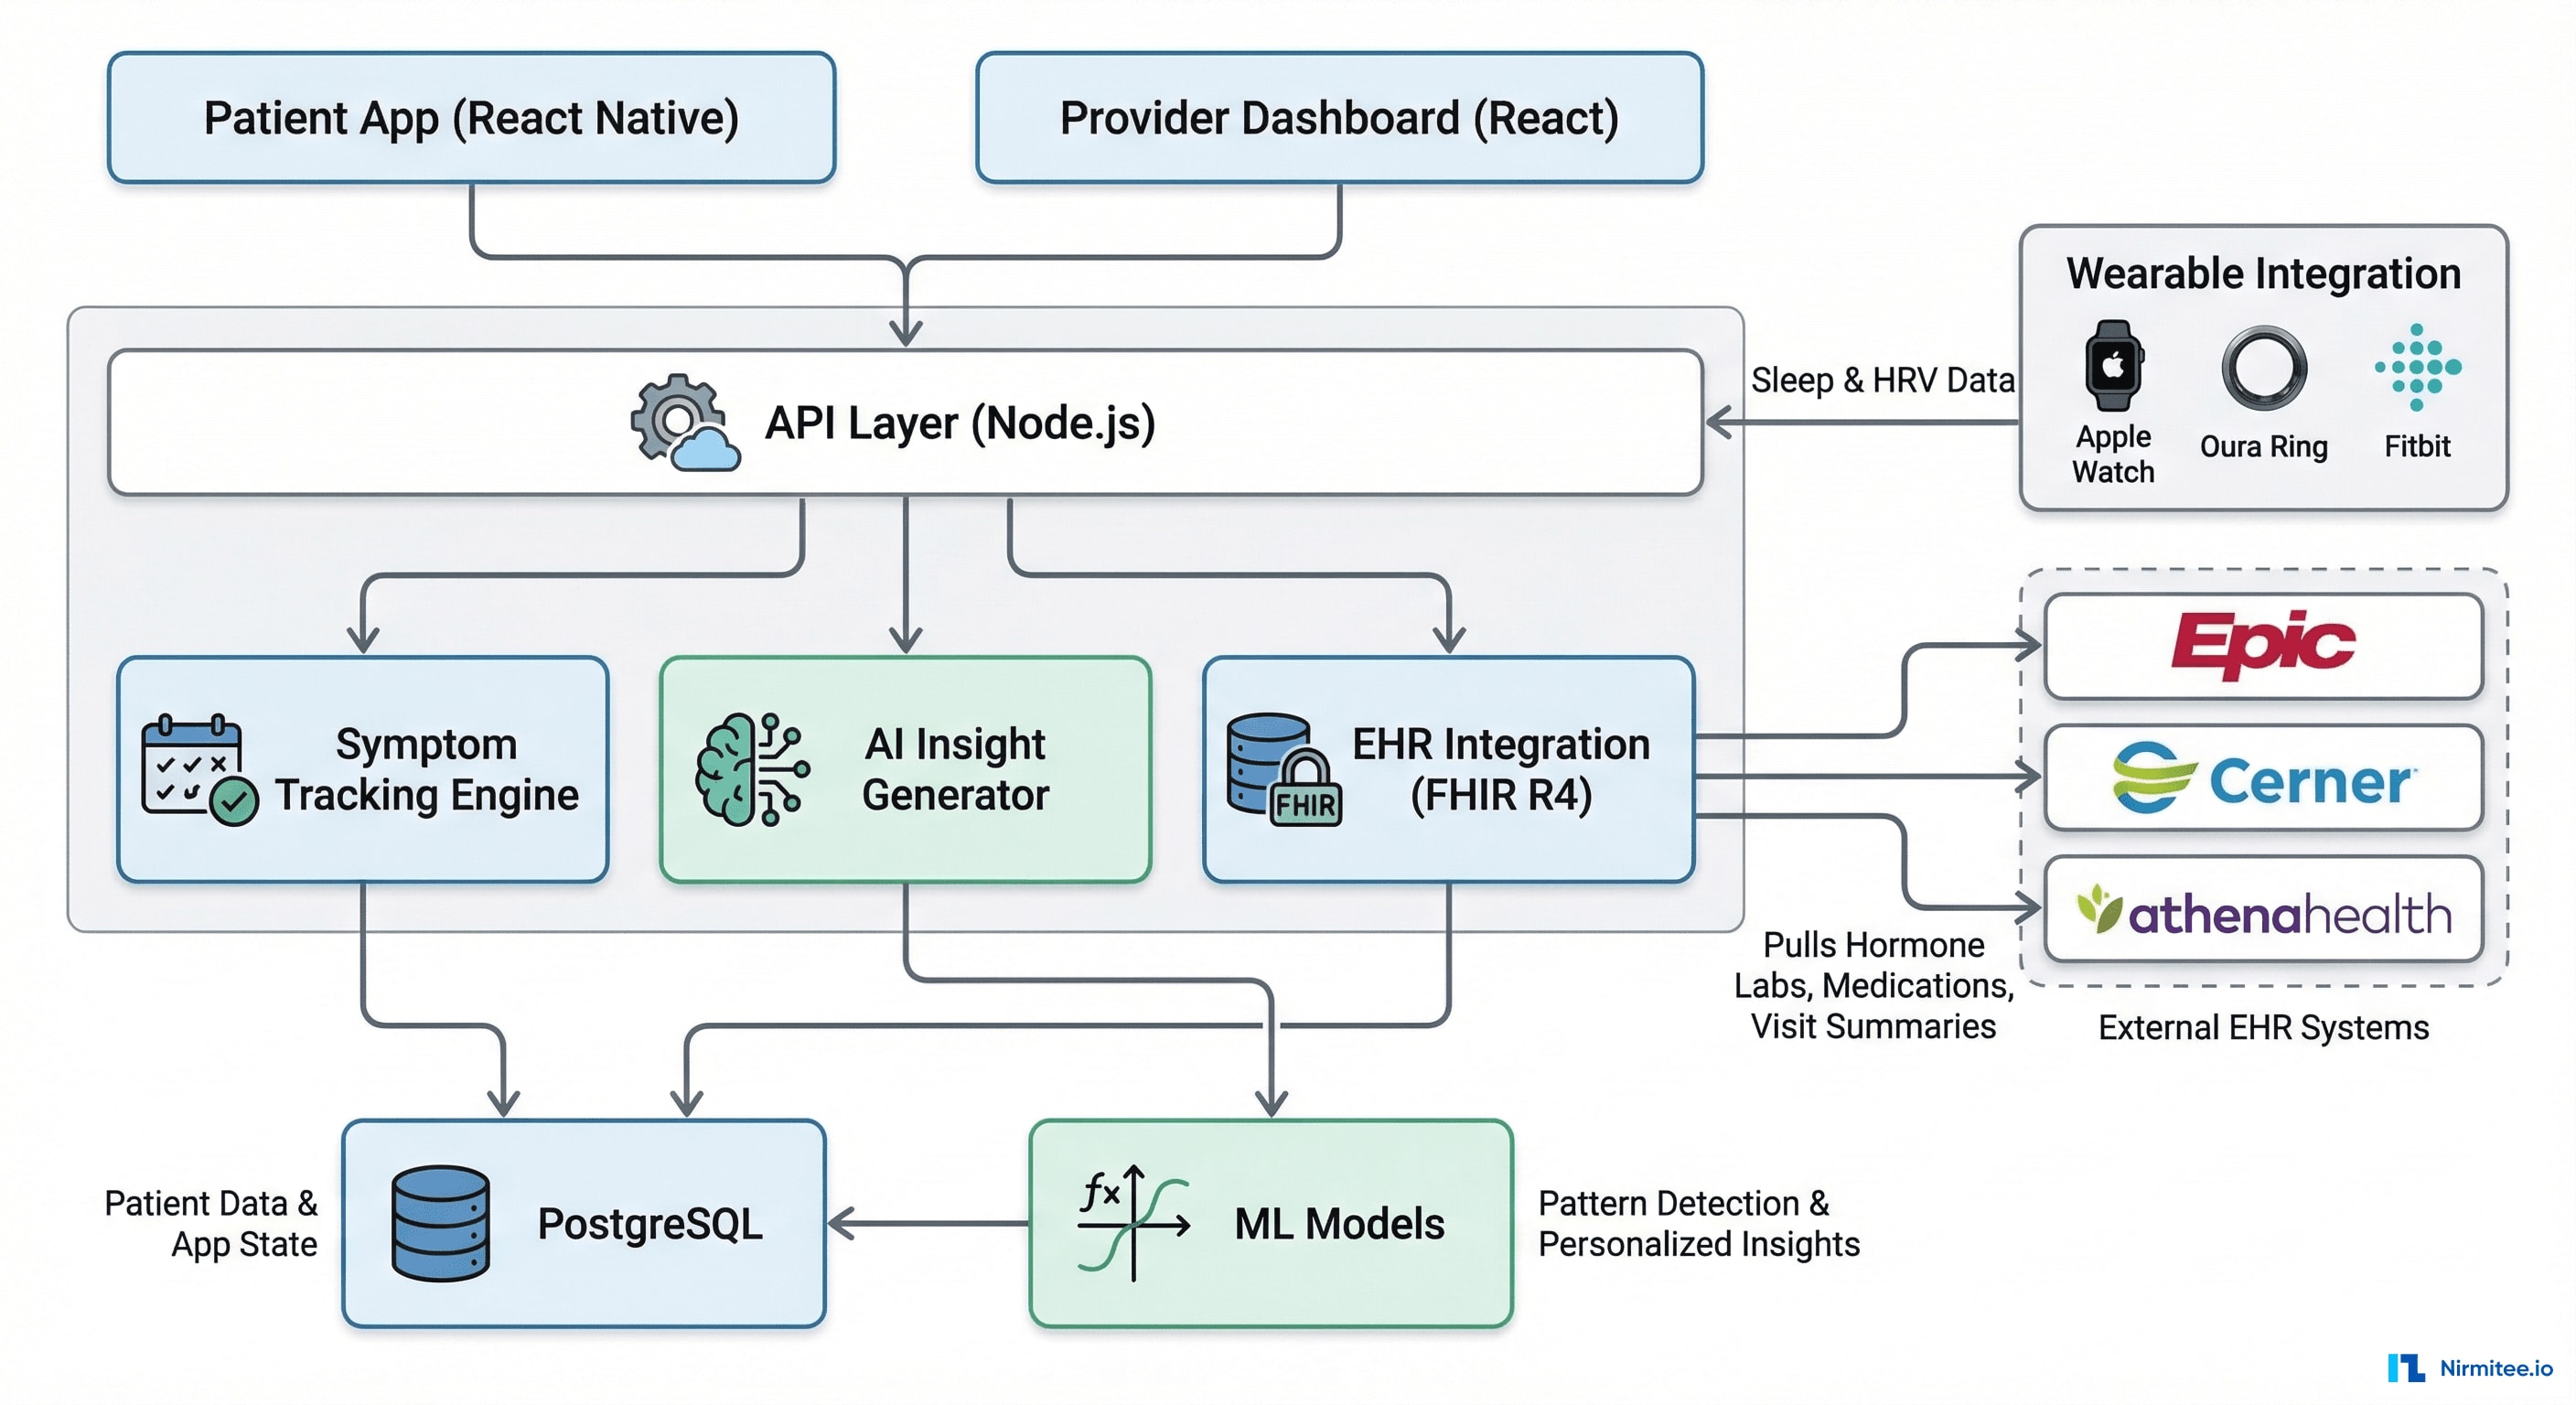
System Architecture
Technology Stack
| Layer | Technology | Purpose |
|---|---|---|
| Patient App | React Native (iOS + Android) | Symptom tracking, insights, community, wearable sync |
| Provider Dashboard | React + TypeScript | Patient cohort view, treatment plans, analytics |
| Backend | Node.js (Express) | API gateway, business logic, wearable data ingestion |
| Database | PostgreSQL | Patient profiles, symptom logs, clinical data |
| AI/ML | Python (scikit-learn, TensorFlow) | Pattern detection, treatment optimization, risk prediction |
| EHR Integration | FHIR R4 (Epic, Cerner, athena) | Hormone labs, medications, visit summaries |
| Wearables | HealthKit, Oura API, Fitbit API | Sleep, HRV, temperature, activity data |
| Infrastructure | AWS (HIPAA BAA) | US data residency, encrypted storage |
Provider Dashboard
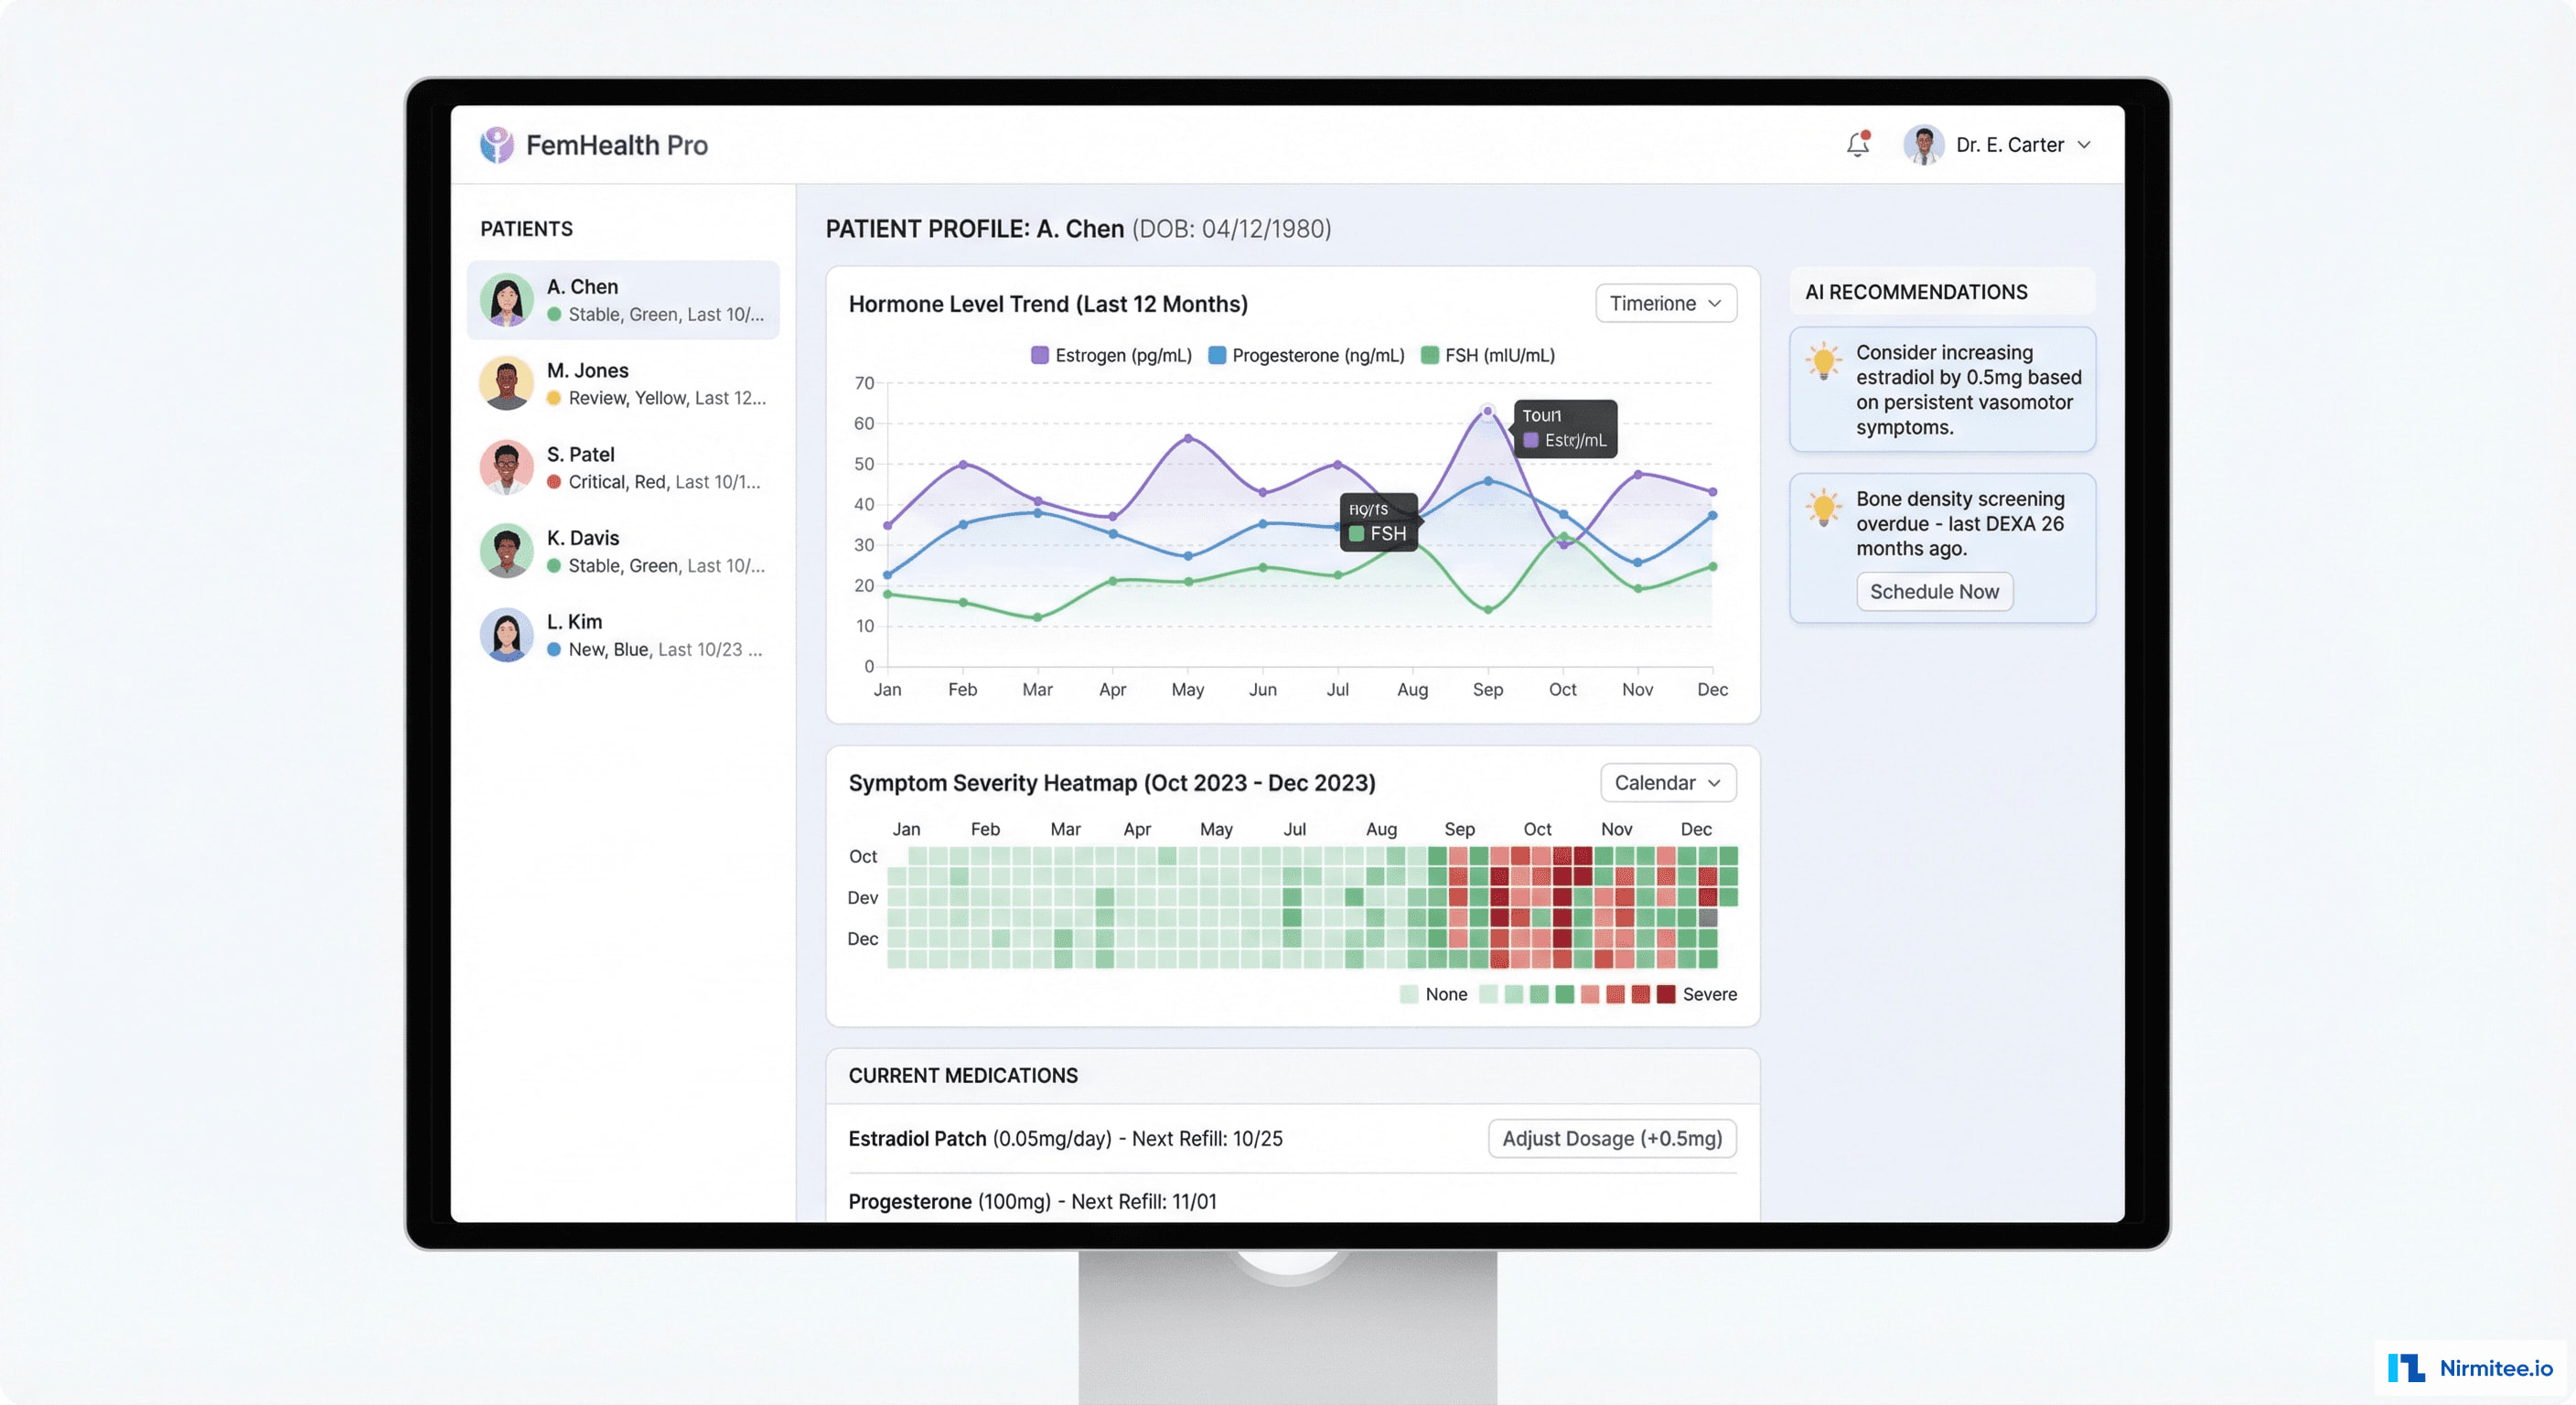
The provider dashboard gives clinicians a view of their patient's menopause journey that no traditional EHR provides:
- Hormone Level Trends: estrogen, progesterone, and FSH plotted over 12+ months with treatment change markers — showing exactly how hormone levels respond to dosage adjustments
- Symptom Severity Heatmap: calendar view showing daily symptom severity with color coding — instantly revealing patterns, cycles, and improvement trends
- Medication Timeline: every treatment change with dosage, start/stop dates, and the corresponding symptom response — enabling data-driven titration
- AI Recommendations: evidence-based suggestions like "Consider increasing estradiol by 0.5mg — persistent vasomotor symptoms despite 3 months on current dose" or "Bone density screening overdue — last DEXA 26 months ago"
- Wearable Data Integration: sleep quality trends, HRV patterns, and activity levels correlated with symptom data
AI Pattern Detection
The AI engine analyzes continuous data from symptoms, wearables, and clinical records to find patterns invisible to manual observation:
- "Hot flashes correlate with stress levels (r=0.72)" — discovered by correlating self-reported stress scores with hot flash frequency. Patients who managed stress saw 30% fewer hot flashes.
- "Sleep disruption peaks 3 days before period" — for perimenopausal women still cycling, predictive alerts allow preemptive sleep hygiene interventions.
- "Joint pain improves with exercise days" — correlation between activity minutes (from wearable) and next-day joint pain severity. Personalized exercise recommendations.
- Treatment response prediction: based on a patient's symptom profile, hormone levels, and genetic risk factors, the AI predicts which HRT regimen is most likely to be effective — reducing the trial-and-error period.
Education & Community
Menopause is isolating for many women — they don't know what's normal, what to expect, or who to talk to. The platform includes:
- Curated content library: evidence-based articles on perimenopause, menopause stages, HRT options, non-hormonal treatments, lifestyle strategies, and mental health
- Community forums: moderated discussion groups where women share experiences, tips, and support
- Personalized care plans: AI-generated daily checklists based on the patient's treatment plan, symptom patterns, and provider recommendations
EHR Integration
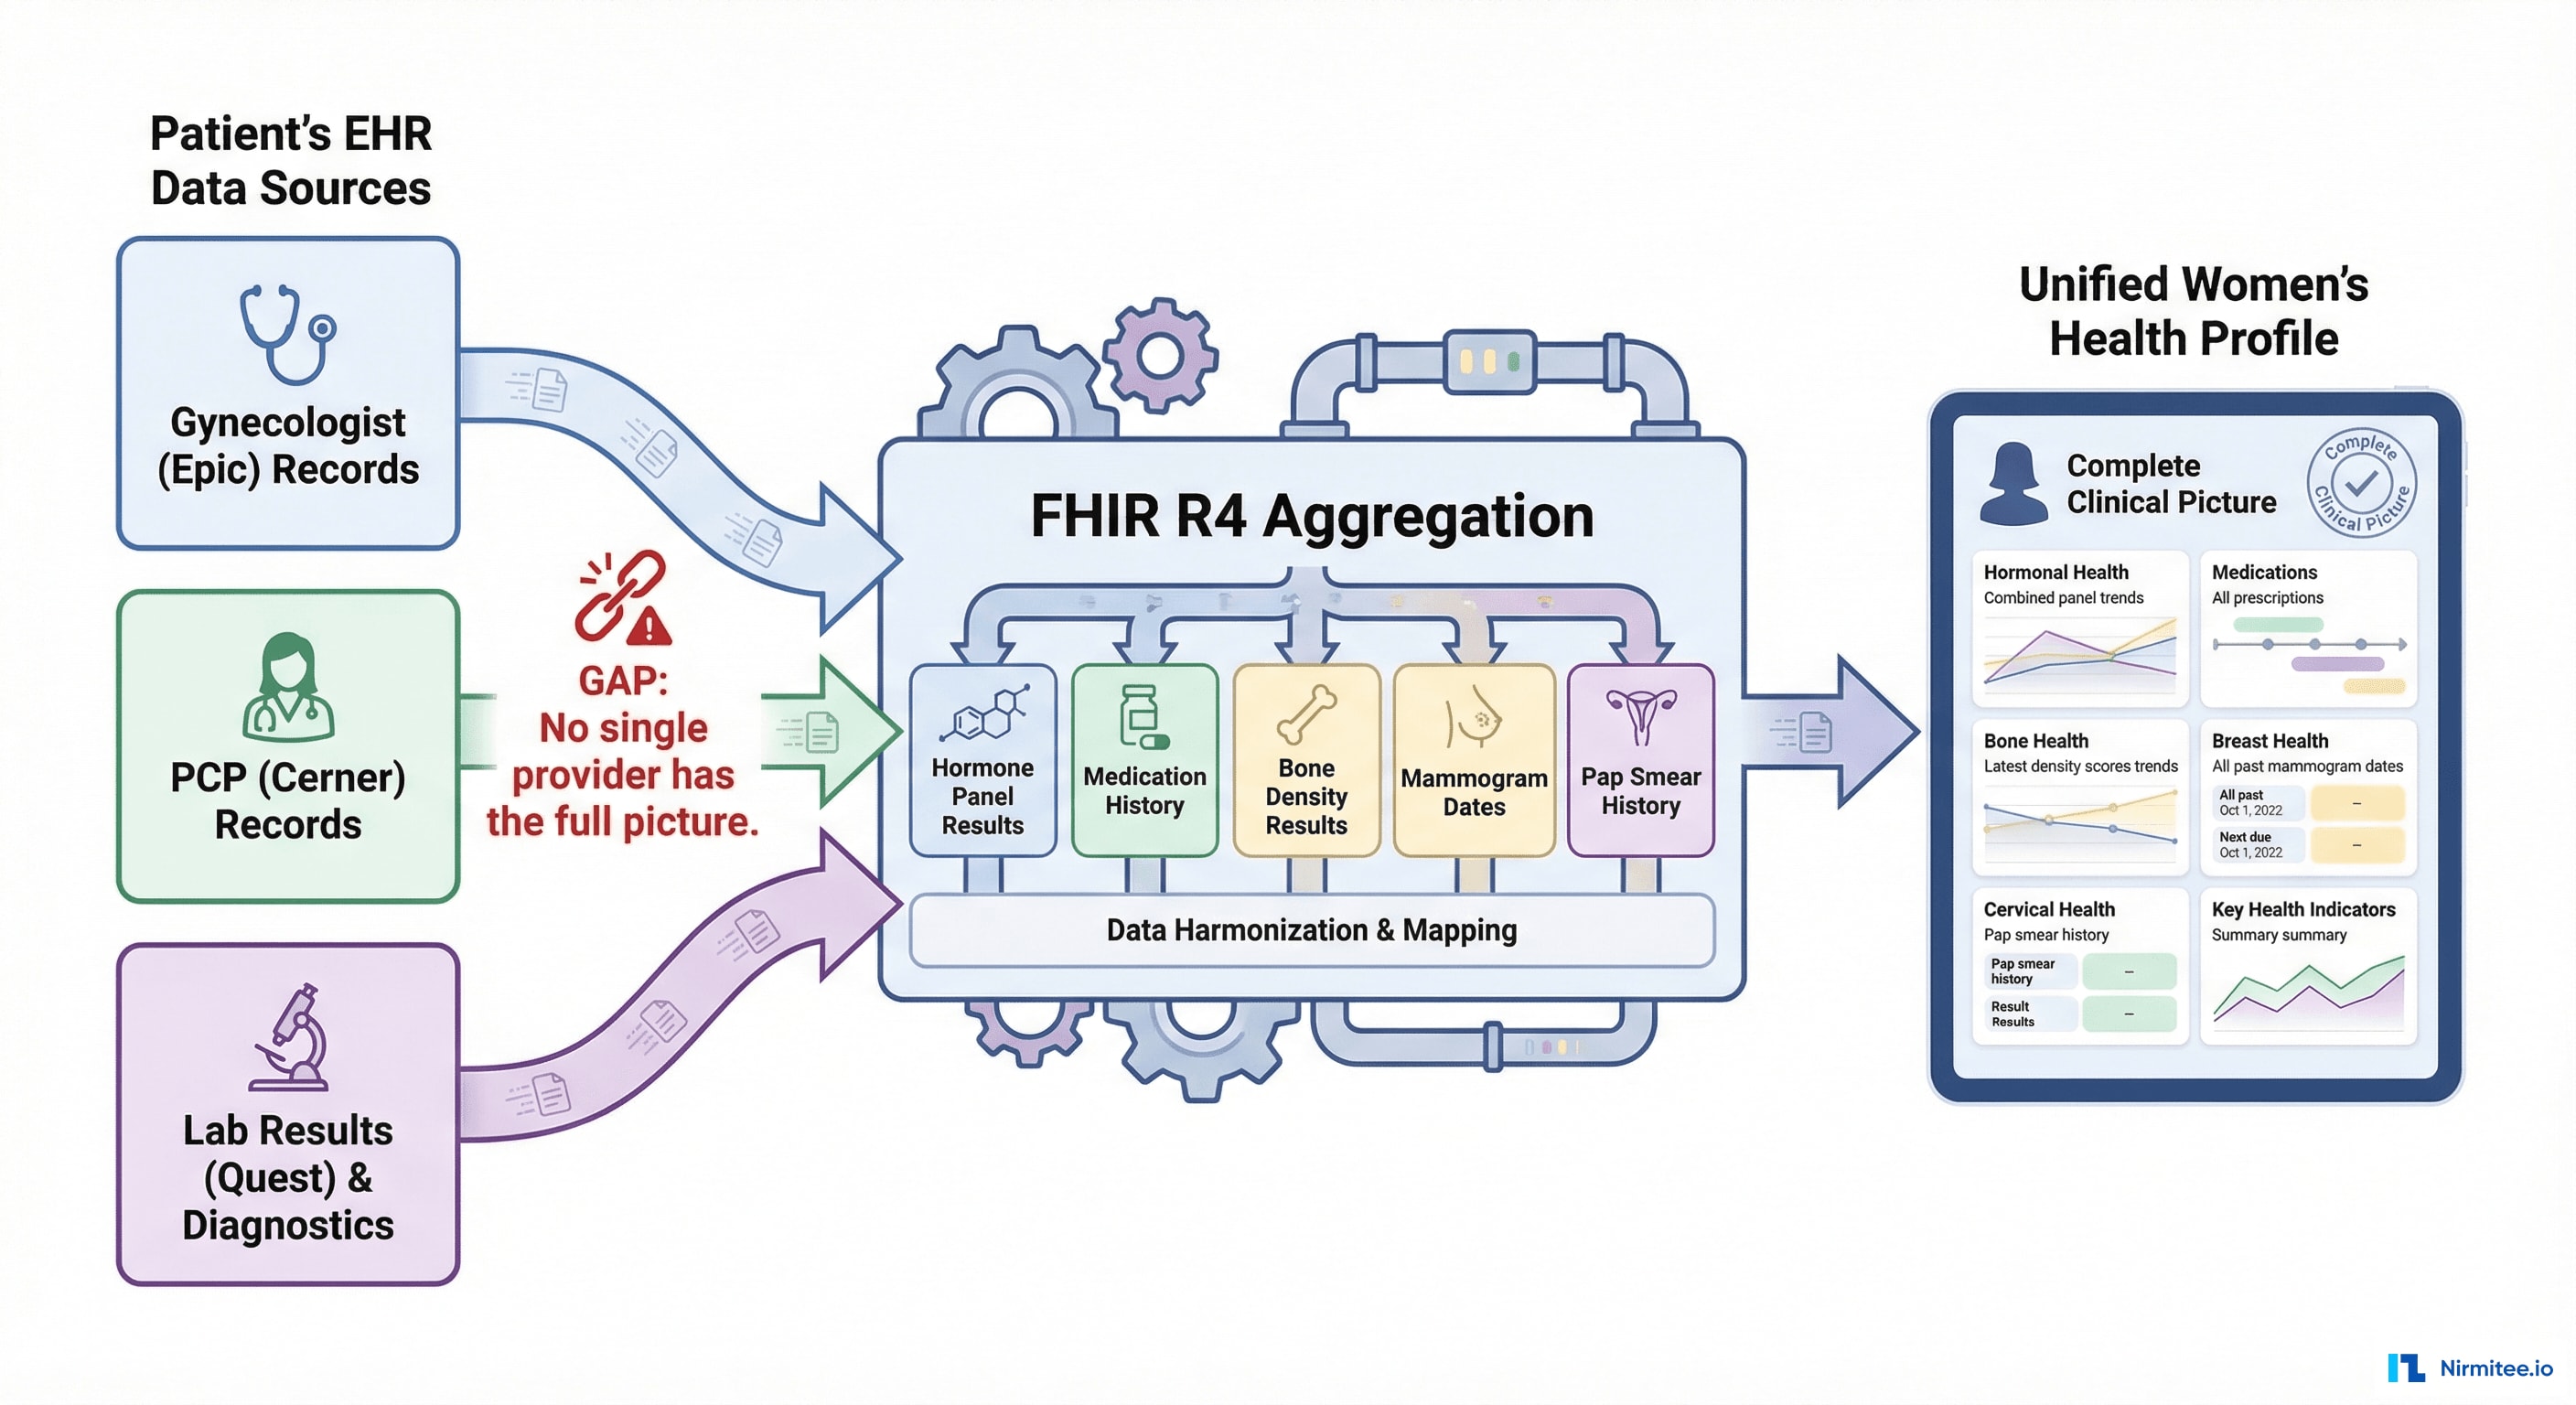
The platform connects to the patient's existing healthcare providers via FHIR R4, pulling:
- Hormone Panel Results: FSH, estradiol, progesterone, testosterone, DHEA-S, thyroid panel from lab orders
- Medication History: current and past HRT prescriptions, antidepressants, supplements
- Bone Density: DEXA scan results for osteoporosis risk tracking
- Screening History: mammogram dates, Pap smear results, colonoscopy status
- Visit Summaries: clinical notes from gynecology, PCP, and specialist visits
This unified view means the platform knows more about the patient's menopause journey than any single provider.
Wearable Integration
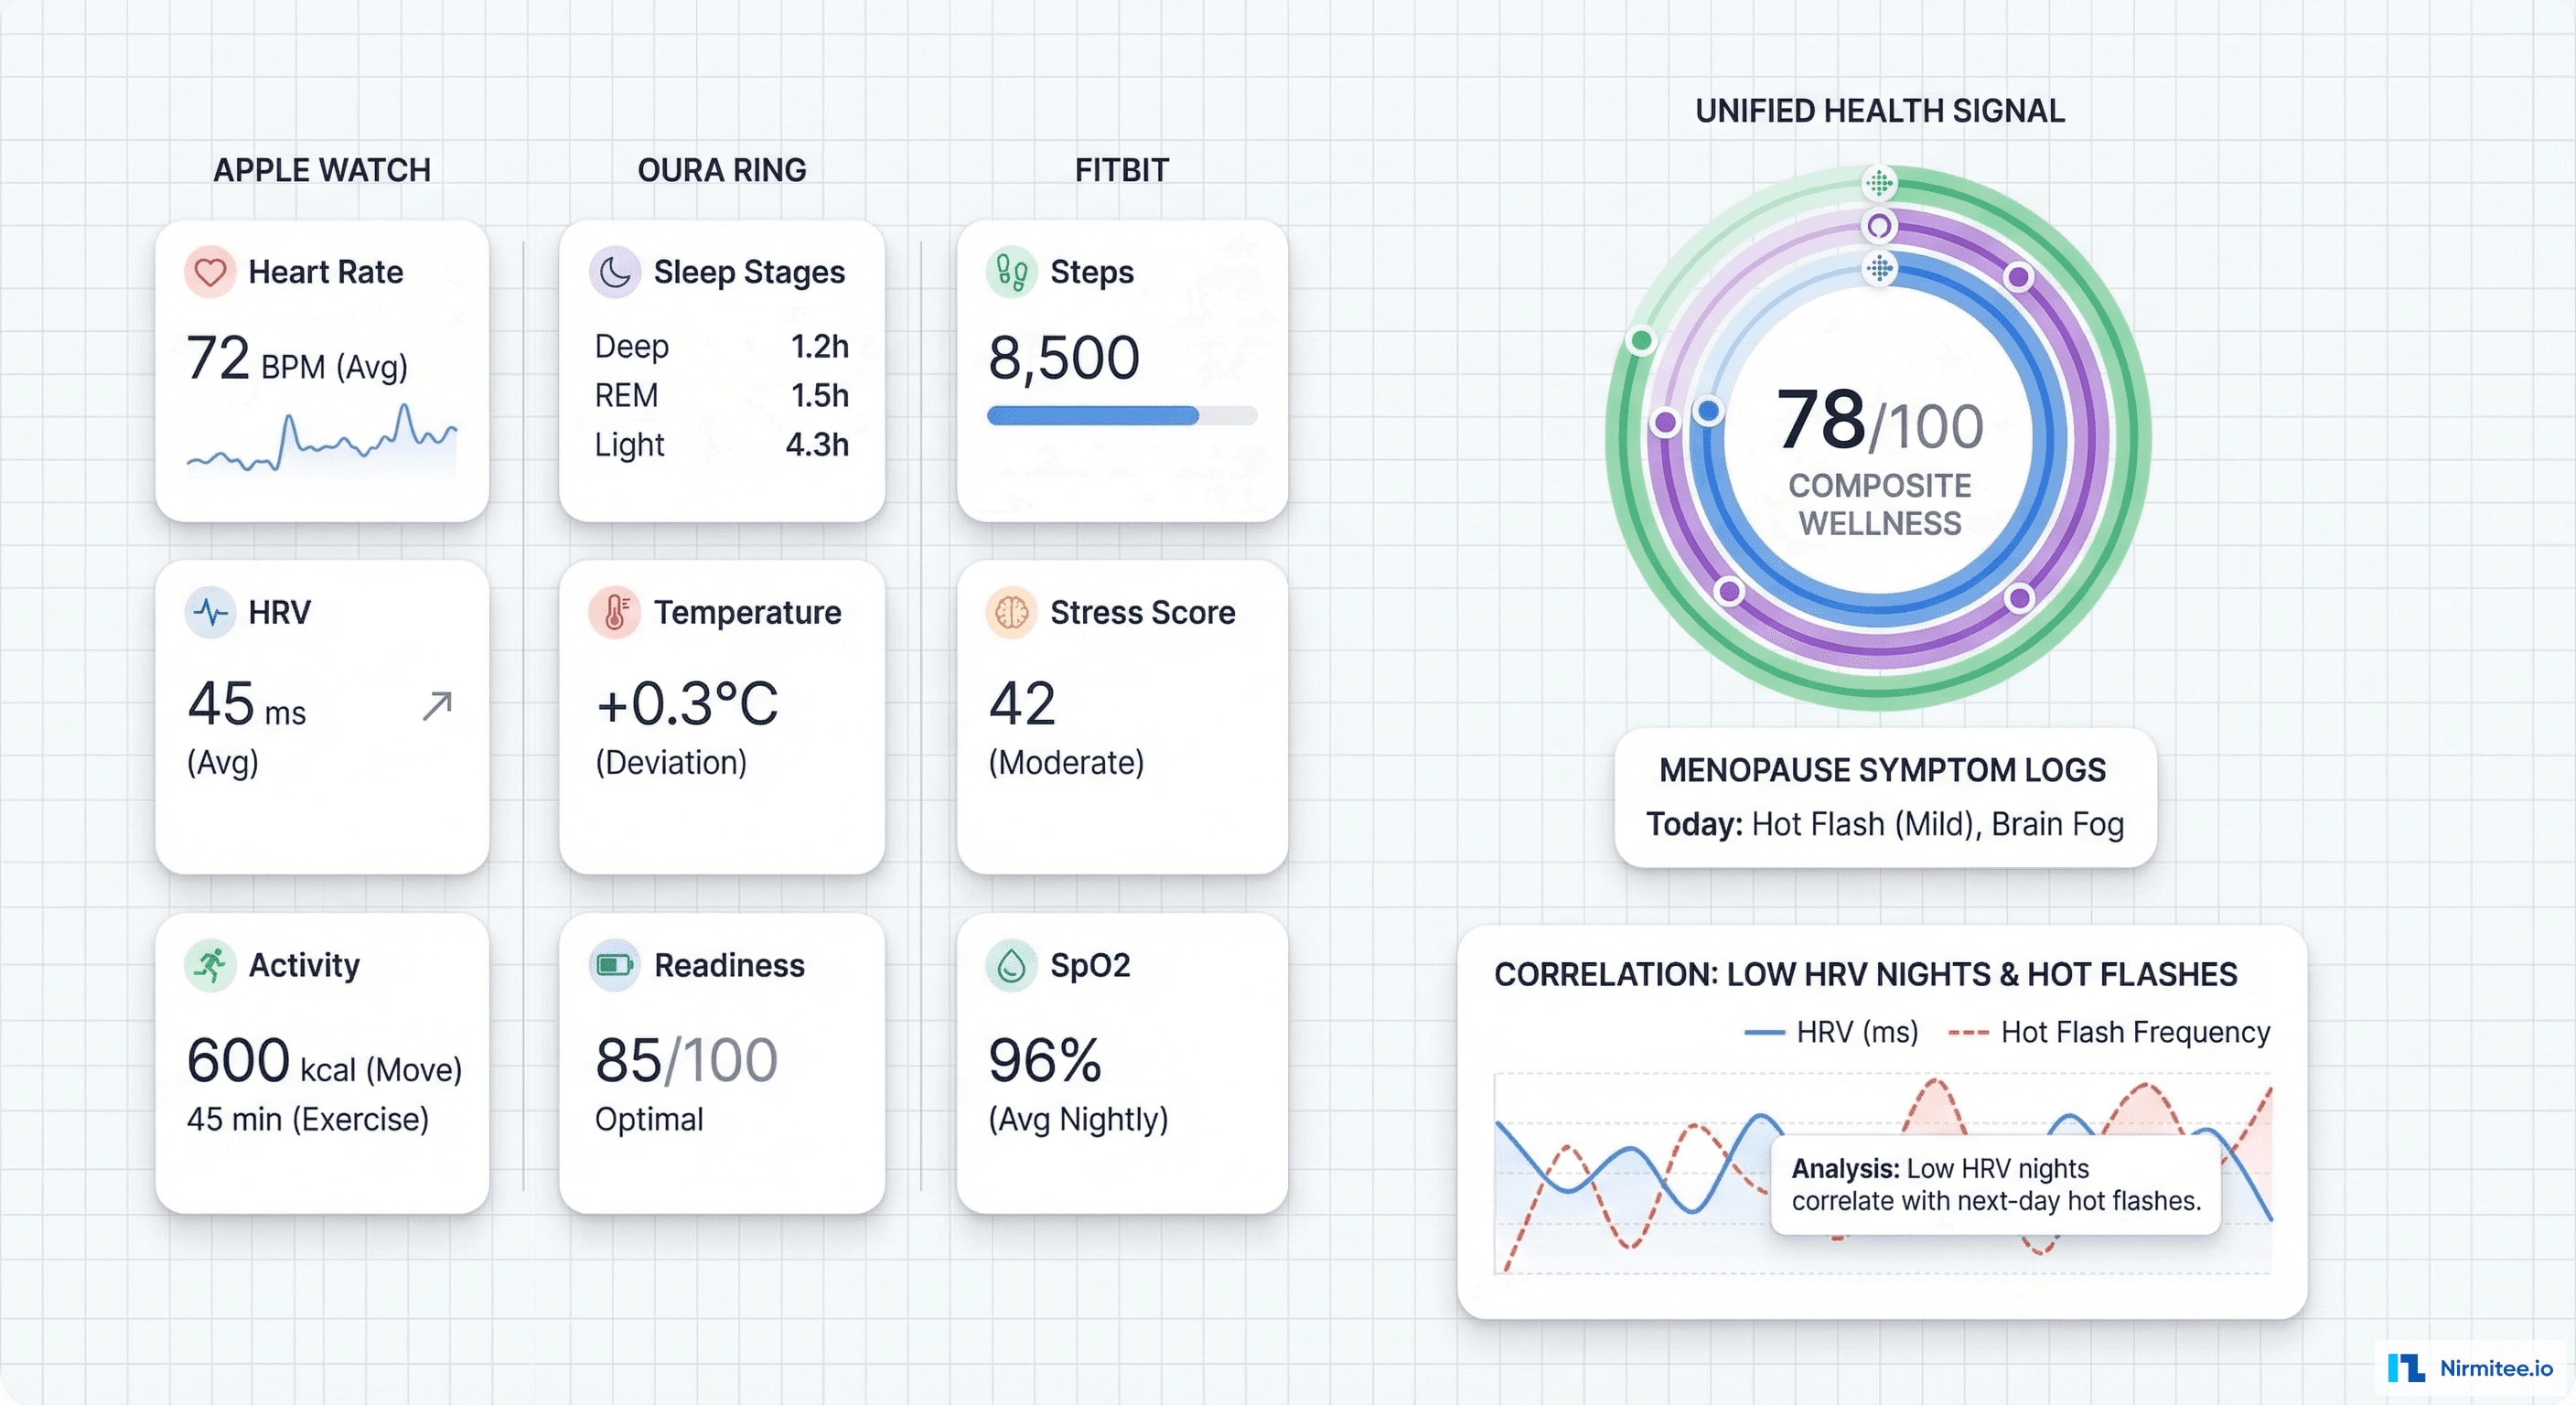
Three wearable ecosystems feed objective health data into the platform:
| Device | Data Points | Clinical Relevance |
|---|---|---|
| Apple Watch | Heart rate, HRV, activity, sleep, cycle tracking | Cardiovascular health, stress response, activity levels |
| Oura Ring | Sleep stages, skin temperature, readiness score | Night sweat detection (temperature spikes), sleep quality, recovery |
| Fitbit | Steps, stress score, SpO2, sleep | Activity levels, stress management, overall wellness |
The AI correlates wearable data with symptom logs — for example, nights with low HRV predict next-day hot flash severity with 78% accuracy. This enables proactive interventions.
Results

| Metric | Before Platform | With Platform | Improvement |
|---|---|---|---|
| Time to effective treatment | 8-14 months (trial & error) | 2-3 months (AI-guided) | 4x faster |
| Hot flash reduction | Gradual over 6+ months | 40% reduction in 8 weeks | Accelerated relief |
| Overall symptom improvement | Variable | 73% improvement at 6 months | 73% better |
| Patient satisfaction | 52% (fragmented care) | 89% | 37 point increase |
| Provider visit efficiency | 15 min (rebuilding context) | 8 min (data available pre-visit) | 47% more efficient |
| Symptom tracking compliance | ~15% (paper diaries) | 82% daily logging | 5.5x engagement |
| Preventive screening compliance | 64% | 91% (automated reminders) | 42% improvement |
Timeline
| Phase | Duration | Deliverables |
|---|---|---|
| Phase 1 | 6 weeks | Patient mobile app (symptom tracking, daily insights), basic AI engine, PostgreSQL backend |
| Phase 2 | 6 weeks | EHR integration (Epic + Cerner), wearable connections (Apple Watch, Oura), provider dashboard |
| Phase 3 | 6 weeks | Advanced AI (pattern detection, treatment optimization), community features, education content |
| Phase 4 | 4 weeks | athena EHR integration, Fitbit connection, compliance audit, beta launch with 200 patients |
Total: 5.5 months with 3 engineers + 1 ML engineer + 1 clinical advisor.
Lessons Learned
- Design for daily habits, not medical workflows. The symptom logger succeeds because it takes 30 seconds and feels like a wellness check-in, not a clinical form. 82% daily compliance proves the UX approach.
- Wearable data fills the gap between clinic visits. Providers only see patients every 3-6 months. Wearable data provides continuous physiological signals that transform follow-up visits from "how have you been?" to "I can see your sleep improved after the dosage change."
- AI patterns build physician trust when they're actionable. "Stress correlates with hot flashes" is interesting. "Patient X should try stress management techniques — here's the evidence from her own data" is actionable. Always connect patterns to clinical decisions.
- Community reduces churn. Patients who engage with community features have 3x higher retention than those who only use the clinical features. Menopause is isolating — connection keeps patients on the platform.
Share
Related Case Studies
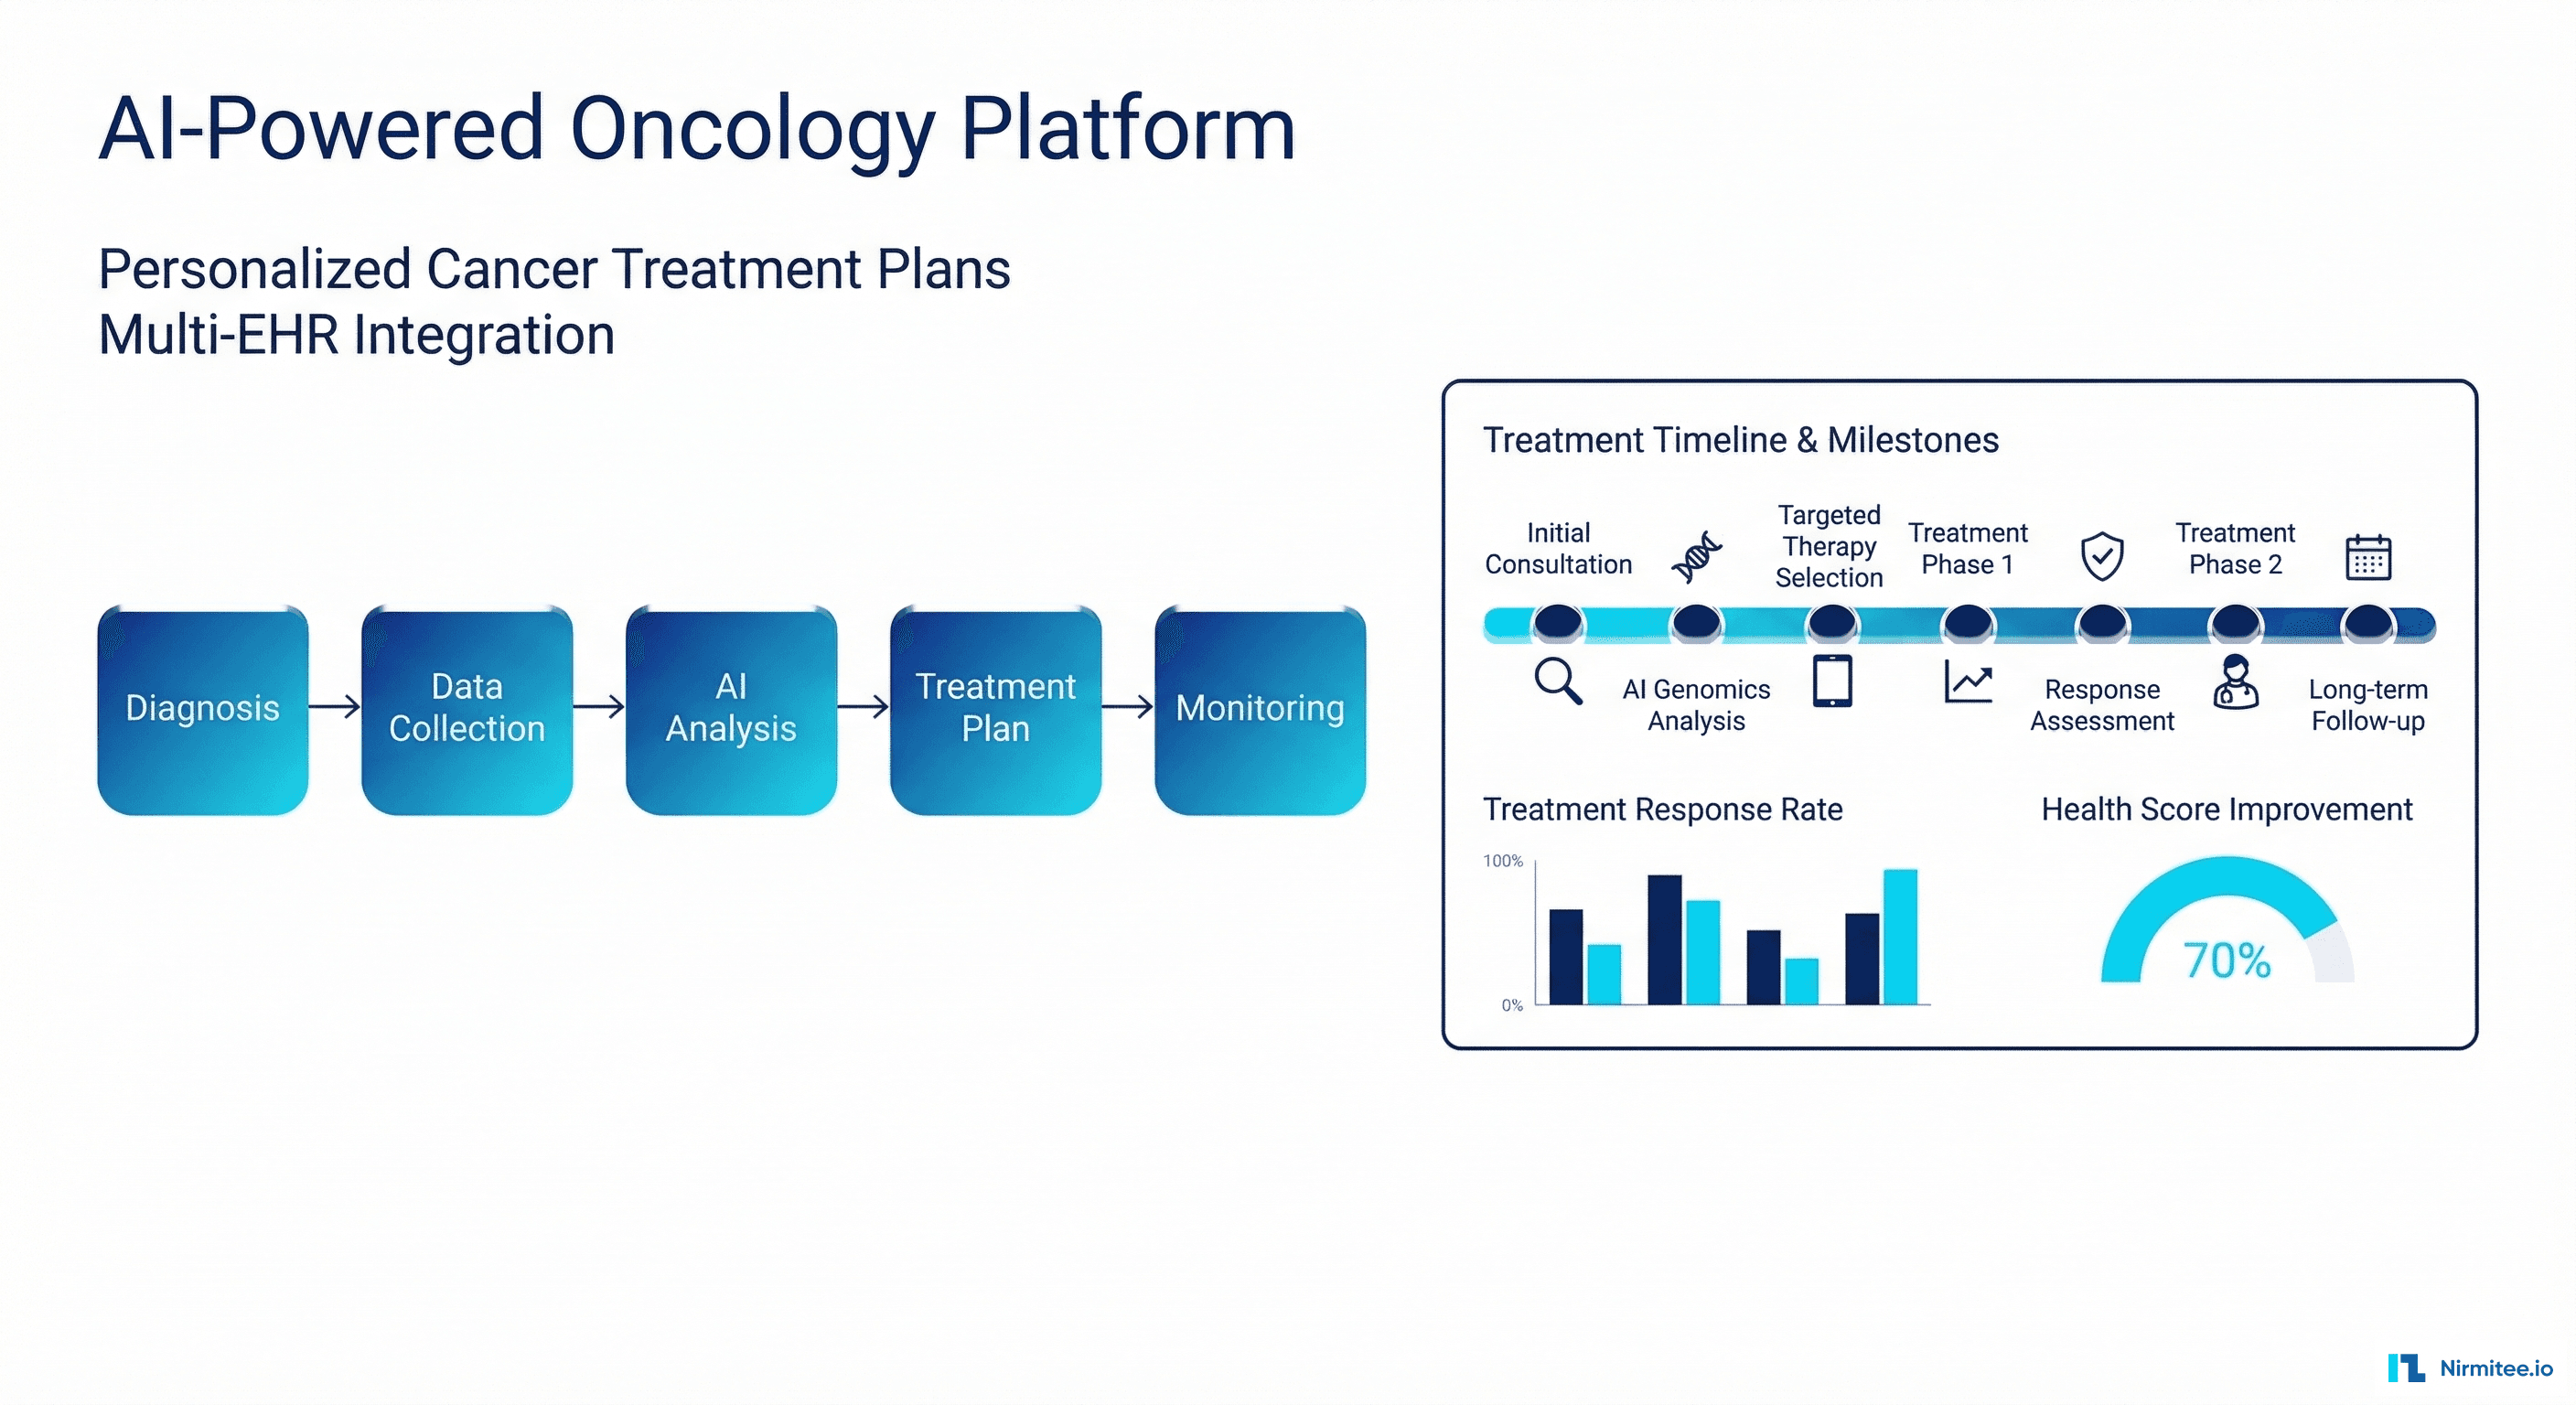
AI-Powered Personalized Oncology Treatment Platform: A Technical Case Study
Building a Patient-First Health Record Platform: Connecting 12 US EMRs Into One View