Executive Summary
A US wound care specialty practice managing 2,400+ active wounds across 3 clinic locations had outgrown their generic EHR. Standard EHR systems treat wounds as a free-text note — no structured wound measurements, no photo management, no healing trend tracking, no wound-specific treatment protocols. The practice needed a purpose-built system.
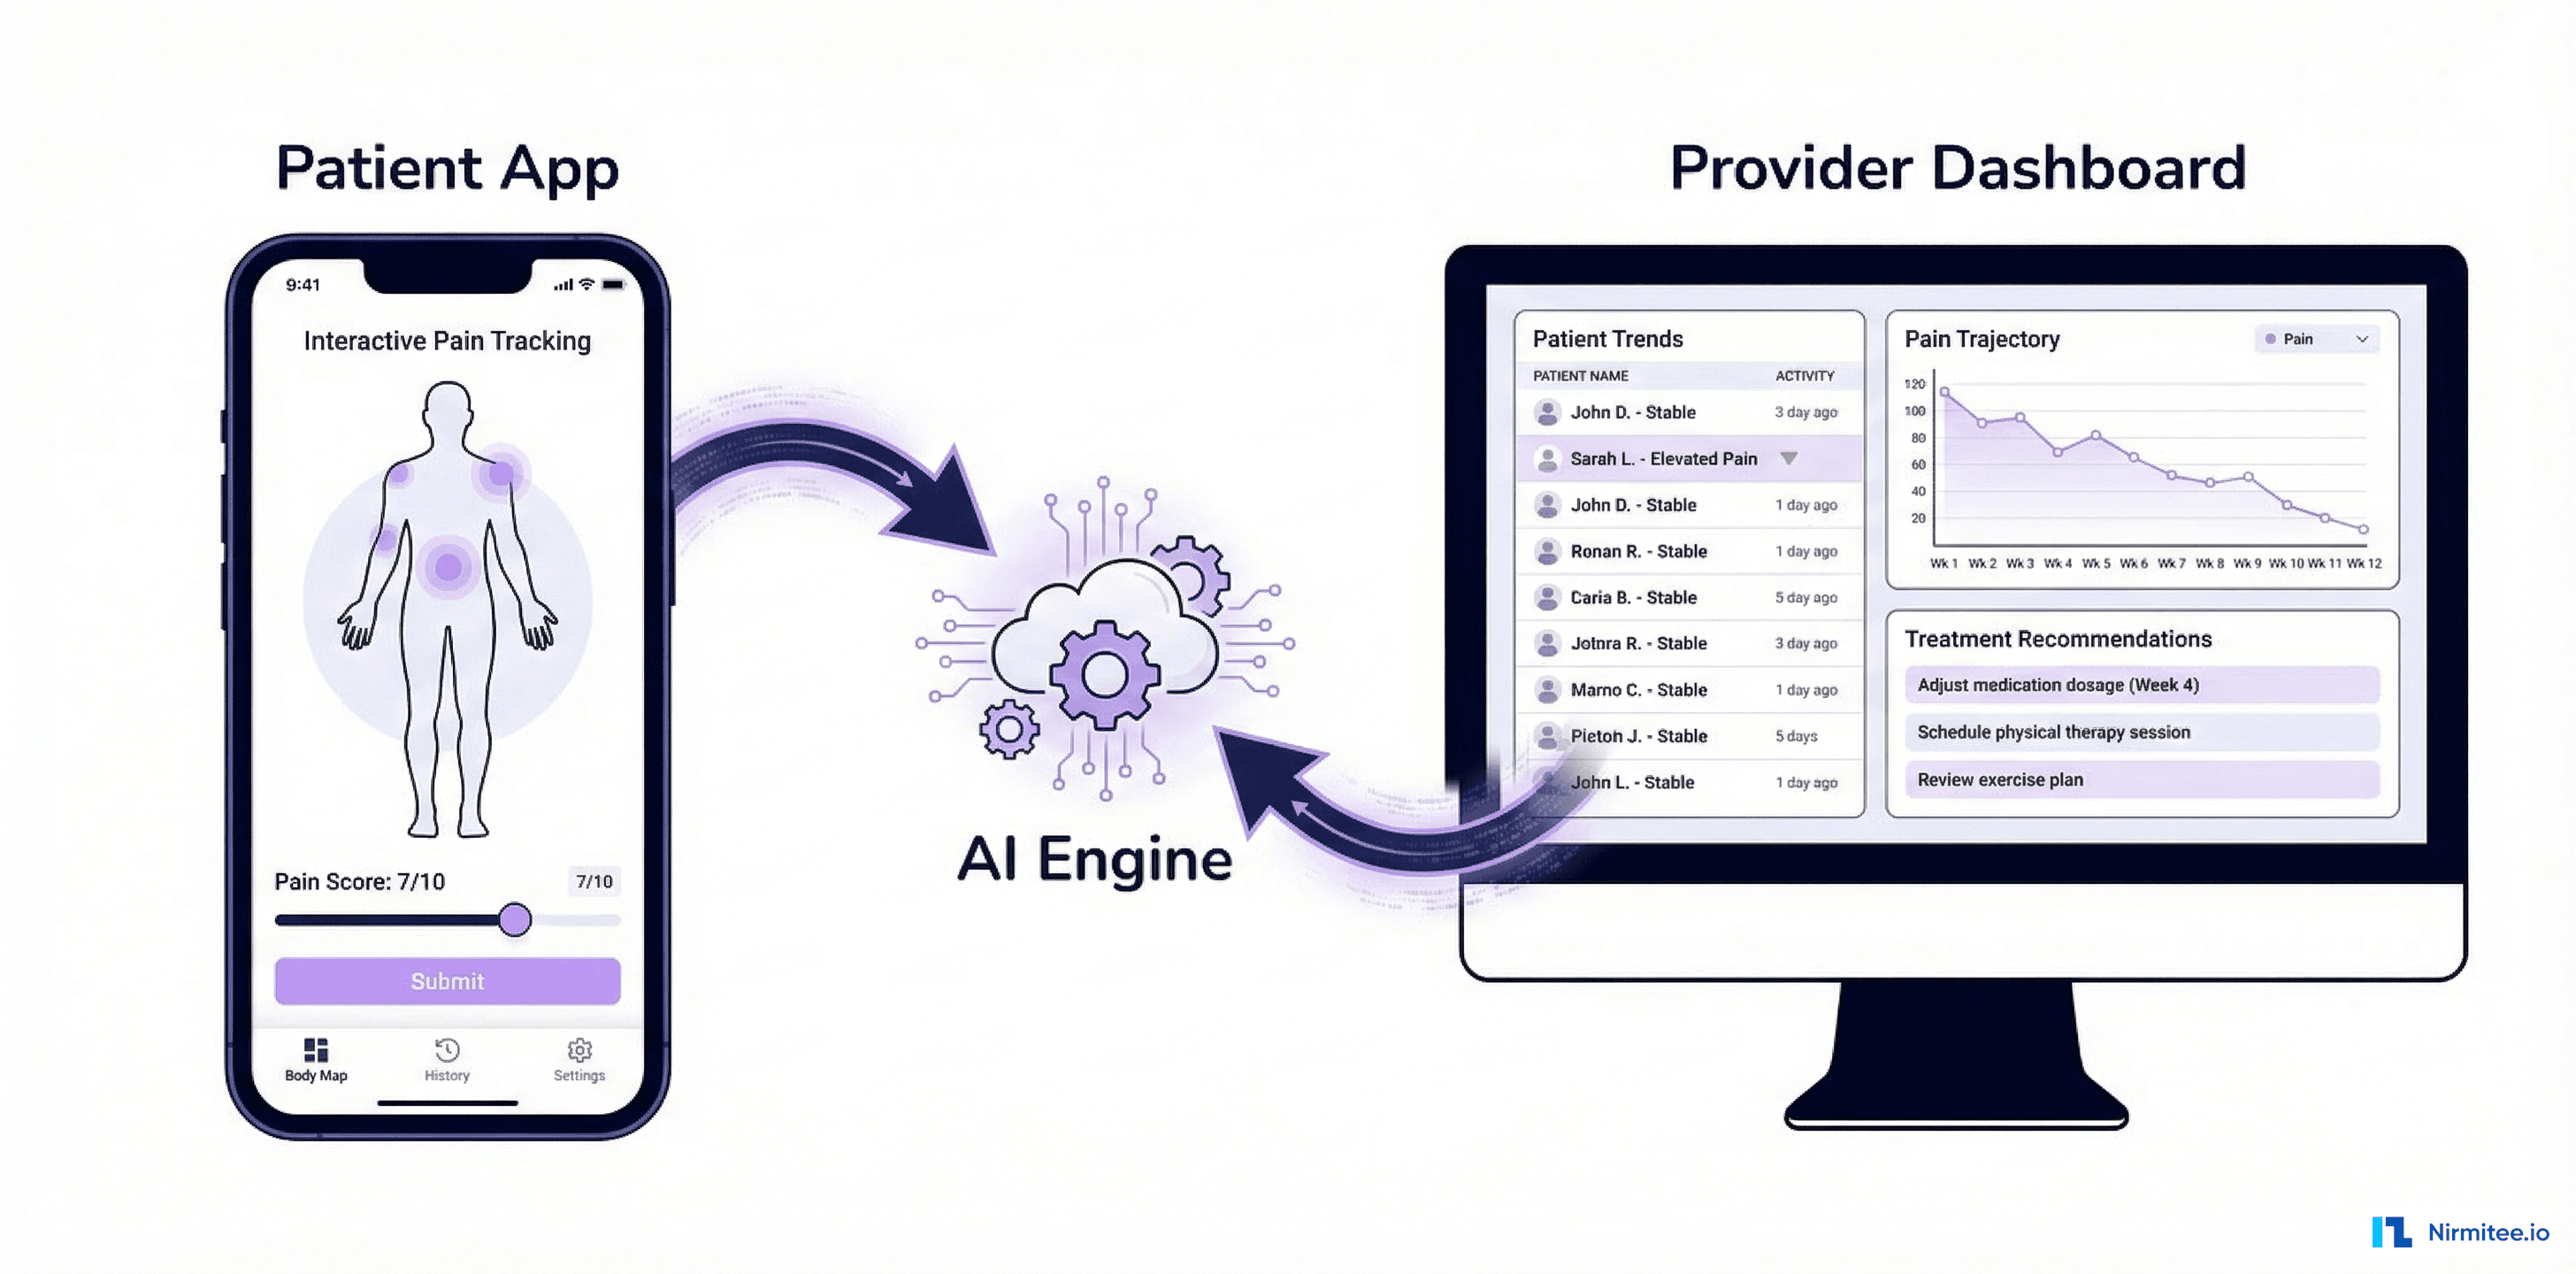
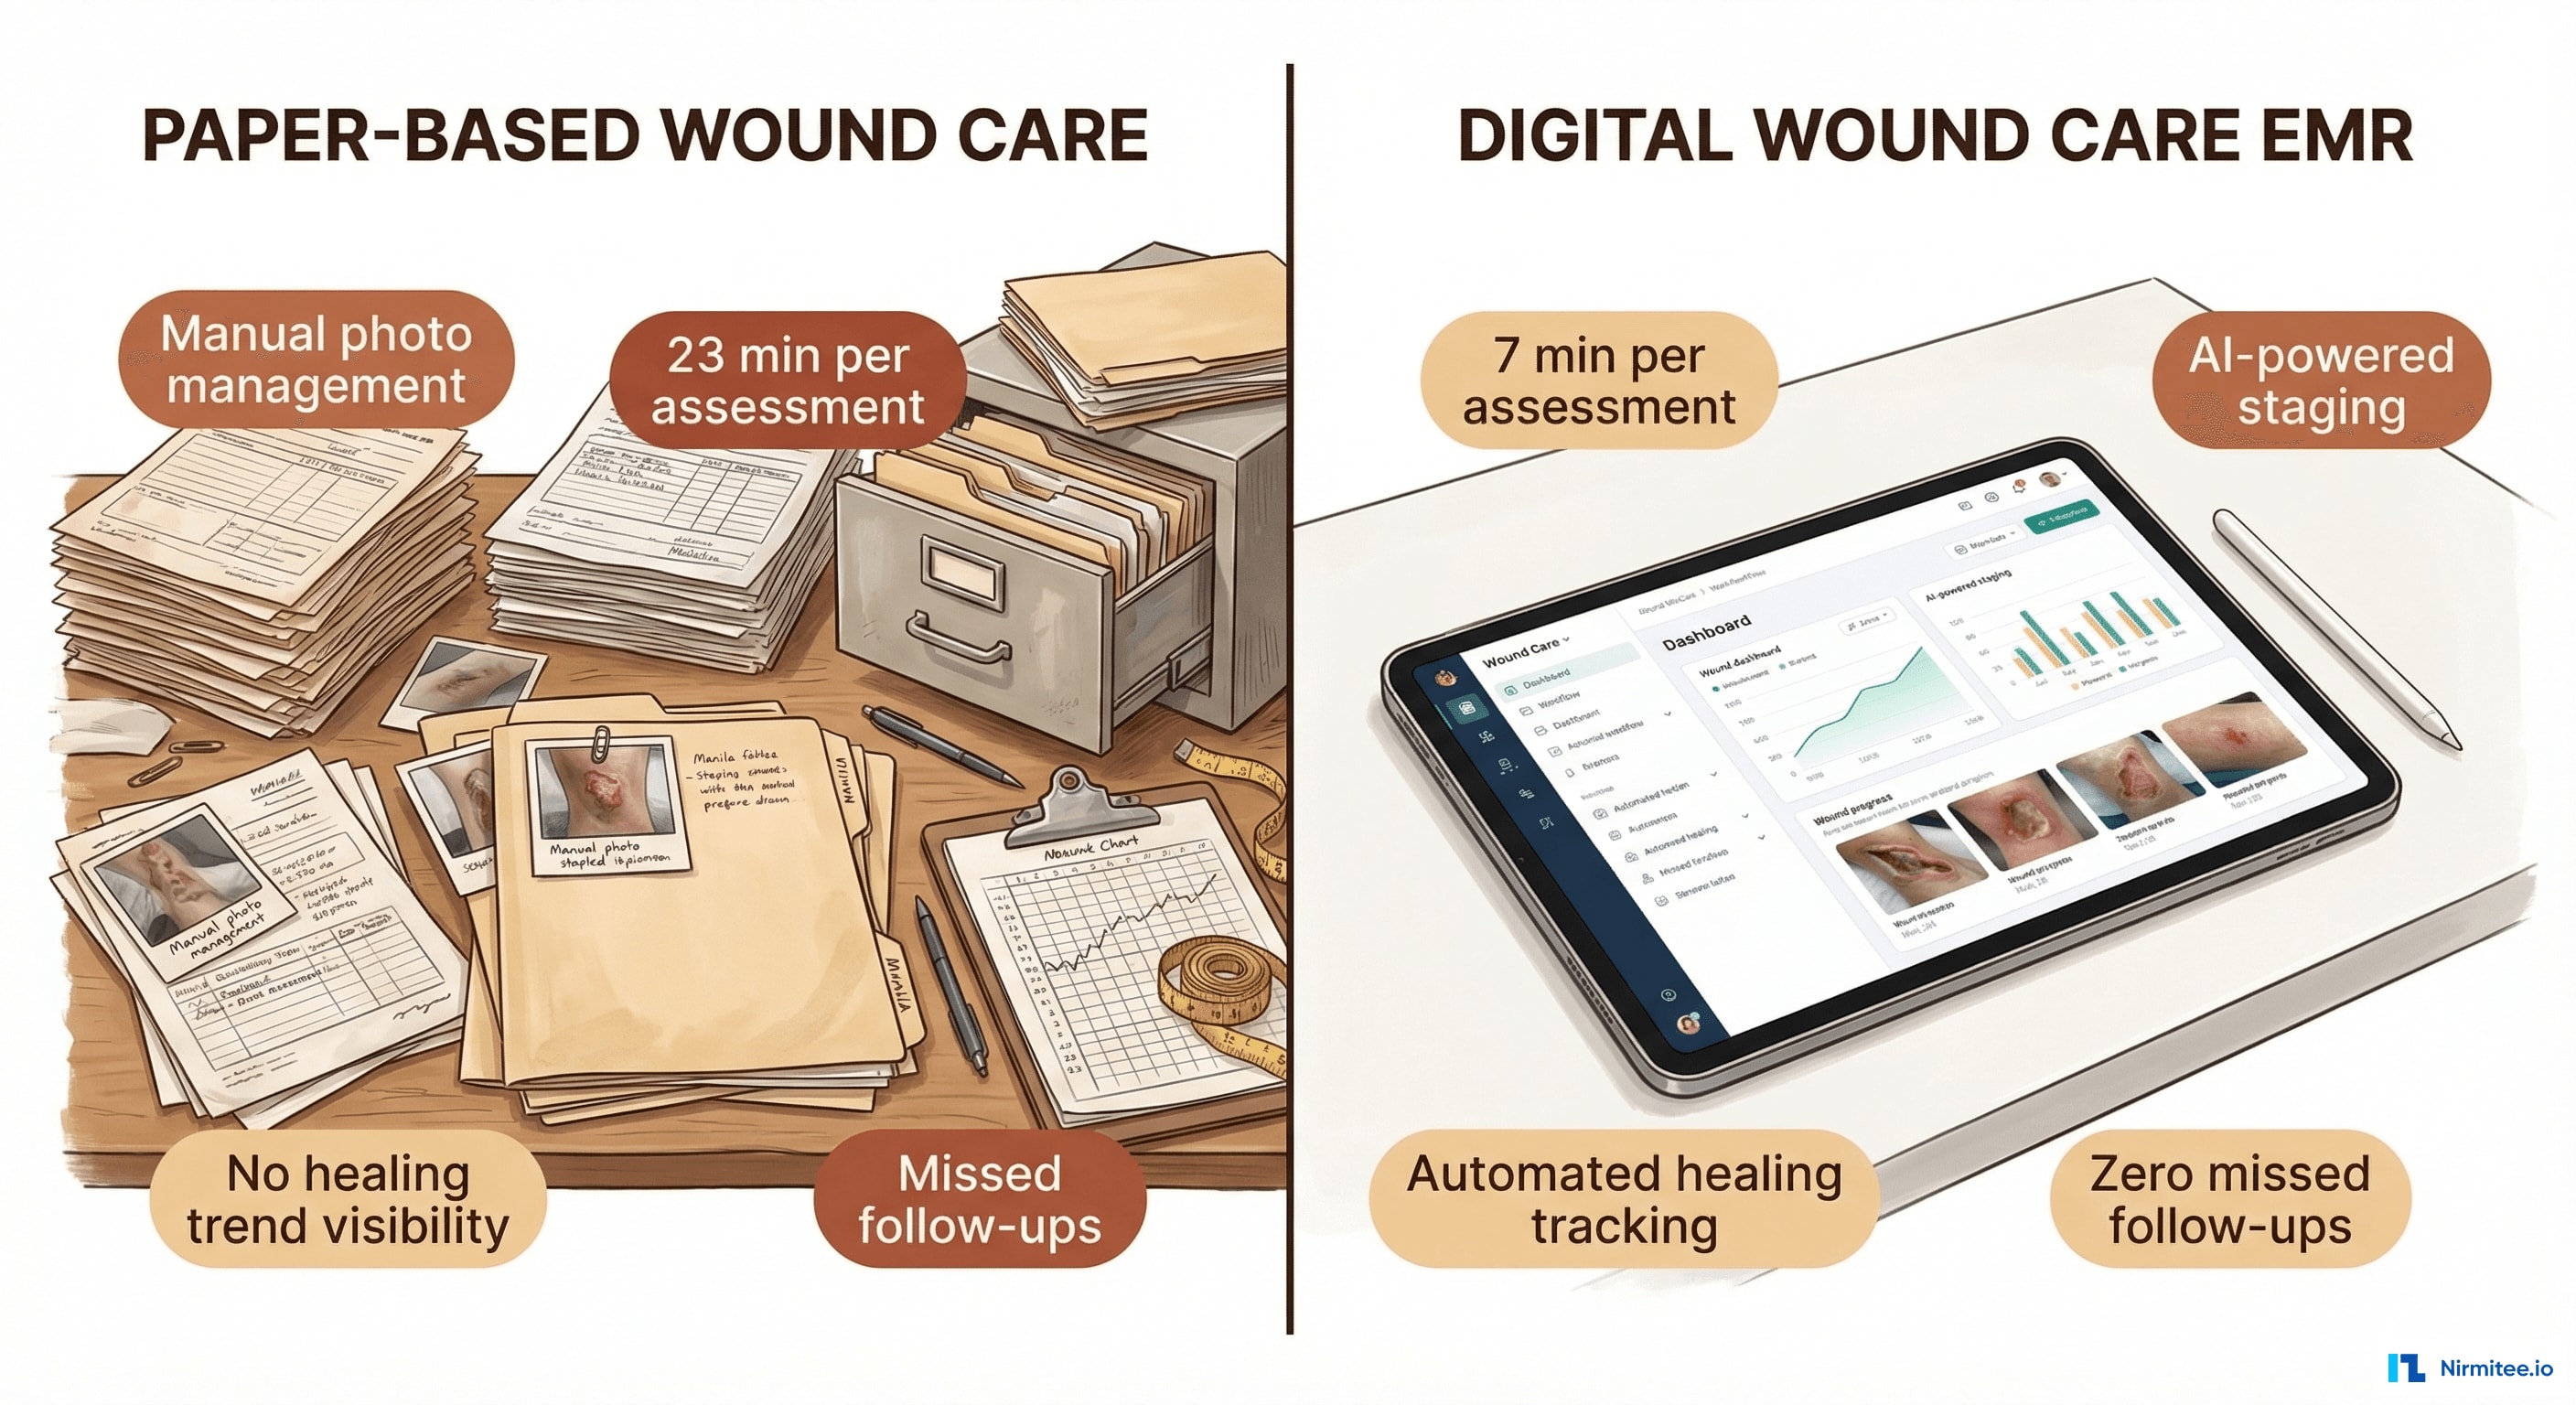
We built a complete wound care EMR from scratch — mobile photo capture with AI-powered wound measurement, structured wound assessments with staging and classification, treatment plan builder with evidence-based protocols, healing progress tracking with timeline visualization, and provider analytics dashboards. All integrated with existing EHR systems via FHIR R4.
Results: assessment time reduced from 23 minutes to 7 minutes (70% faster), healing rate improved from 64% to 78% through data-driven treatment optimization, and zero missed follow-ups through automated scheduling.
The Problem: Generic EHRs Can't Handle Wounds
Wound care is a $15 billion market in the US, with 6.5 million patients living with chronic non-healing wounds. Yet the documentation tools available to wound care specialists are embarrassingly primitive.
What Generic EHRs Get Wrong
- No structured wound data: wound measurements (length × width × depth), wound bed composition, drainage, and staging are entered as free text. You can't query, trend, or analyze free text.
- Photo management nightmare: clinicians take wound photos on personal phones, email them to themselves, manually attach to the chart, and hope the photo order is correct. No measurement overlay, no chronological organization, no side-by-side comparison.
- No healing trajectory: without structured wound data over time, there's no way to visualize if a wound is healing, stagnating, or deteriorating. Clinicians rely on memory and subjective impression.
- No treatment protocol support: wound care has evidence-based treatment algorithms (NPUAP staging, Wagner classification, TIME framework). Generic EHRs don't encode these — treatment selection is entirely in the clinician's head.
- Billing gaps: wound care billing requires specific CPT codes tied to wound size, debridement area, and graft dimensions. Without structured measurements, coding is inaccurate → revenue leakage.
Wound Assessment Screen
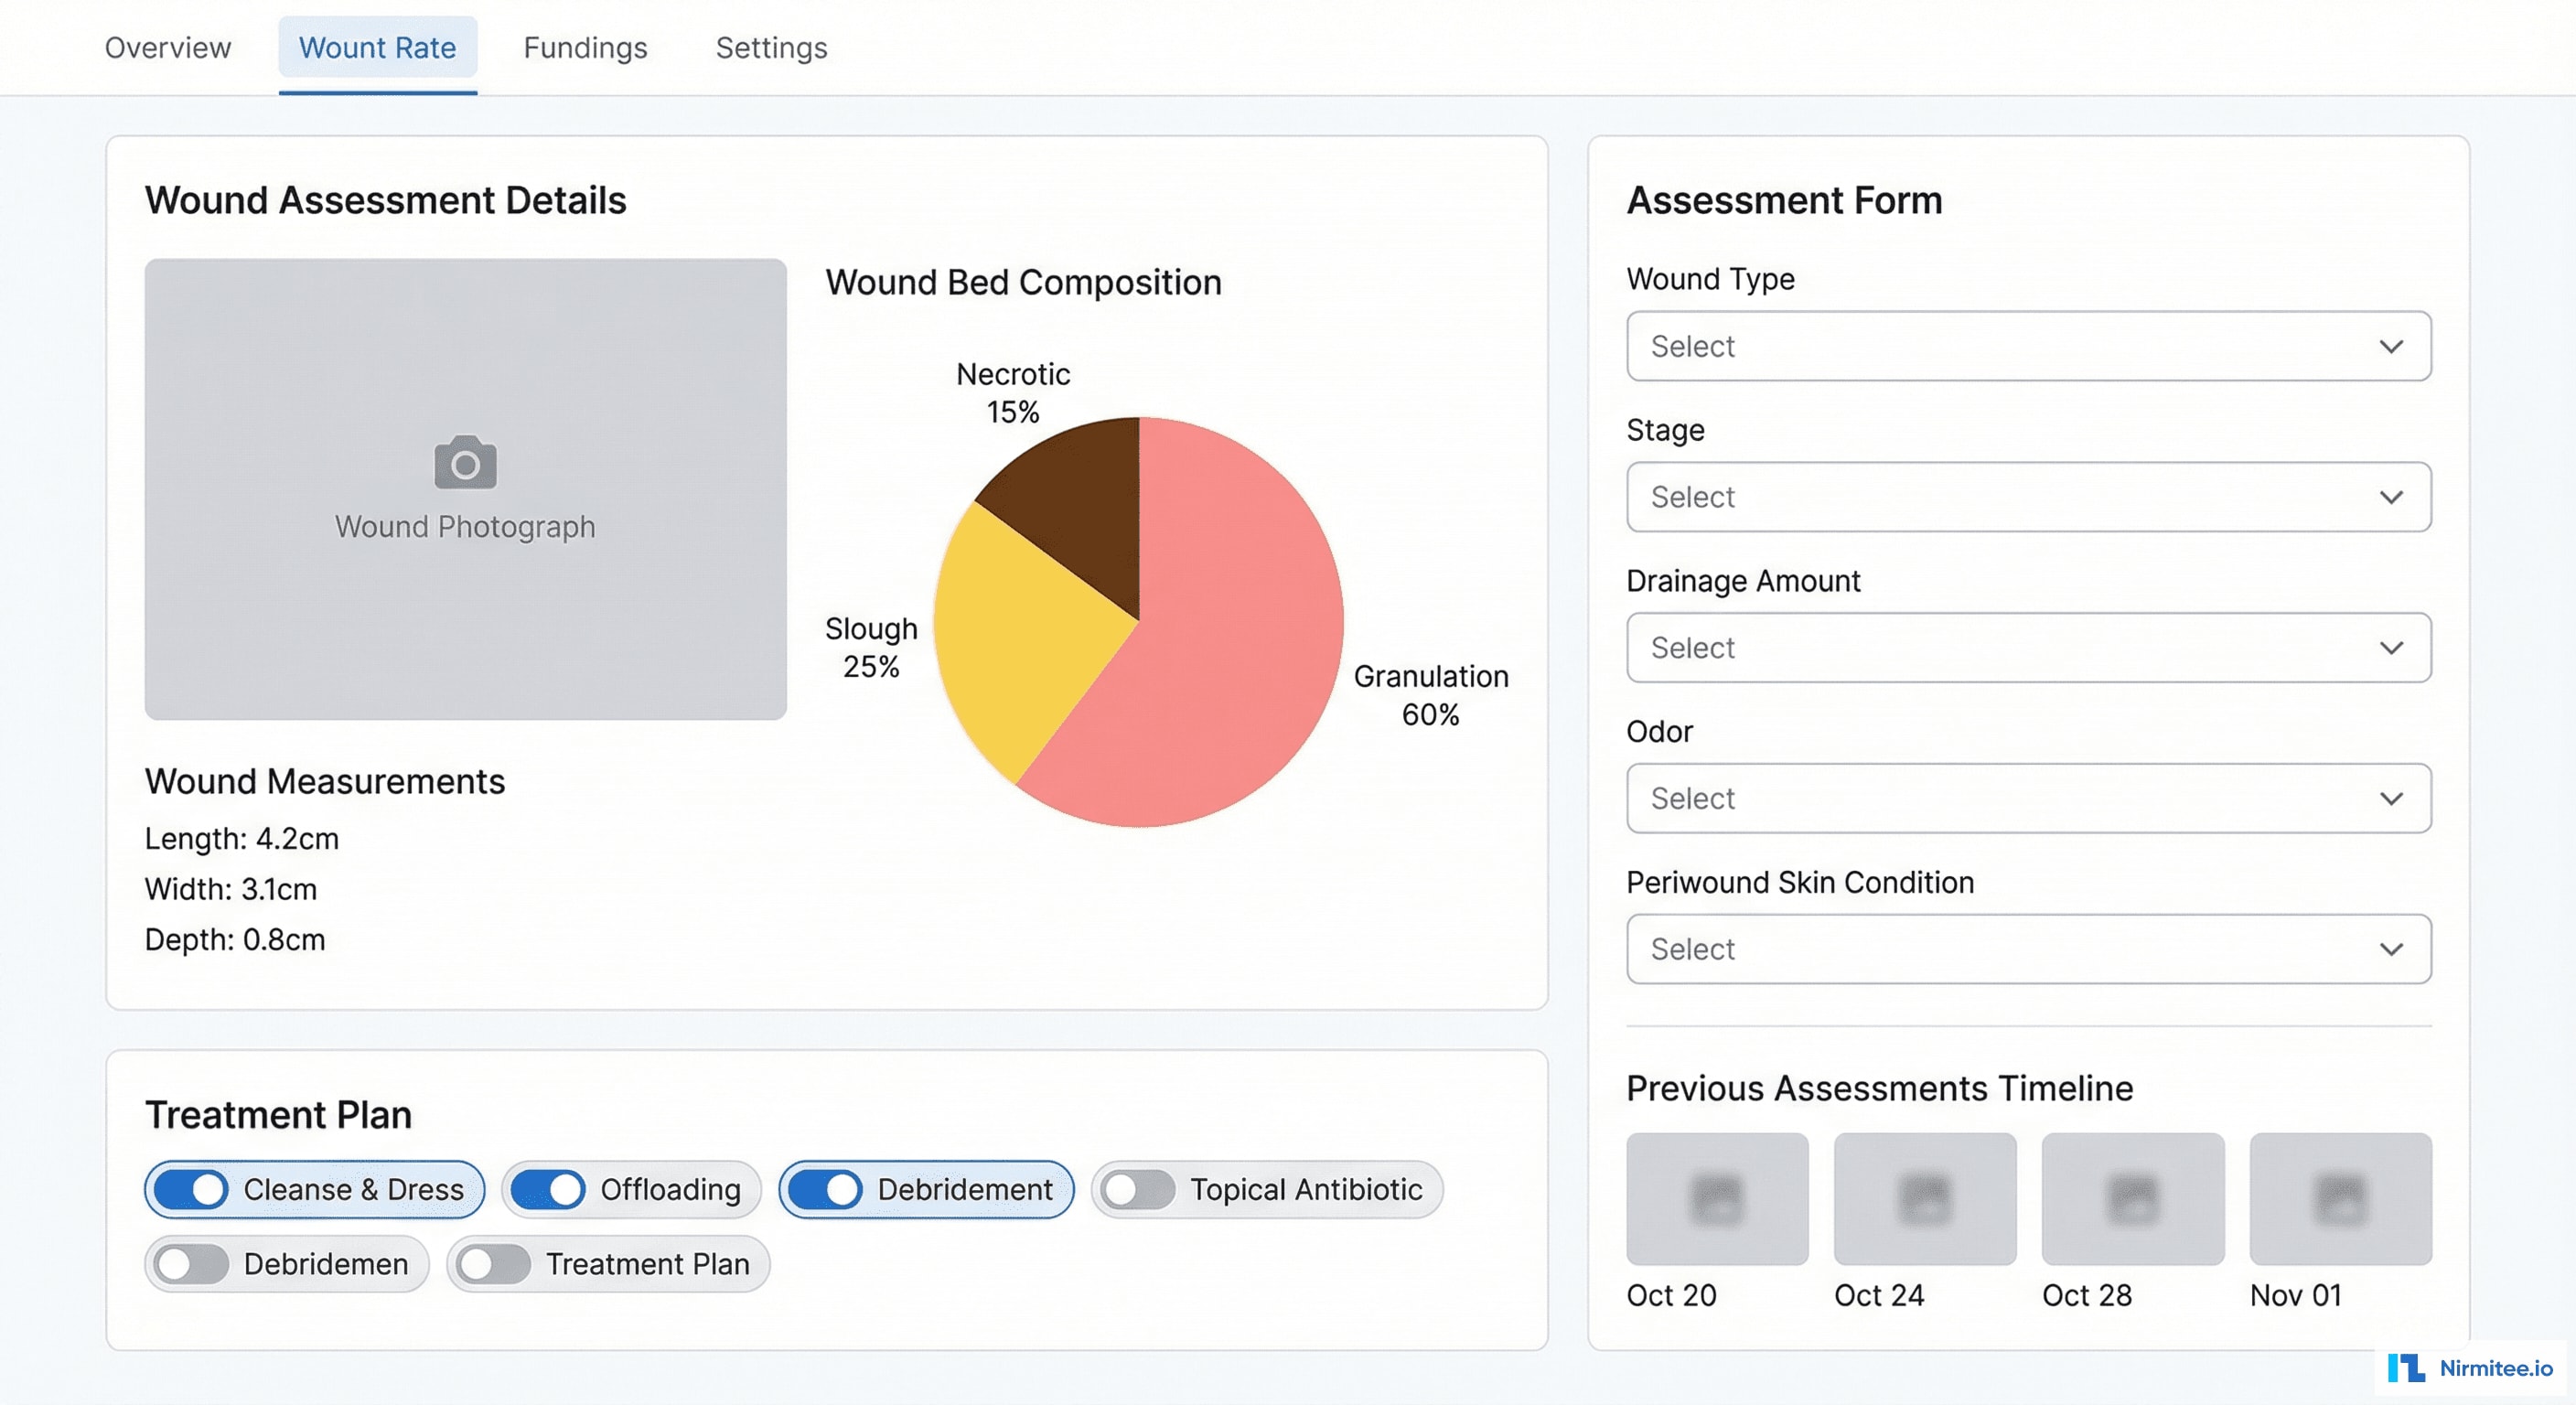
The wound assessment screen is the clinical workhorse. For each wound visit, the clinician documents:
- Wound measurements: length, width, depth in centimeters — auto-calculated wound area and volume. Measurement trends compared to previous assessment.
- Wound bed composition: visual pie chart showing percentage of granulation (red), slough (yellow), necrotic/eschar (black), epithelialization (pink). Changes tracked over time.
- Wound characteristics: structured dropdowns for wound type, stage/grade, drainage amount, drainage type, odor, periwound skin condition, undermining, tunneling.
- Pain assessment: NRS scale (0-10) with location mapping.
- Treatment applied: dressing type, topical agents, debridement performed, negative pressure parameters.
Every field is structured, queryable, and feeds into healing analytics.
Mobile Photo Capture
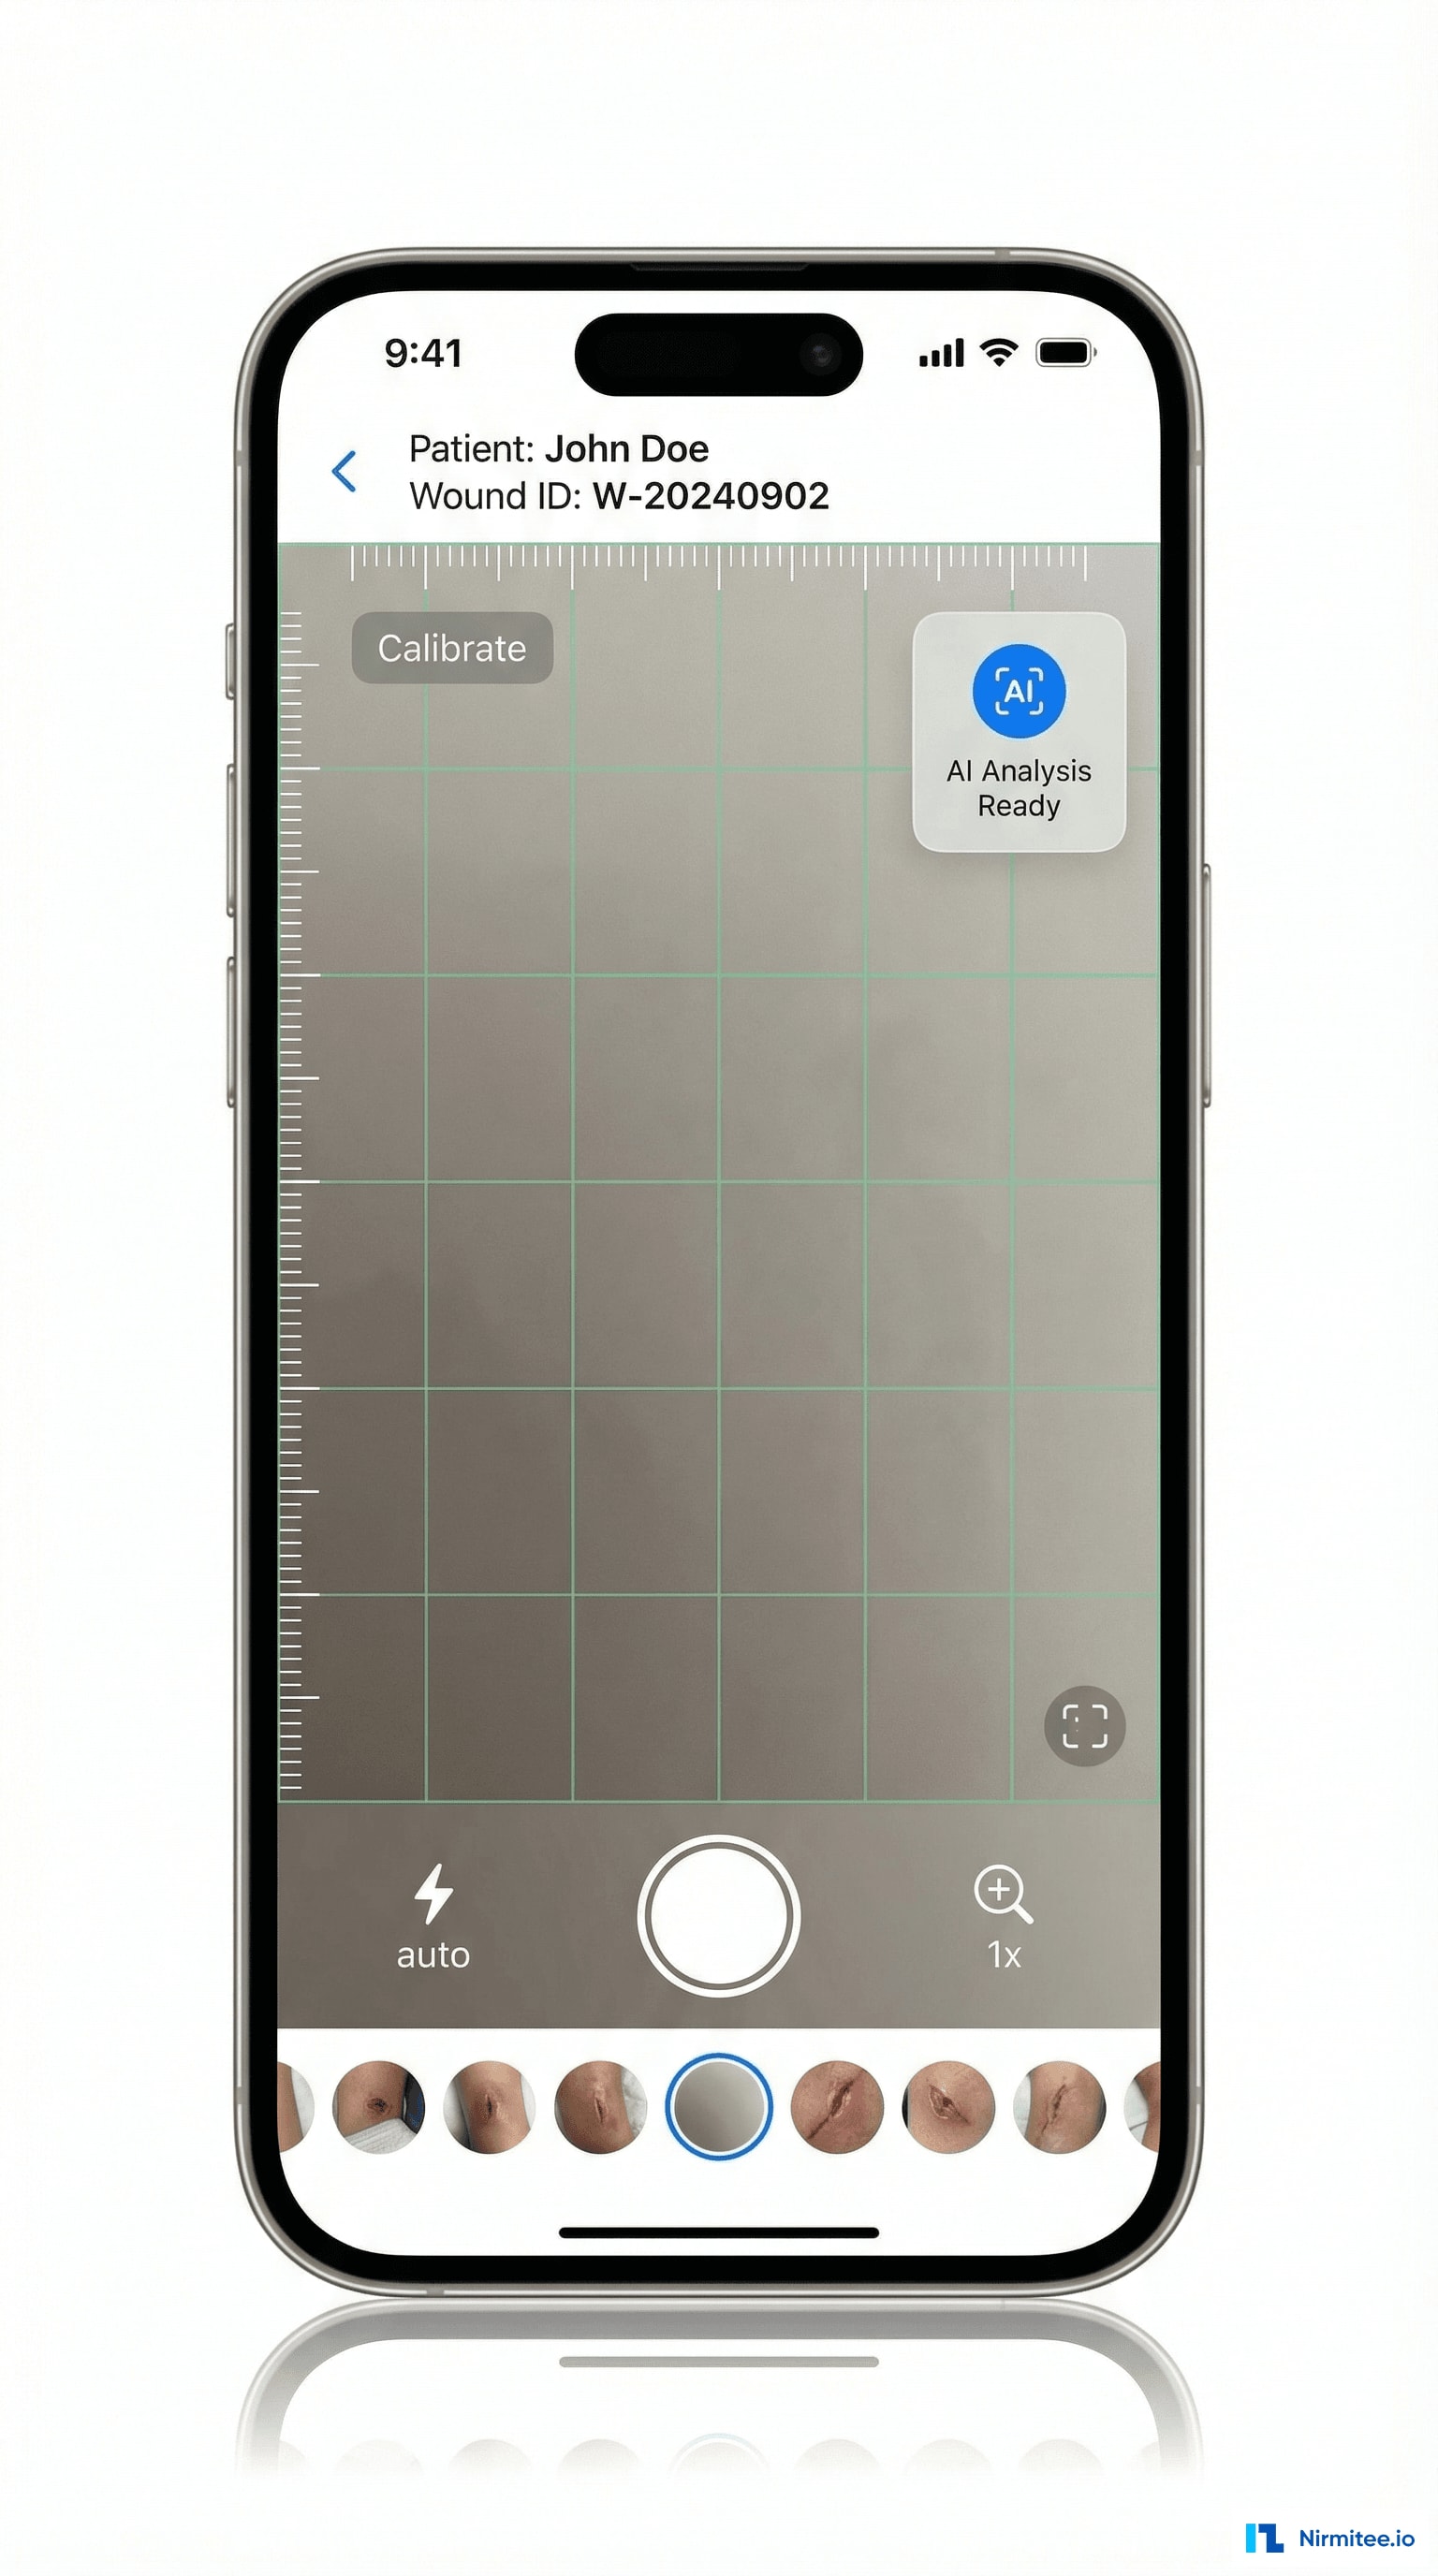
The mobile app transforms wound photography from a manual hassle into a streamlined clinical tool:
- Guided capture: camera viewfinder with wound framing guide and measurement ruler overlay for consistent photo quality across clinicians
- AI measurement: machine learning model estimates wound dimensions from the photo using the ruler calibration markers — reducing measurement variability between clinicians
- Automatic organization: photos tagged with patient, wound ID, date, and assessment — no manual sorting. Chronological timeline built automatically.
- Side-by-side comparison: swipe between current and previous photos to visually assess healing progress
- Secure storage: photos encrypted and stored in HIPAA-compliant cloud (S3) — never on the clinician's personal device camera roll
Architecture
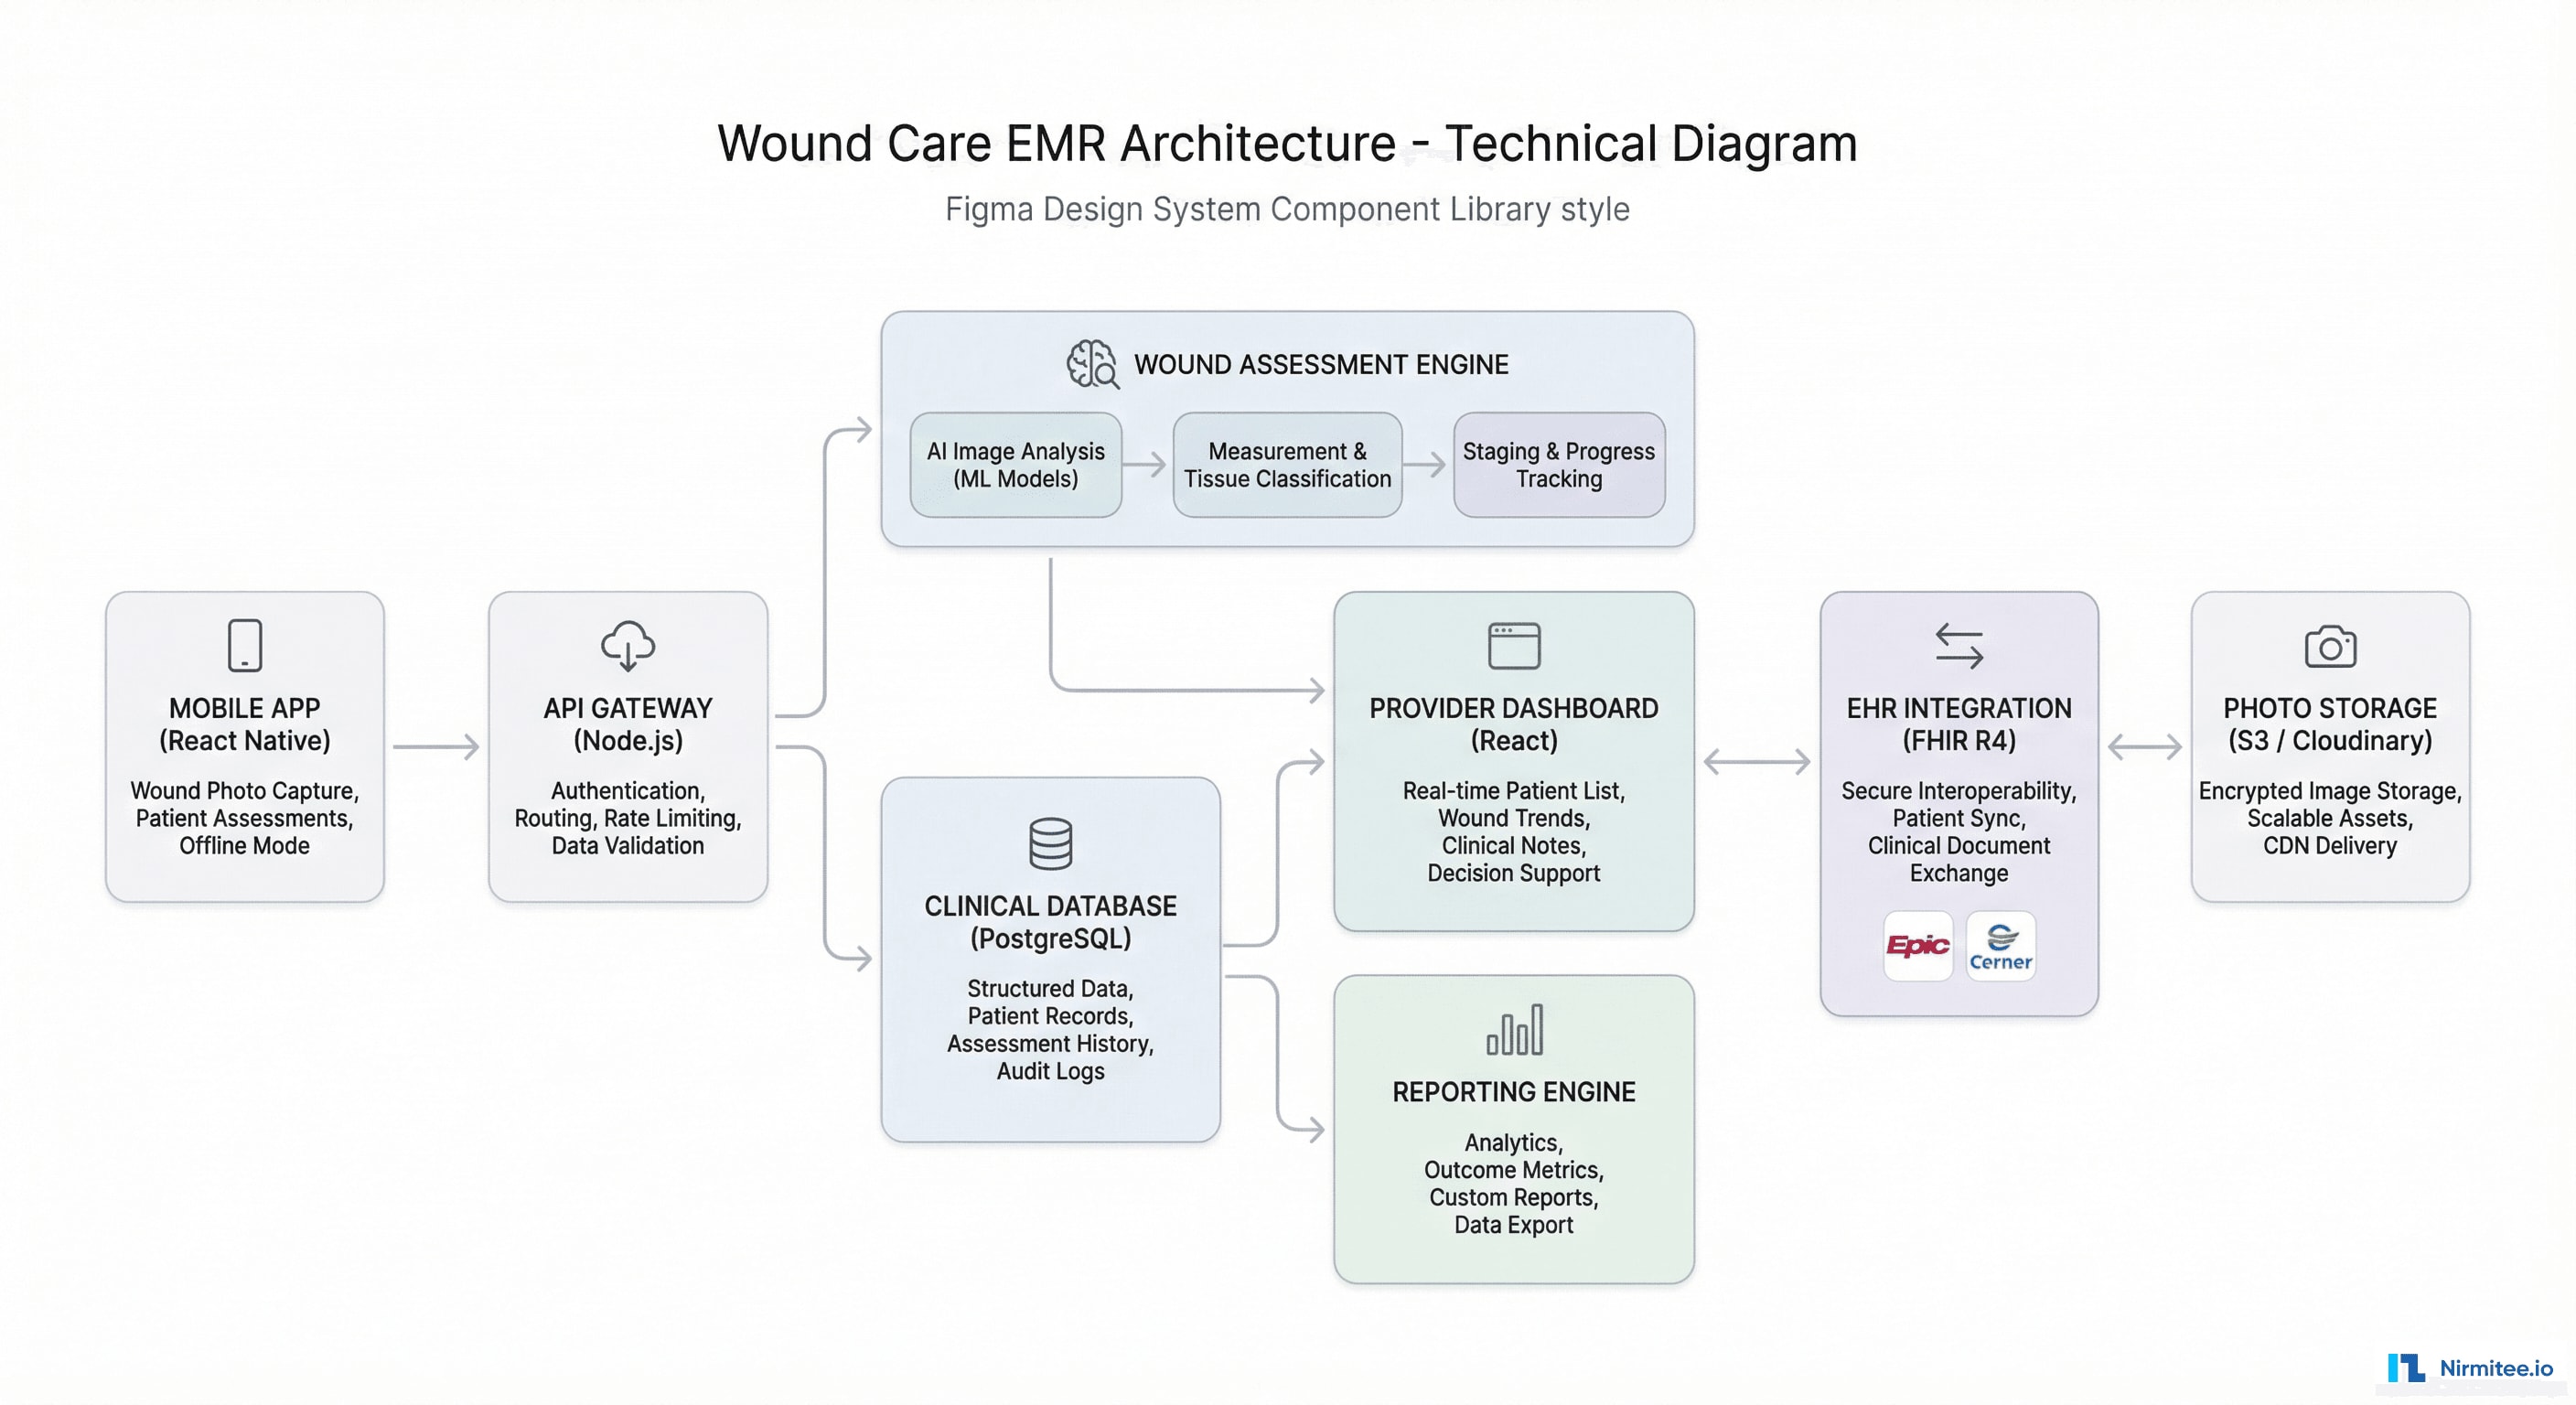
Technology Stack
| Layer | Technology | Purpose |
|---|---|---|
| Mobile App | React Native | Photo capture, bedside assessment, offline support |
| Web Dashboard | React + TypeScript | Provider dashboard, analytics, treatment planning |
| Backend | Node.js (Express) | API gateway, business logic, scheduling |
| Database | PostgreSQL | Structured wound data, assessments, treatment plans |
| Photo Storage | AWS S3 + Cloudinary | HIPAA-compliant image storage with CDN delivery |
| AI/ML | Python (TensorFlow) | Wound measurement from photos, staging assistance |
| EHR Integration | FHIR R4 | Sync with Epic/Cerner for demographics, allergies, meds |
| Reporting | Puppeteer | PDF wound care reports, insurance documentation |
Patient List
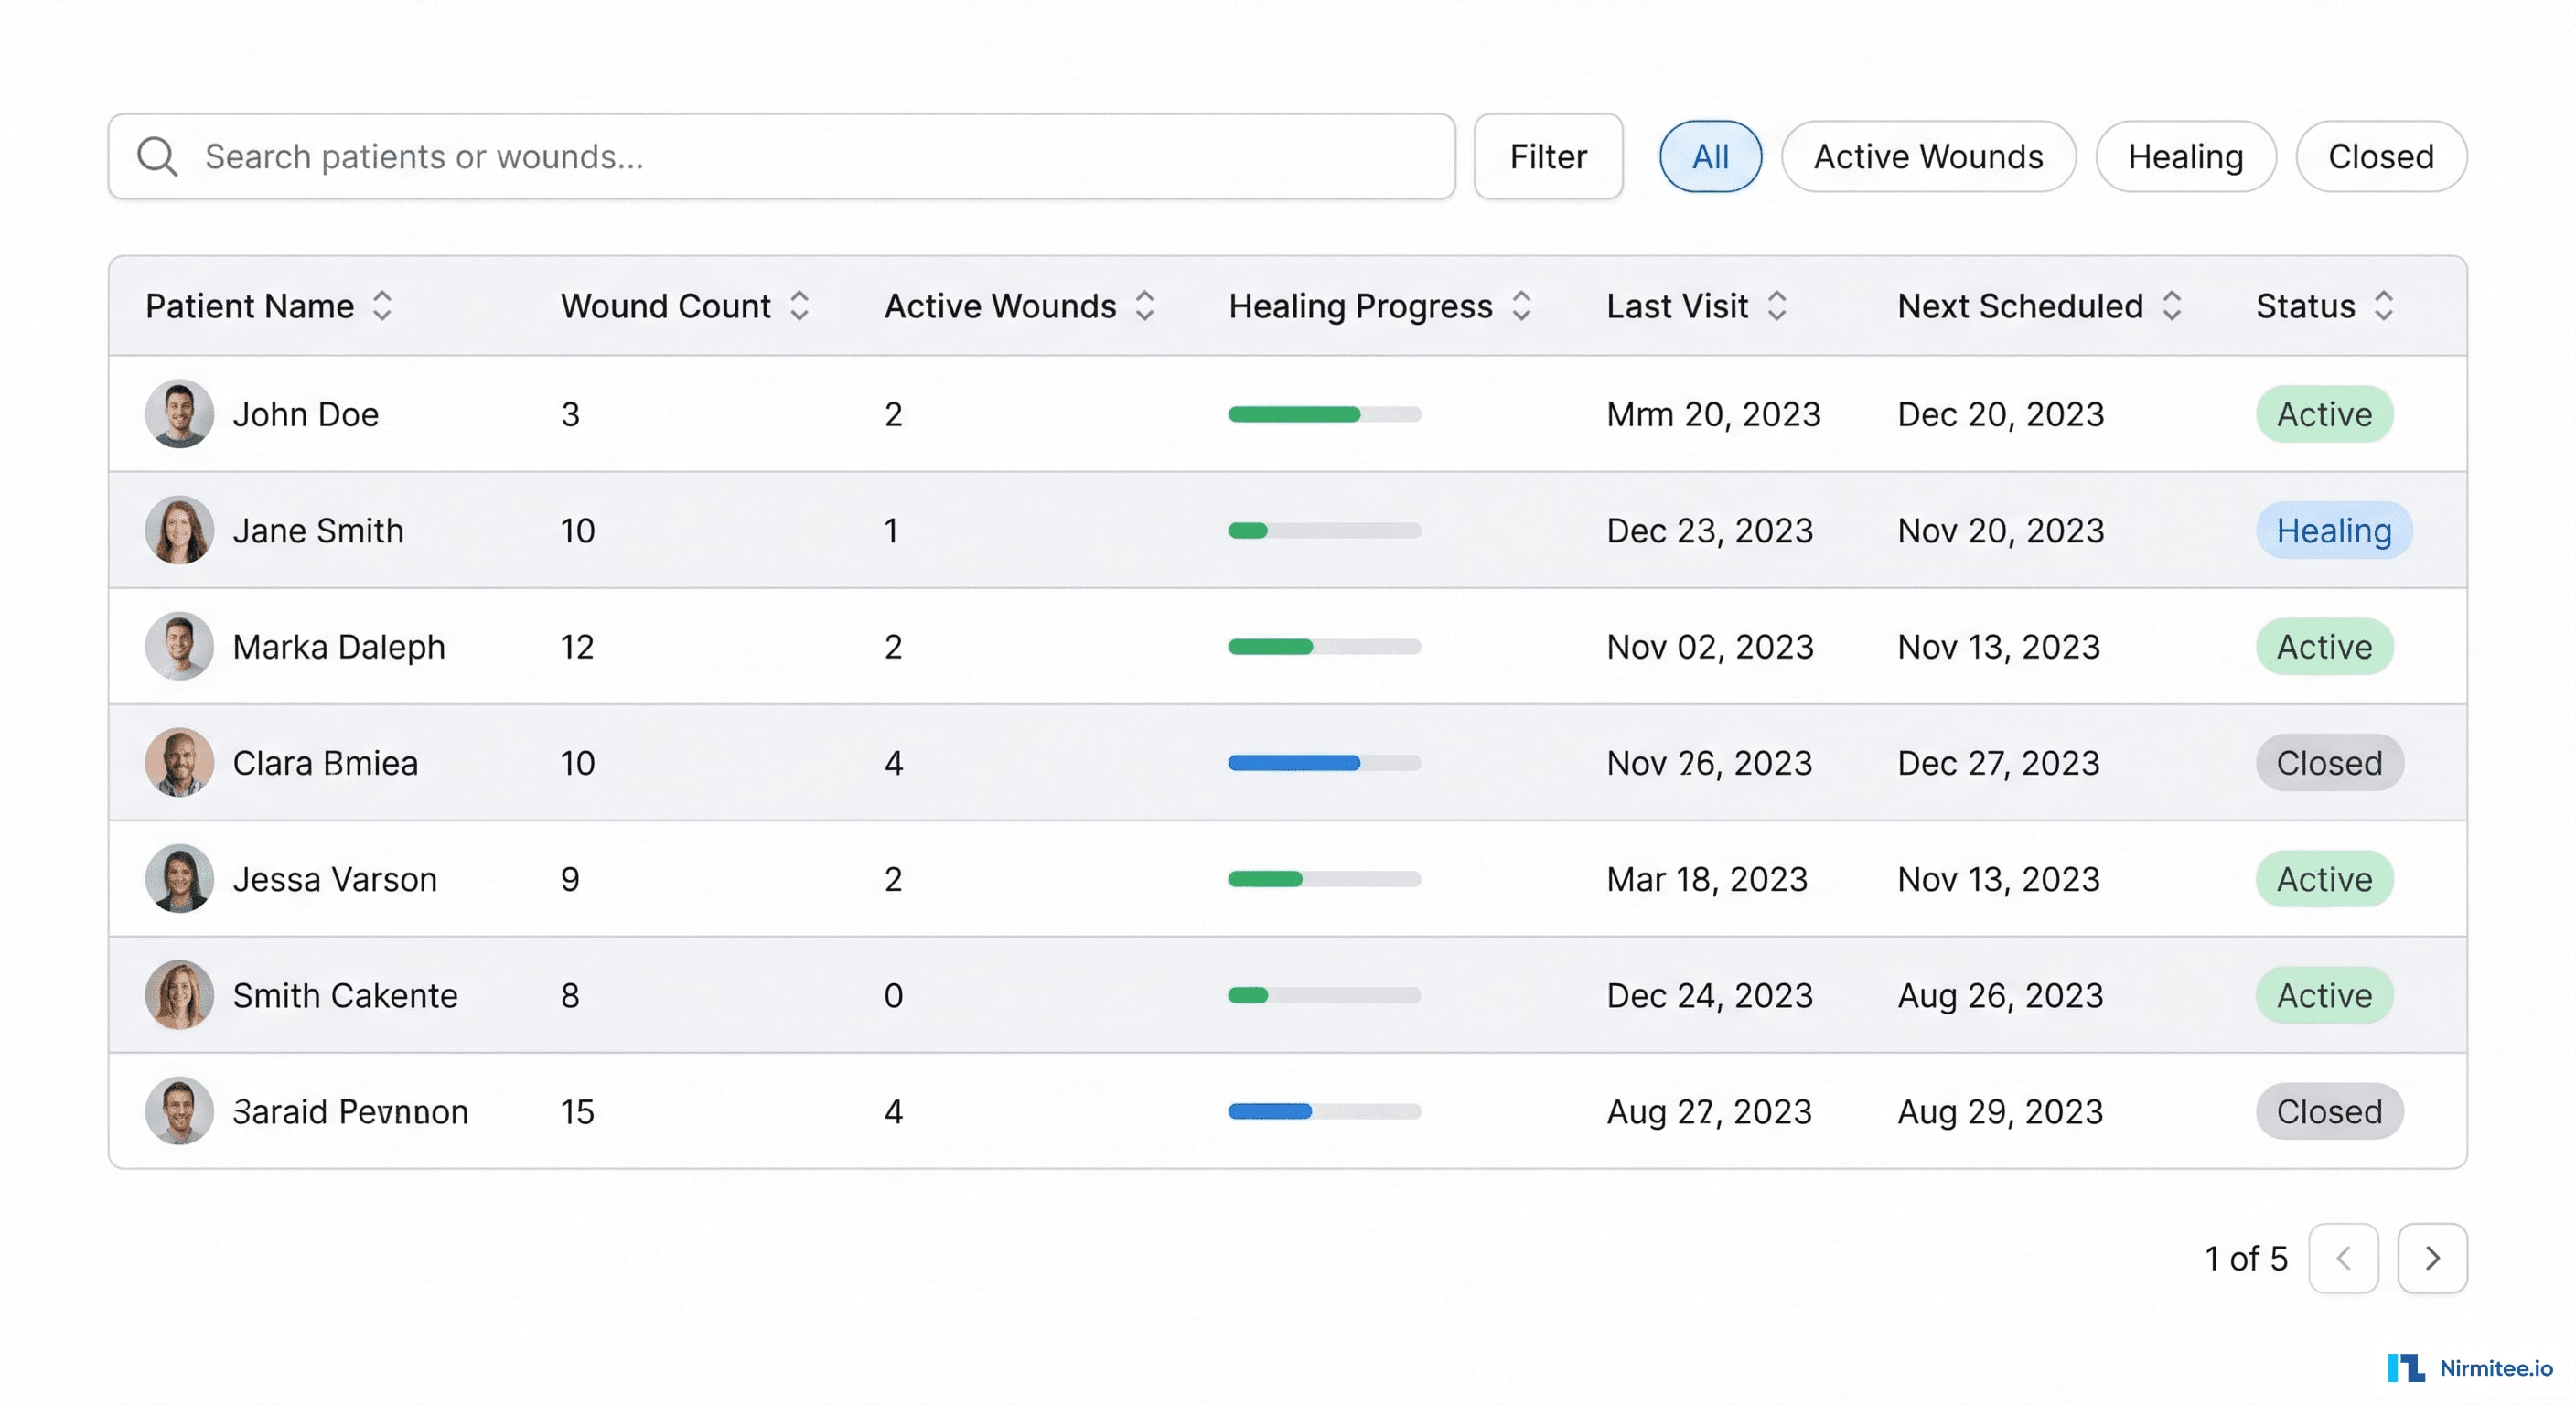
The patient list gives clinicians an instant overview of their caseload. Key data at a glance: number of active wounds per patient, healing progress as a mini progress bar, last visit date, next scheduled visit. Filter by wound status (Active, Healing, Closed) to prioritize the day's workflow.
Healing Timeline Visualization
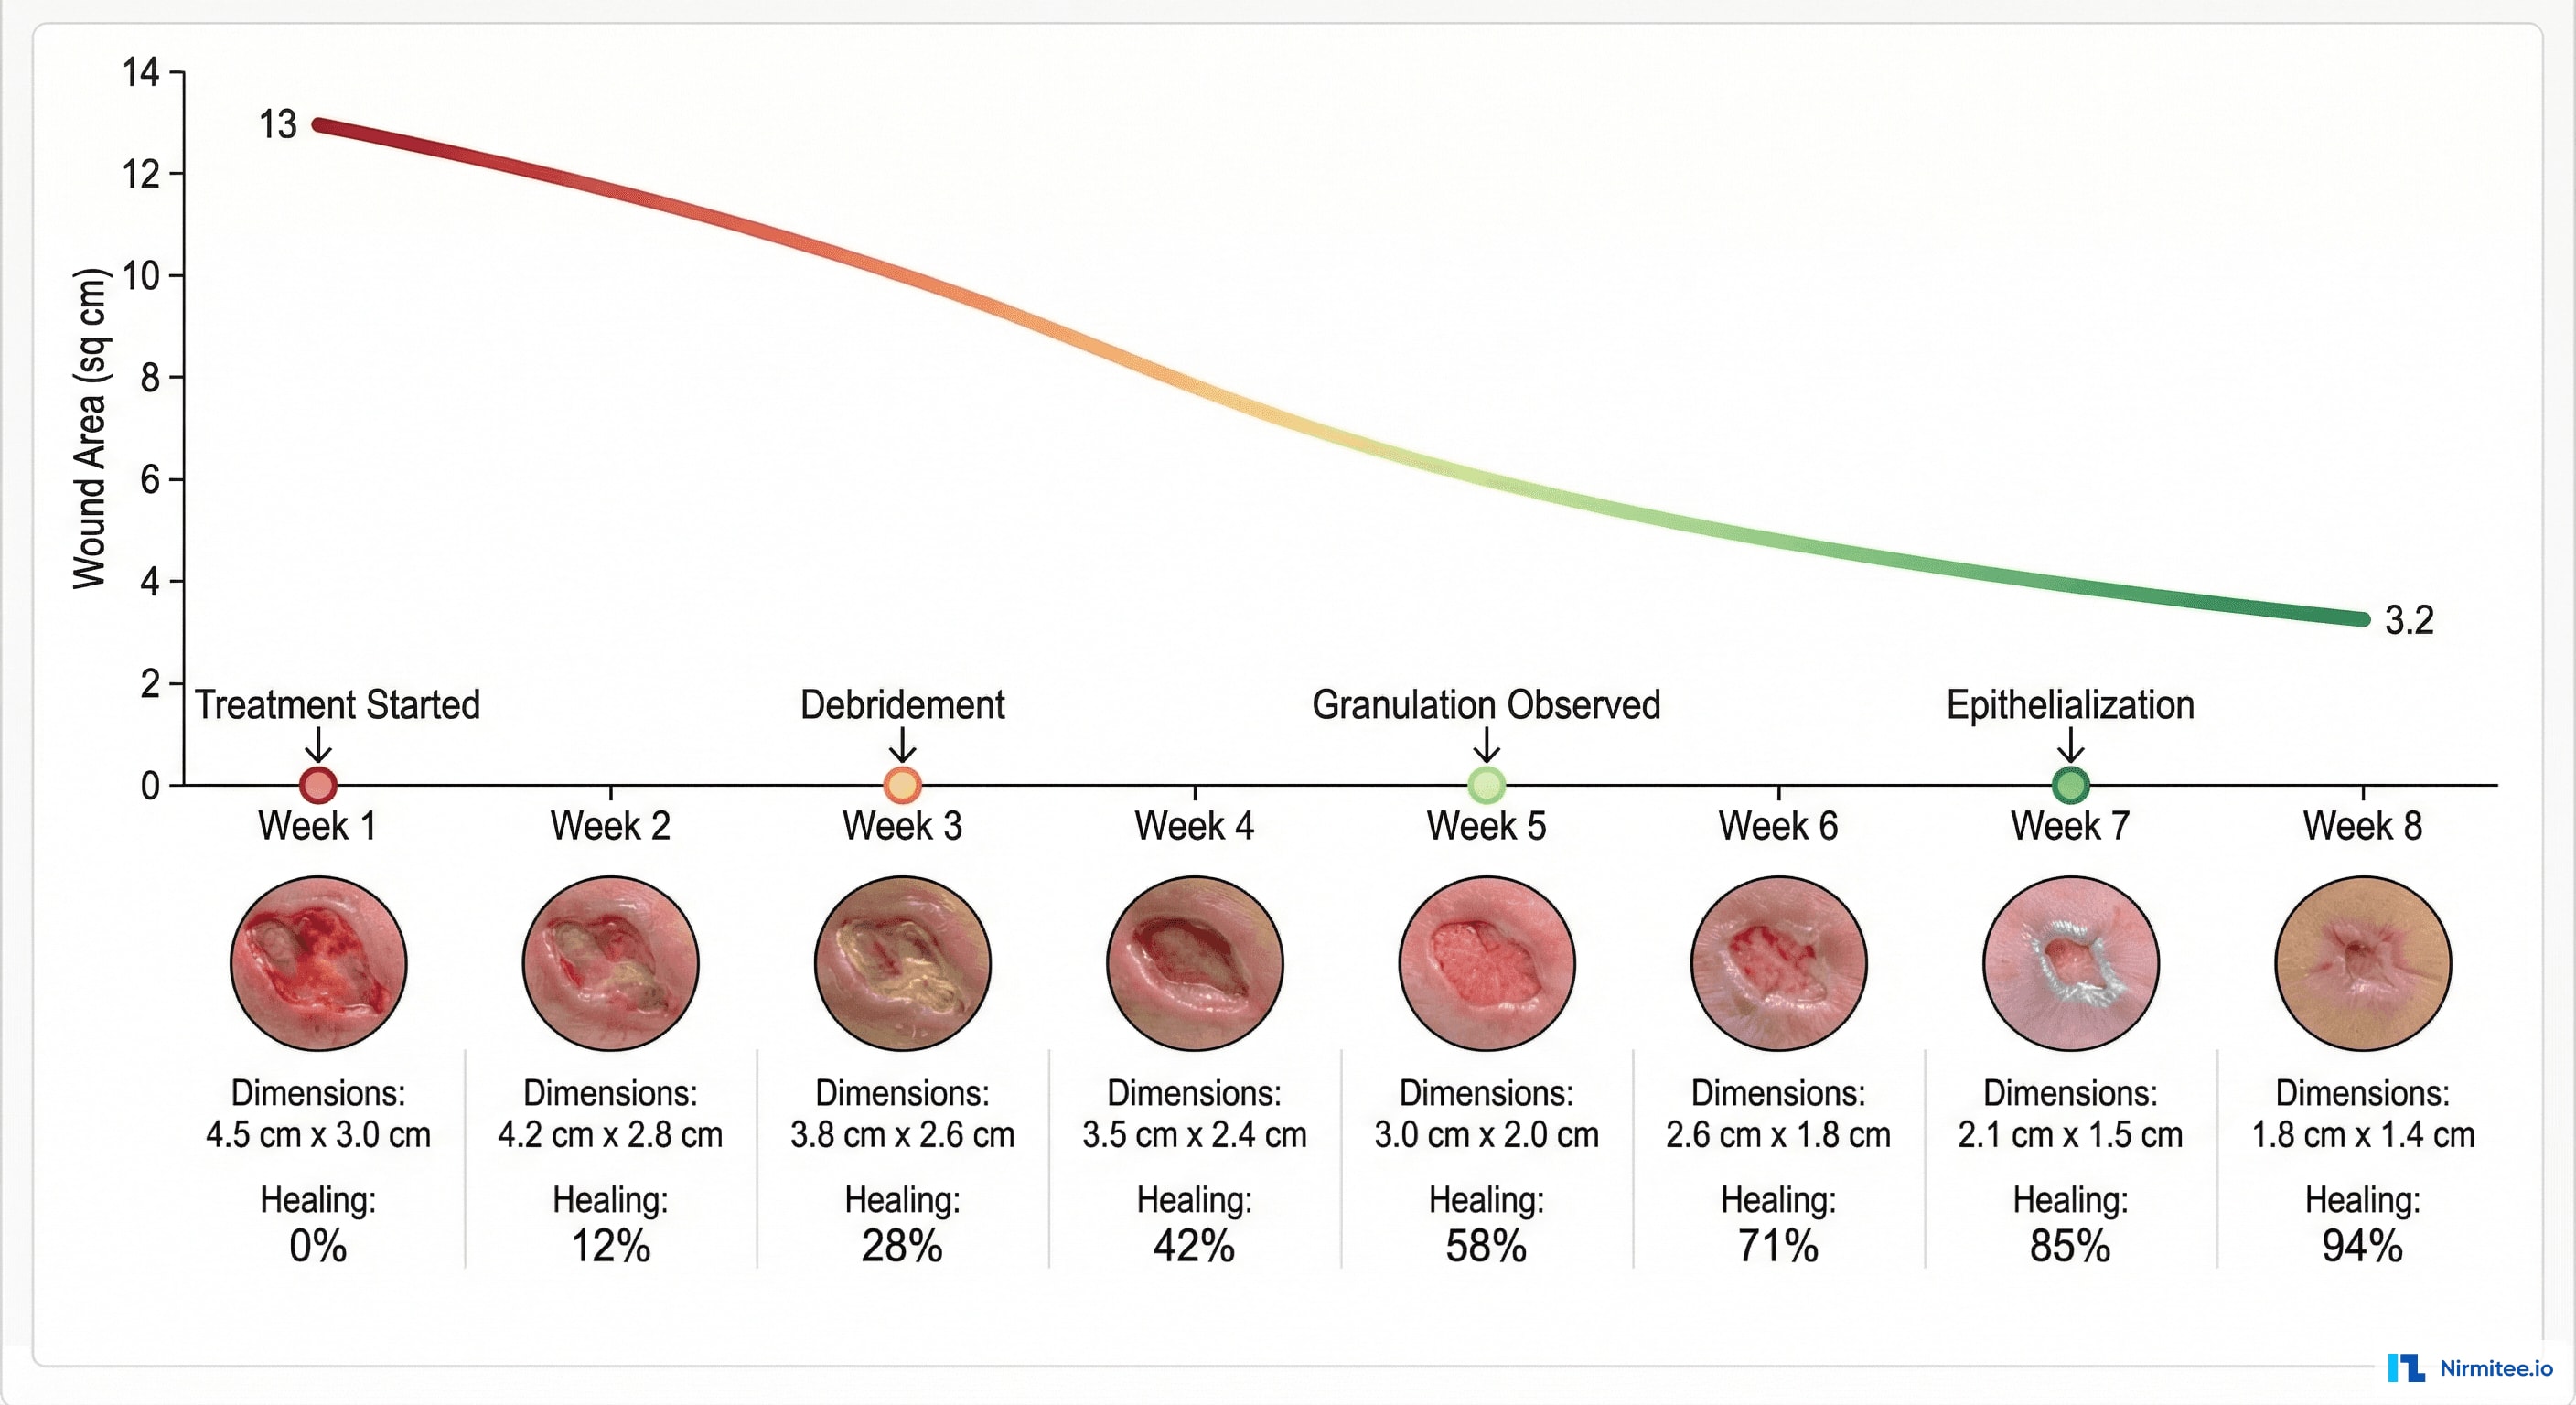
The healing timeline is the feature clinicians love most. For each wound, it shows:
- Photo progression: weekly thumbnails showing visual healing — the most powerful evidence for both clinical decisions and patient motivation
- Area trend: wound surface area plotted over time, showing the healing curve. A healthy wound shows exponential decrease. A stagnant wound shows a flat line — triggering treatment reassessment.
- Treatment milestones: markers for key events — debridement performed, dressing change, therapy started — showing the relationship between interventions and outcomes
- Projected healing: based on the current trajectory, AI estimates the expected closure date. If the projection exceeds the expected healing window, an alert suggests treatment review.
Treatment Plan Builder
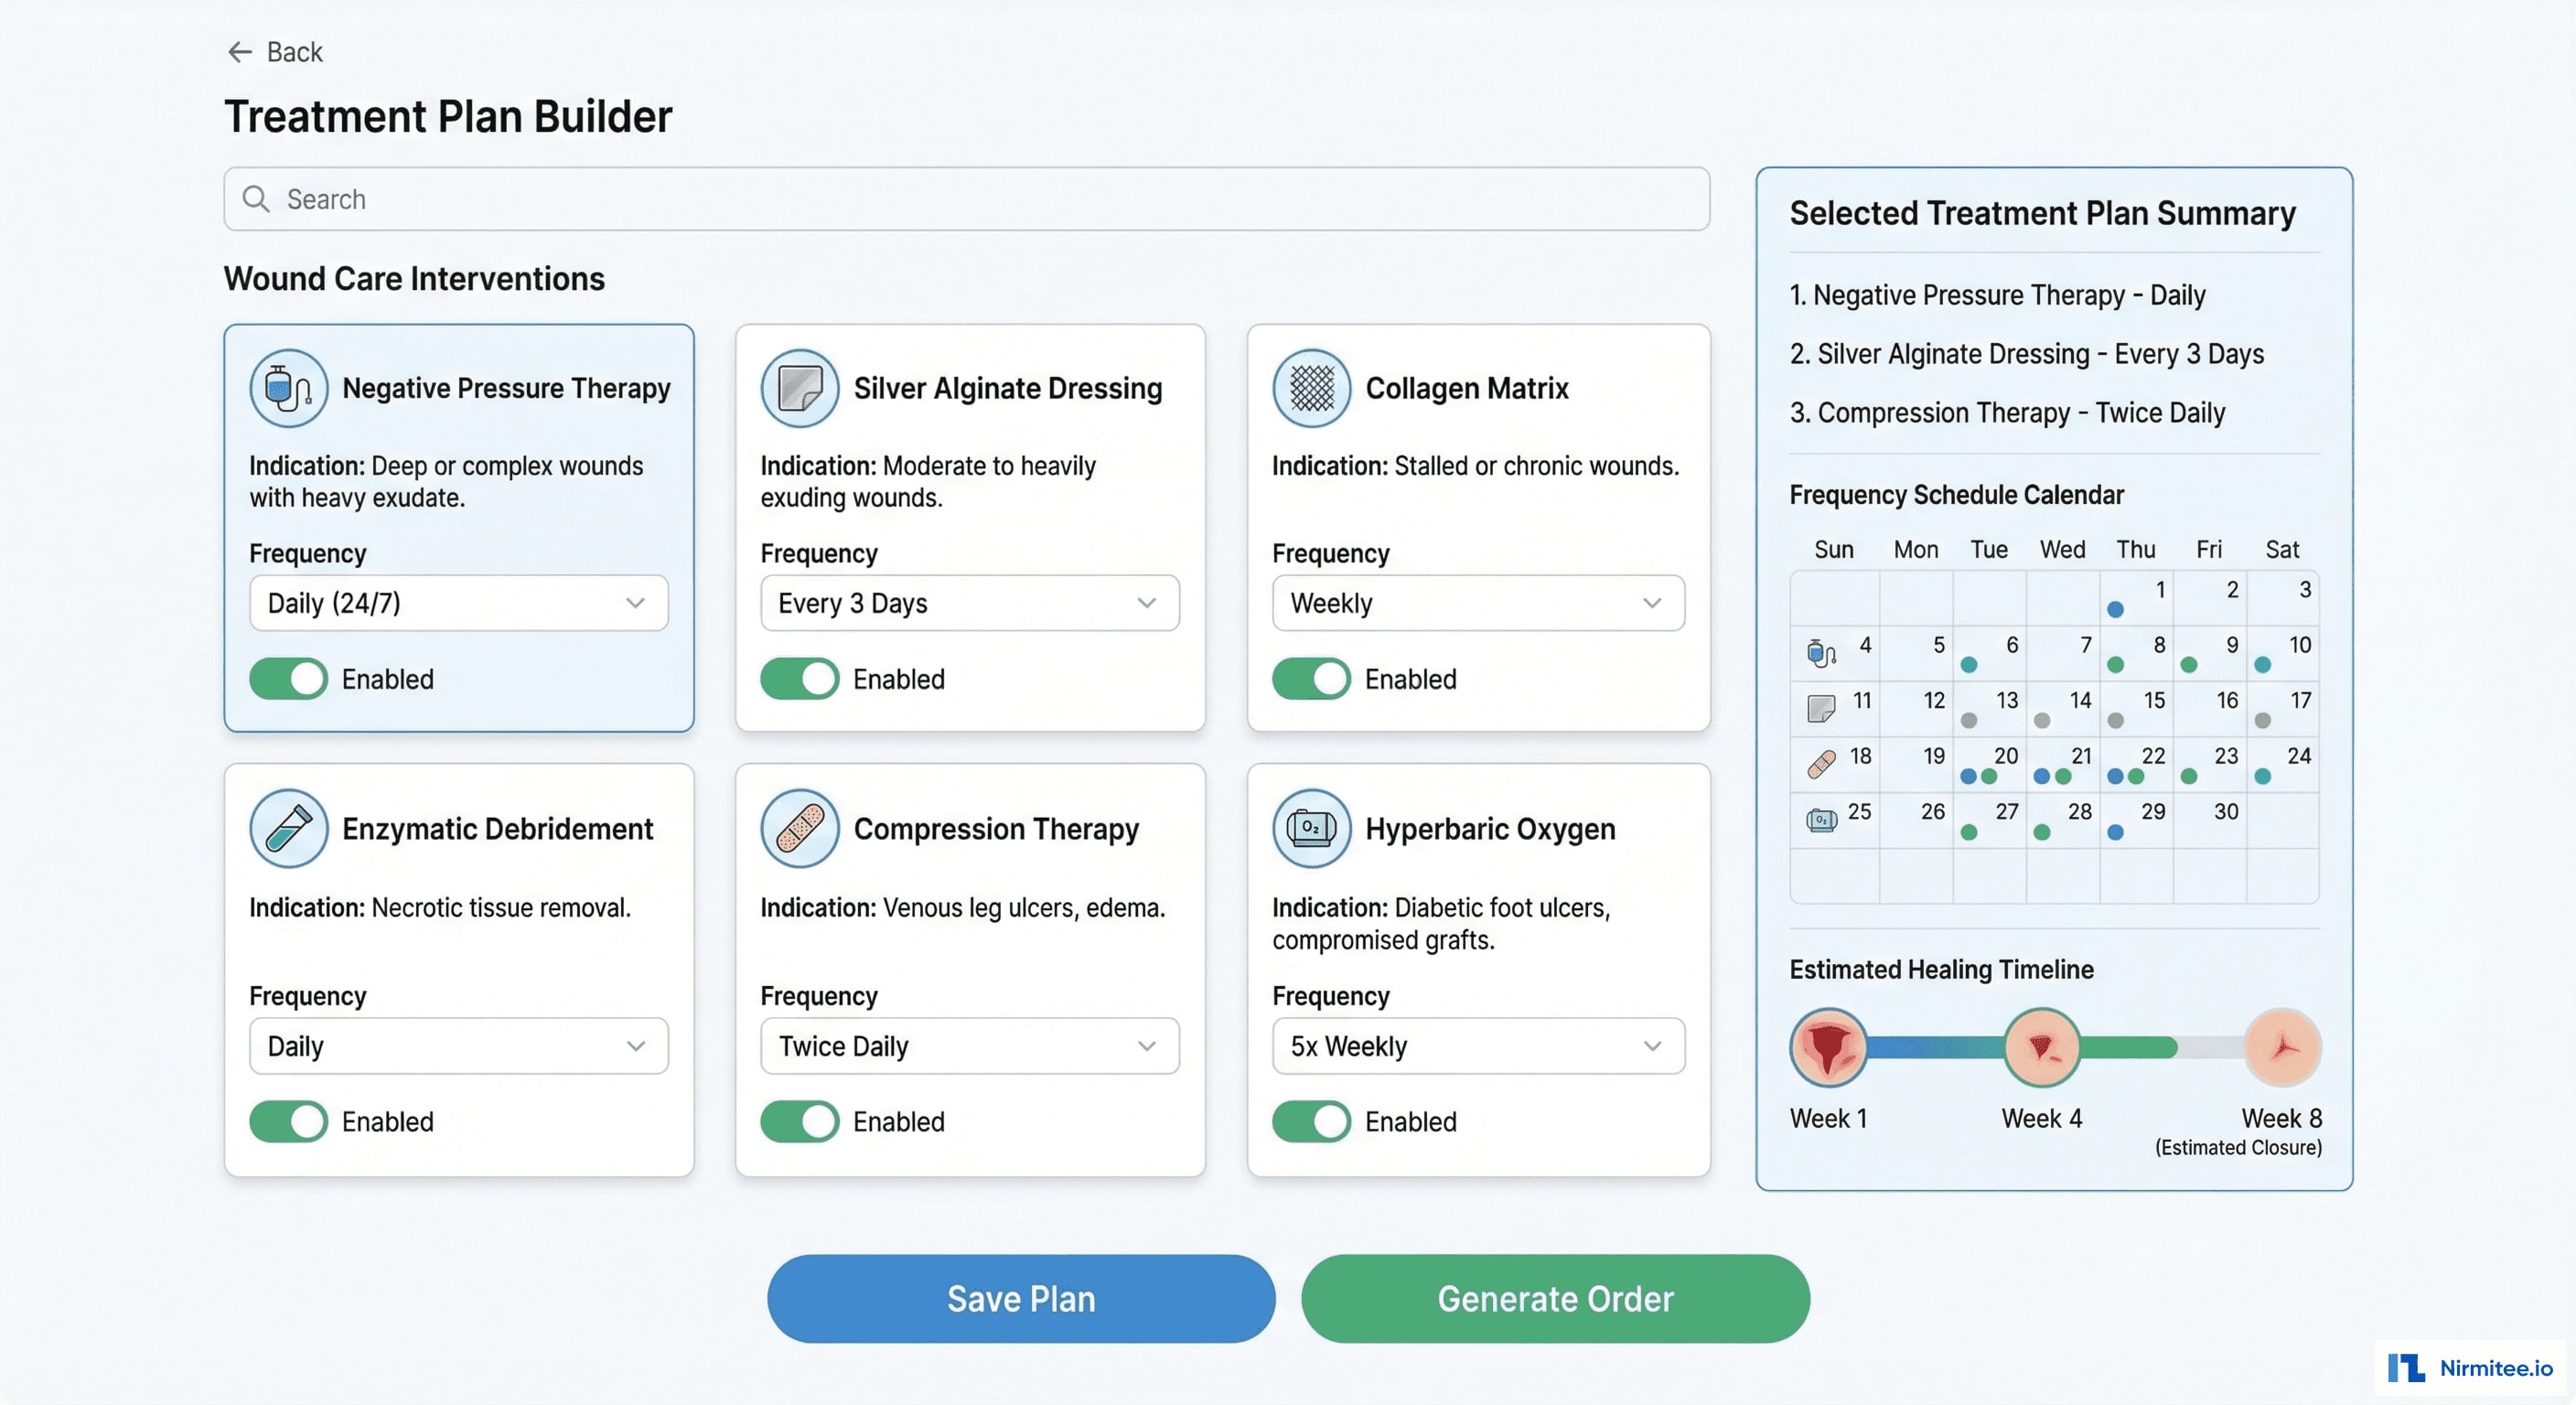
The treatment plan builder provides evidence-based intervention selection based on wound type, stage, and characteristics:
- Intervention cards: each available treatment shown as a card with name, indication, contraindications, and evidence level. Clinicians toggle interventions on/off.
- Frequency scheduling: each intervention has a configurable frequency — daily, twice weekly, weekly — automatically generating the visit schedule.
- Protocol compliance: the system checks selected interventions against evidence-based protocols (NPUAP, WOCN guidelines) and flags deviations.
- Order generation: one click generates orders for supplies, dressings, and equipment needed for the treatment plan.
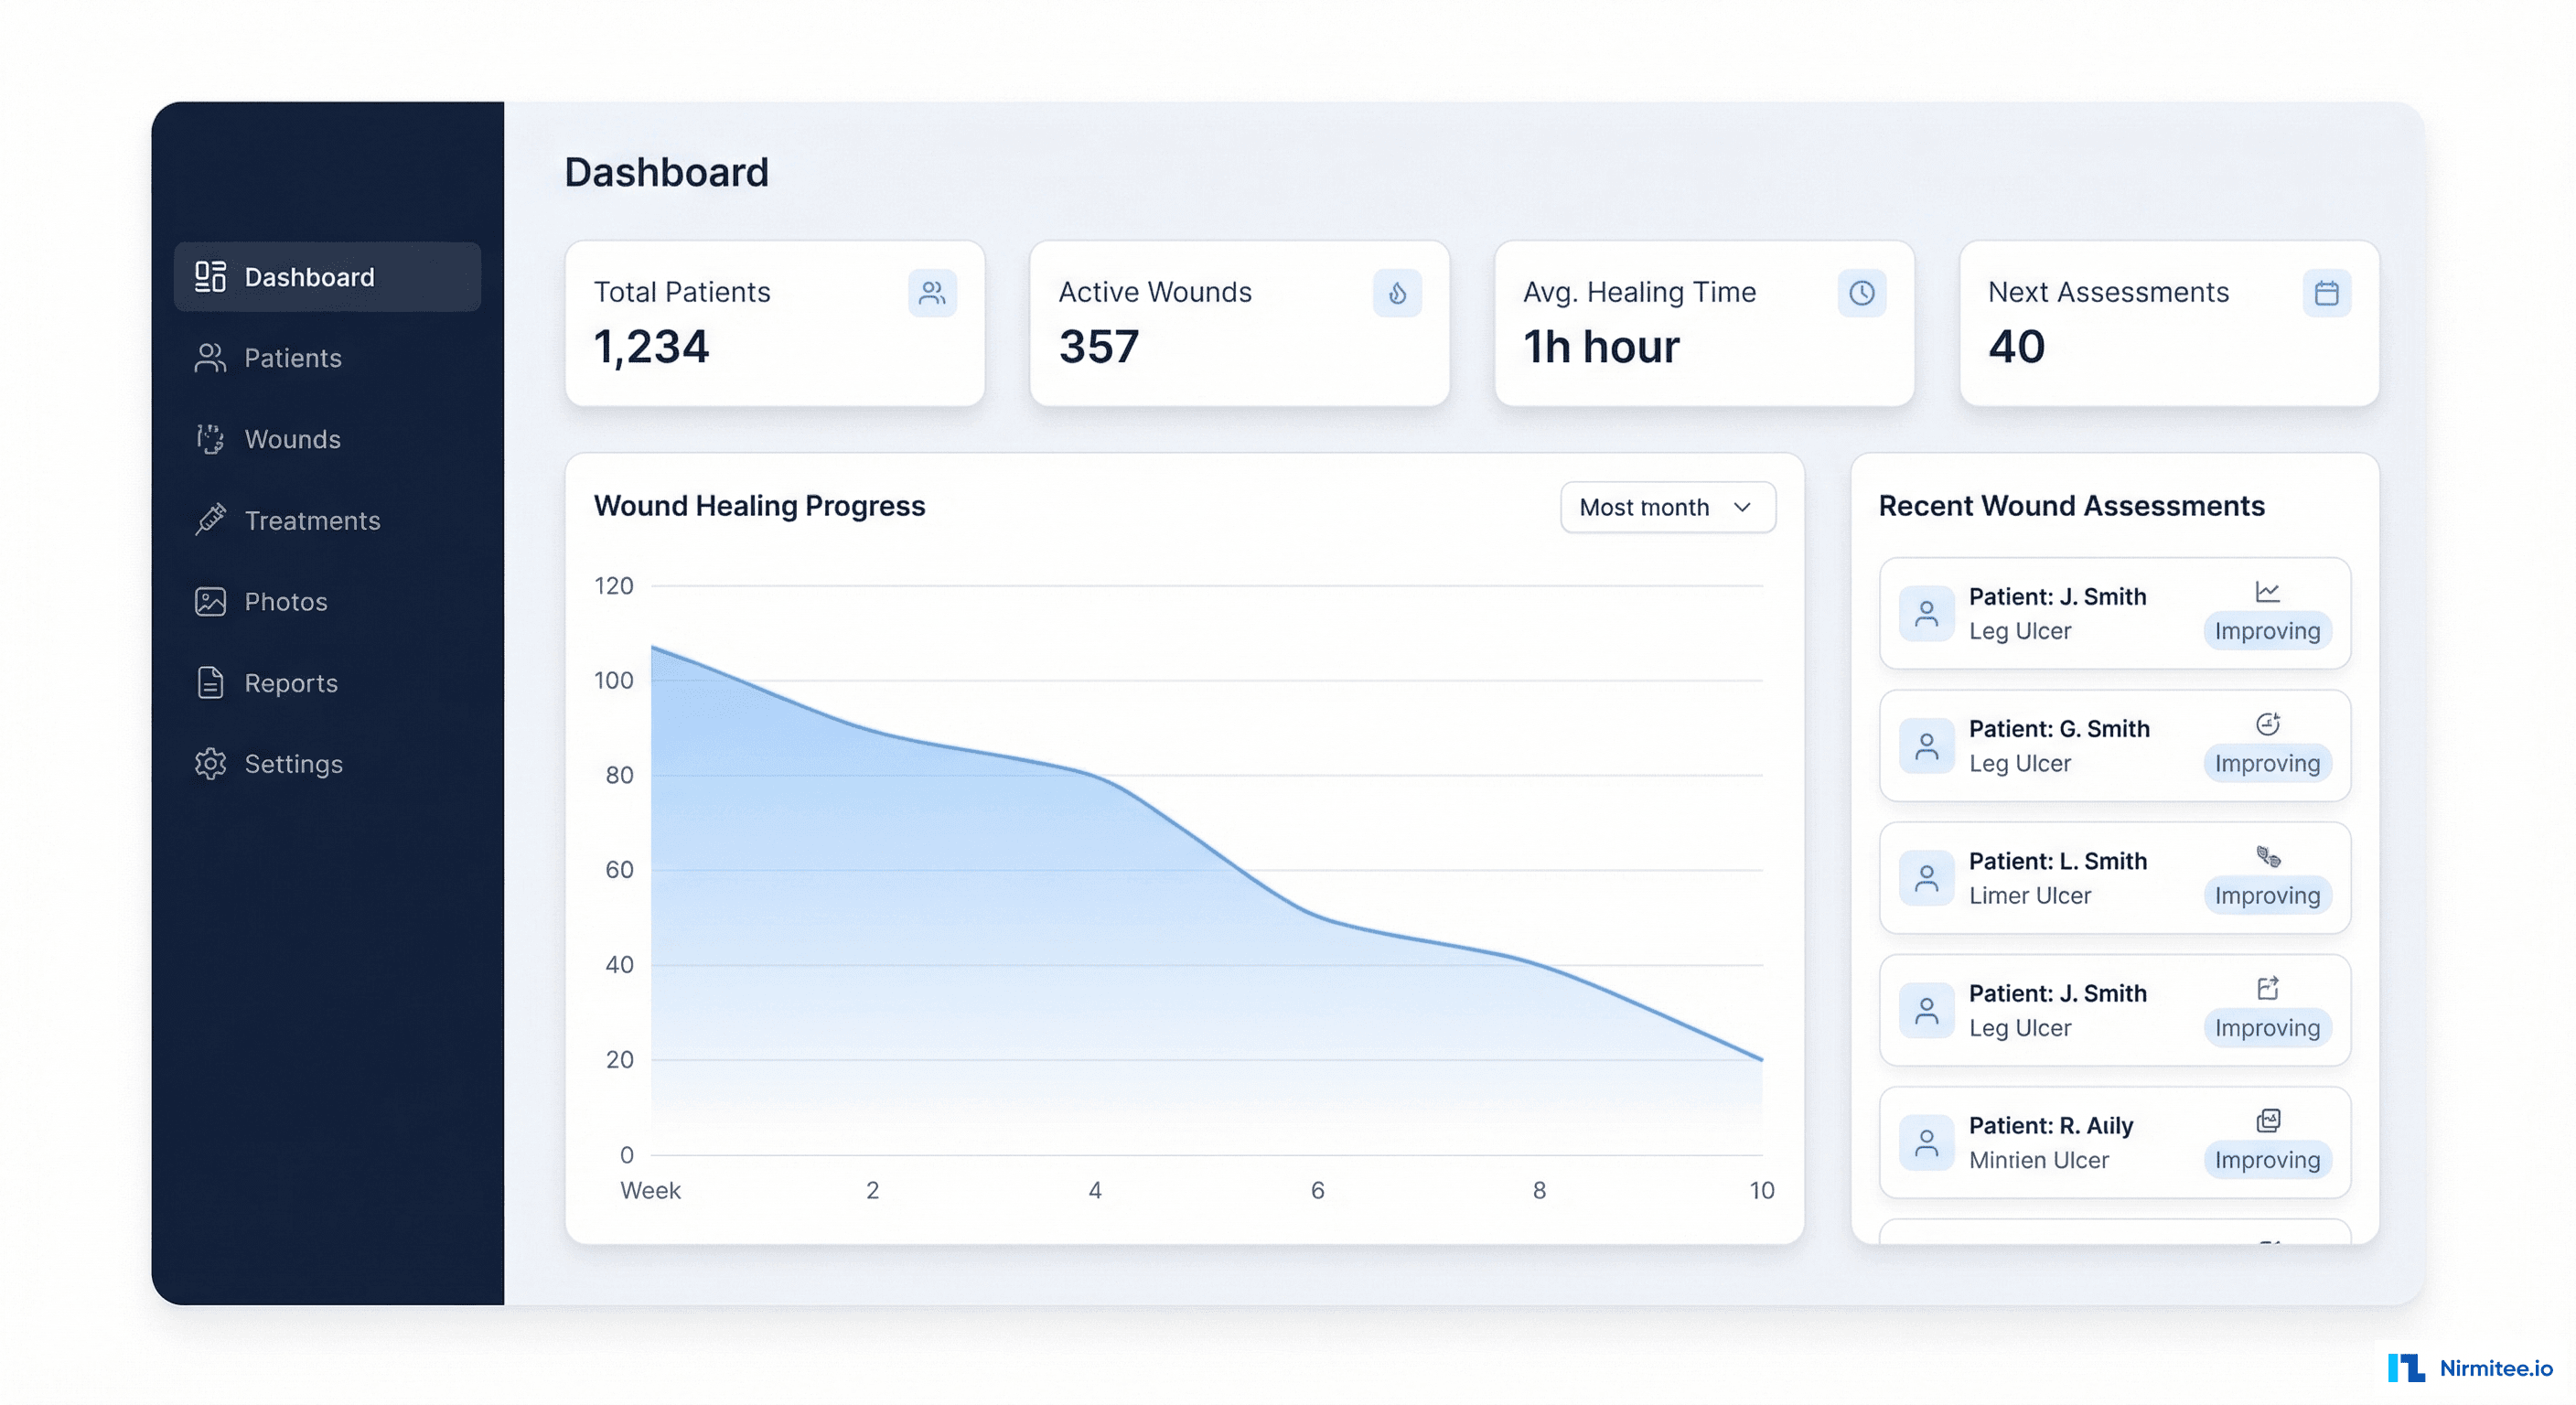
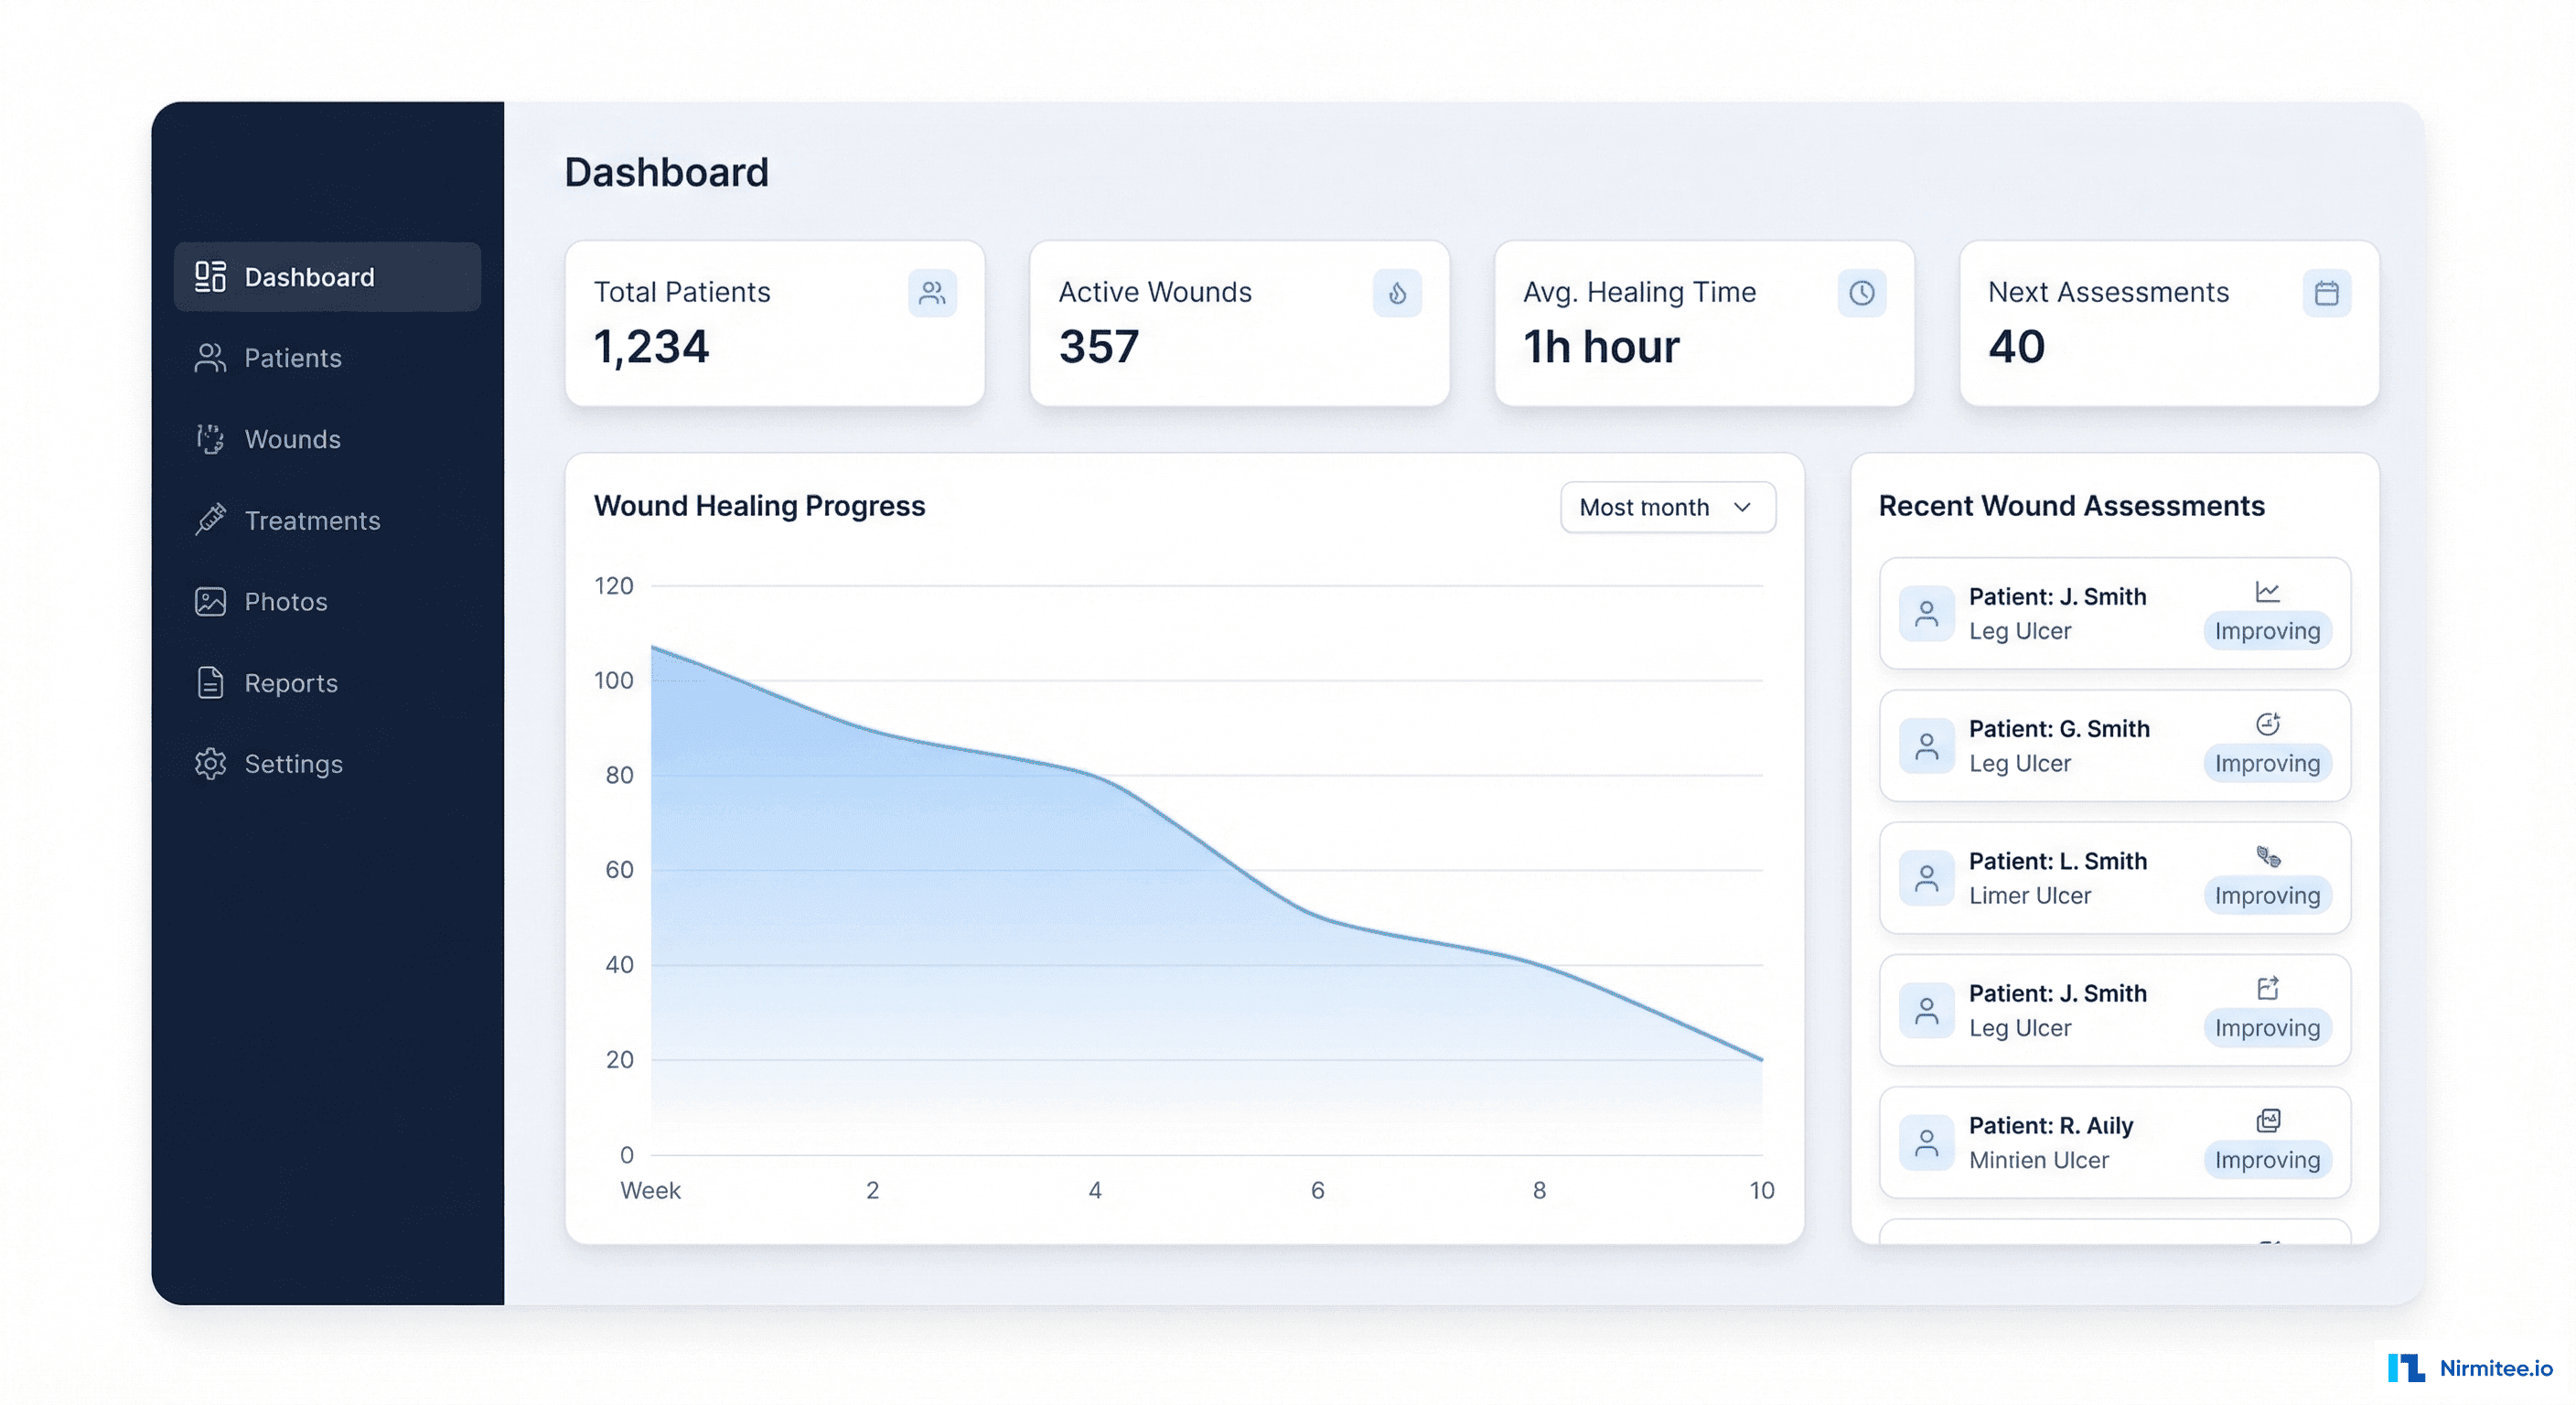
Analytics Dashboard
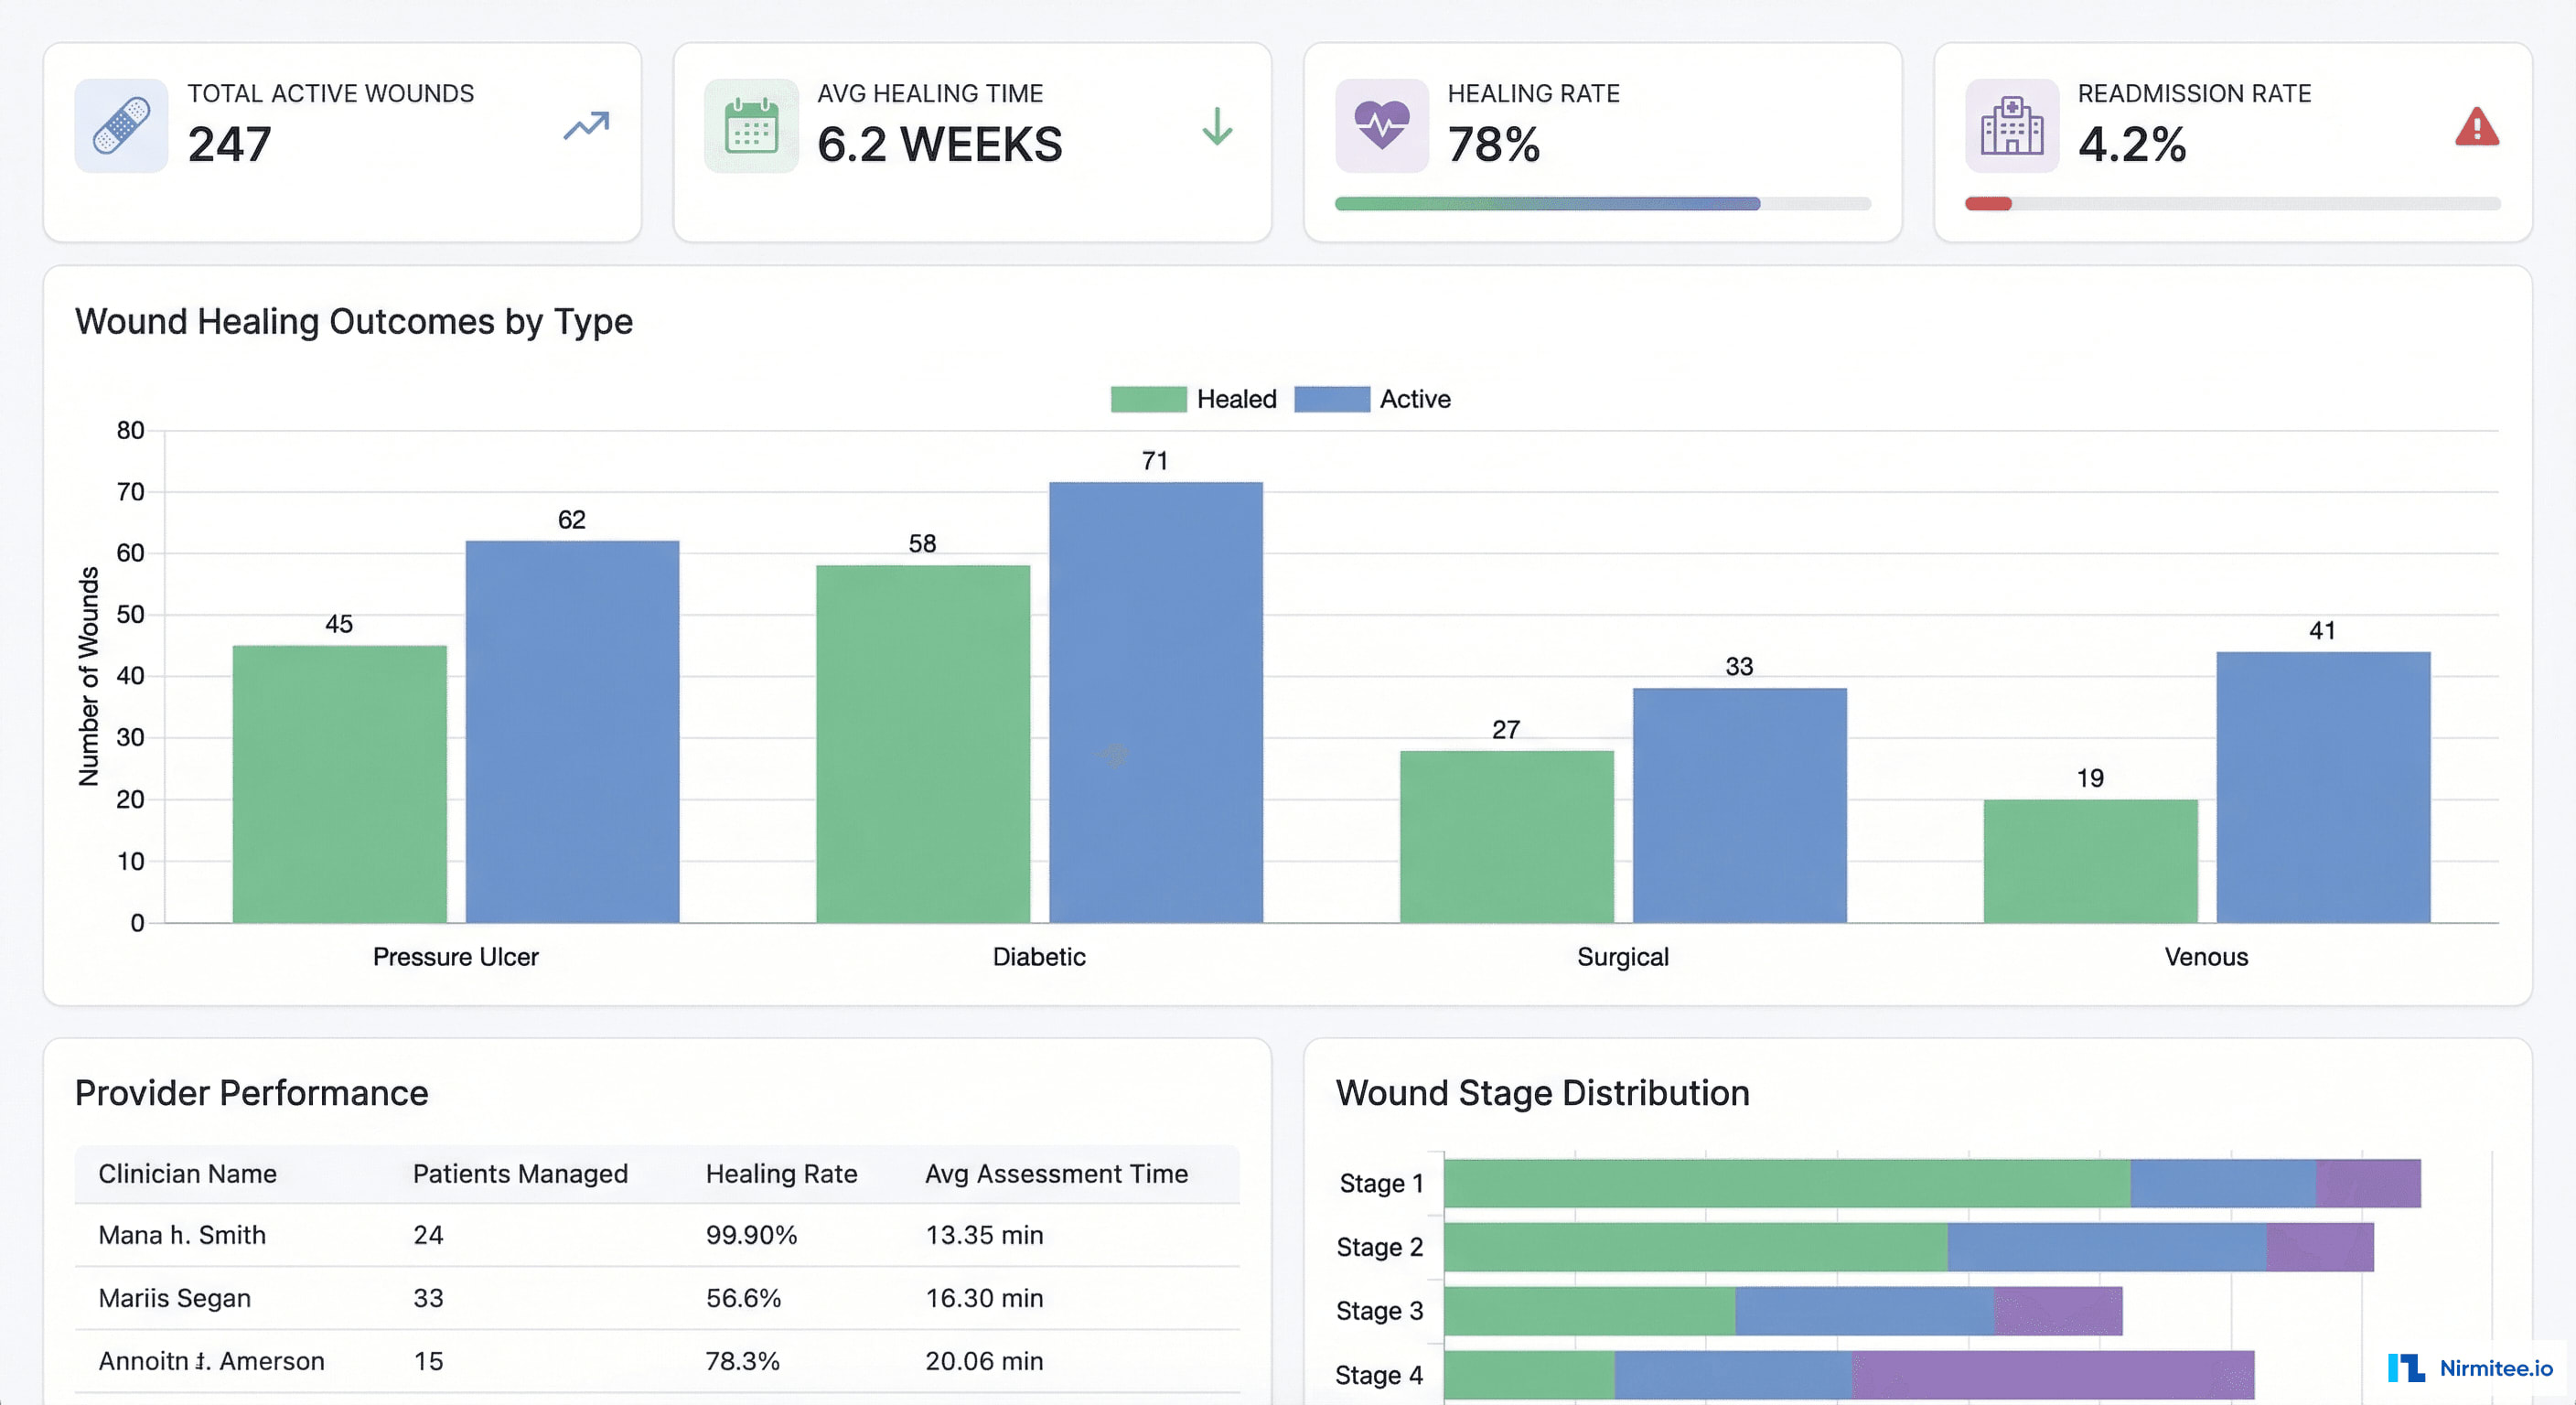
Practice-level analytics that were previously impossible with generic EHRs:
- Healing rate by wound type: pressure ulcers vs. diabetic vs. surgical vs. venous — identifying which wound types the practice excels at and where protocols need improvement
- Provider performance: healing rates and assessment times by clinician — enabling peer benchmarking and identifying training opportunities
- Readmission tracking: 4.2% wound-related readmission rate (down from 8.7%) — a key quality metric for value-based contracts
- Revenue analytics: CPT code utilization, average revenue per wound, billing accuracy — ensuring the practice captures full legitimate revenue
Results
| Metric | Before (Generic EHR) | After (Wound Care EMR) | Impact |
|---|---|---|---|
| Assessment time per wound | 23 minutes | 7 minutes | 70% faster |
| Wound healing rate | 64% | 78% | 22% improvement |
| Photo documentation compliance | ~40% (manual process) | 98% (integrated capture) | Comprehensive visual records |
| Missed follow-ups | ~12% of scheduled visits | 0% (automated reminders) | Zero missed visits |
| Wound-related readmissions | 8.7% | 4.2% | 52% reduction |
| Billing accuracy (CPT coding) | ~78% | 96% | 23% improvement → revenue uplift |
| Revenue per wound | $1,840 avg | $2,180 avg | $340/wound increase (18%) |
Financial Impact
For a practice managing 2,400 active wounds:
- Revenue uplift: $340/wound × 2,400 wounds = $816,000/year
- Time savings: 16 min saved × ~500 assessments/week = 133 hours/week freed
- Readmission reduction: 4.5% reduction × avg $12,000 readmission cost × 240 cases = $129,600/year saved
Timeline
| Phase | Duration | Deliverables |
|---|---|---|
| Phase 1 | 6 weeks | Wound assessment schema, mobile photo capture, basic web dashboard, PostgreSQL data model |
| Phase 2 | 6 weeks | Treatment plan builder, healing timeline, patient list, scheduling, wound measurement AI |
| Phase 3 | 4 weeks | EHR integration (FHIR), analytics dashboard, reporting engine, billing code suggestions |
| Phase 4 | 4 weeks | Multi-clinic deployment, staff training, data migration, compliance audit, go-live |
Total: 5 months with 3 engineers + 1 ML engineer.
Lessons Learned
- Specialty EMRs win because they understand the workflow. A wound care clinician's workflow is fundamentally different from a PCP's. Building the system around how wound care is actually practiced — assess, photograph, measure, treat, schedule — made adoption effortless.
- Healing timelines are the killer feature. Being able to visually show a wound closing over weeks is powerful for clinicians (treatment decisions), patients (motivation), and payers (justifying treatment costs).
- Structured data enables everything. The moment wound measurements became structured fields instead of free text, everything else became possible — healing trends, billing accuracy, quality metrics, research cohorts.
- Photo management sounds simple but isn't. Reliable photo capture, secure storage, HIPAA compliance, chronological organization, side-by-side comparison, and measurement overlay — this was 25% of the engineering effort.
Share
Related Case Studies
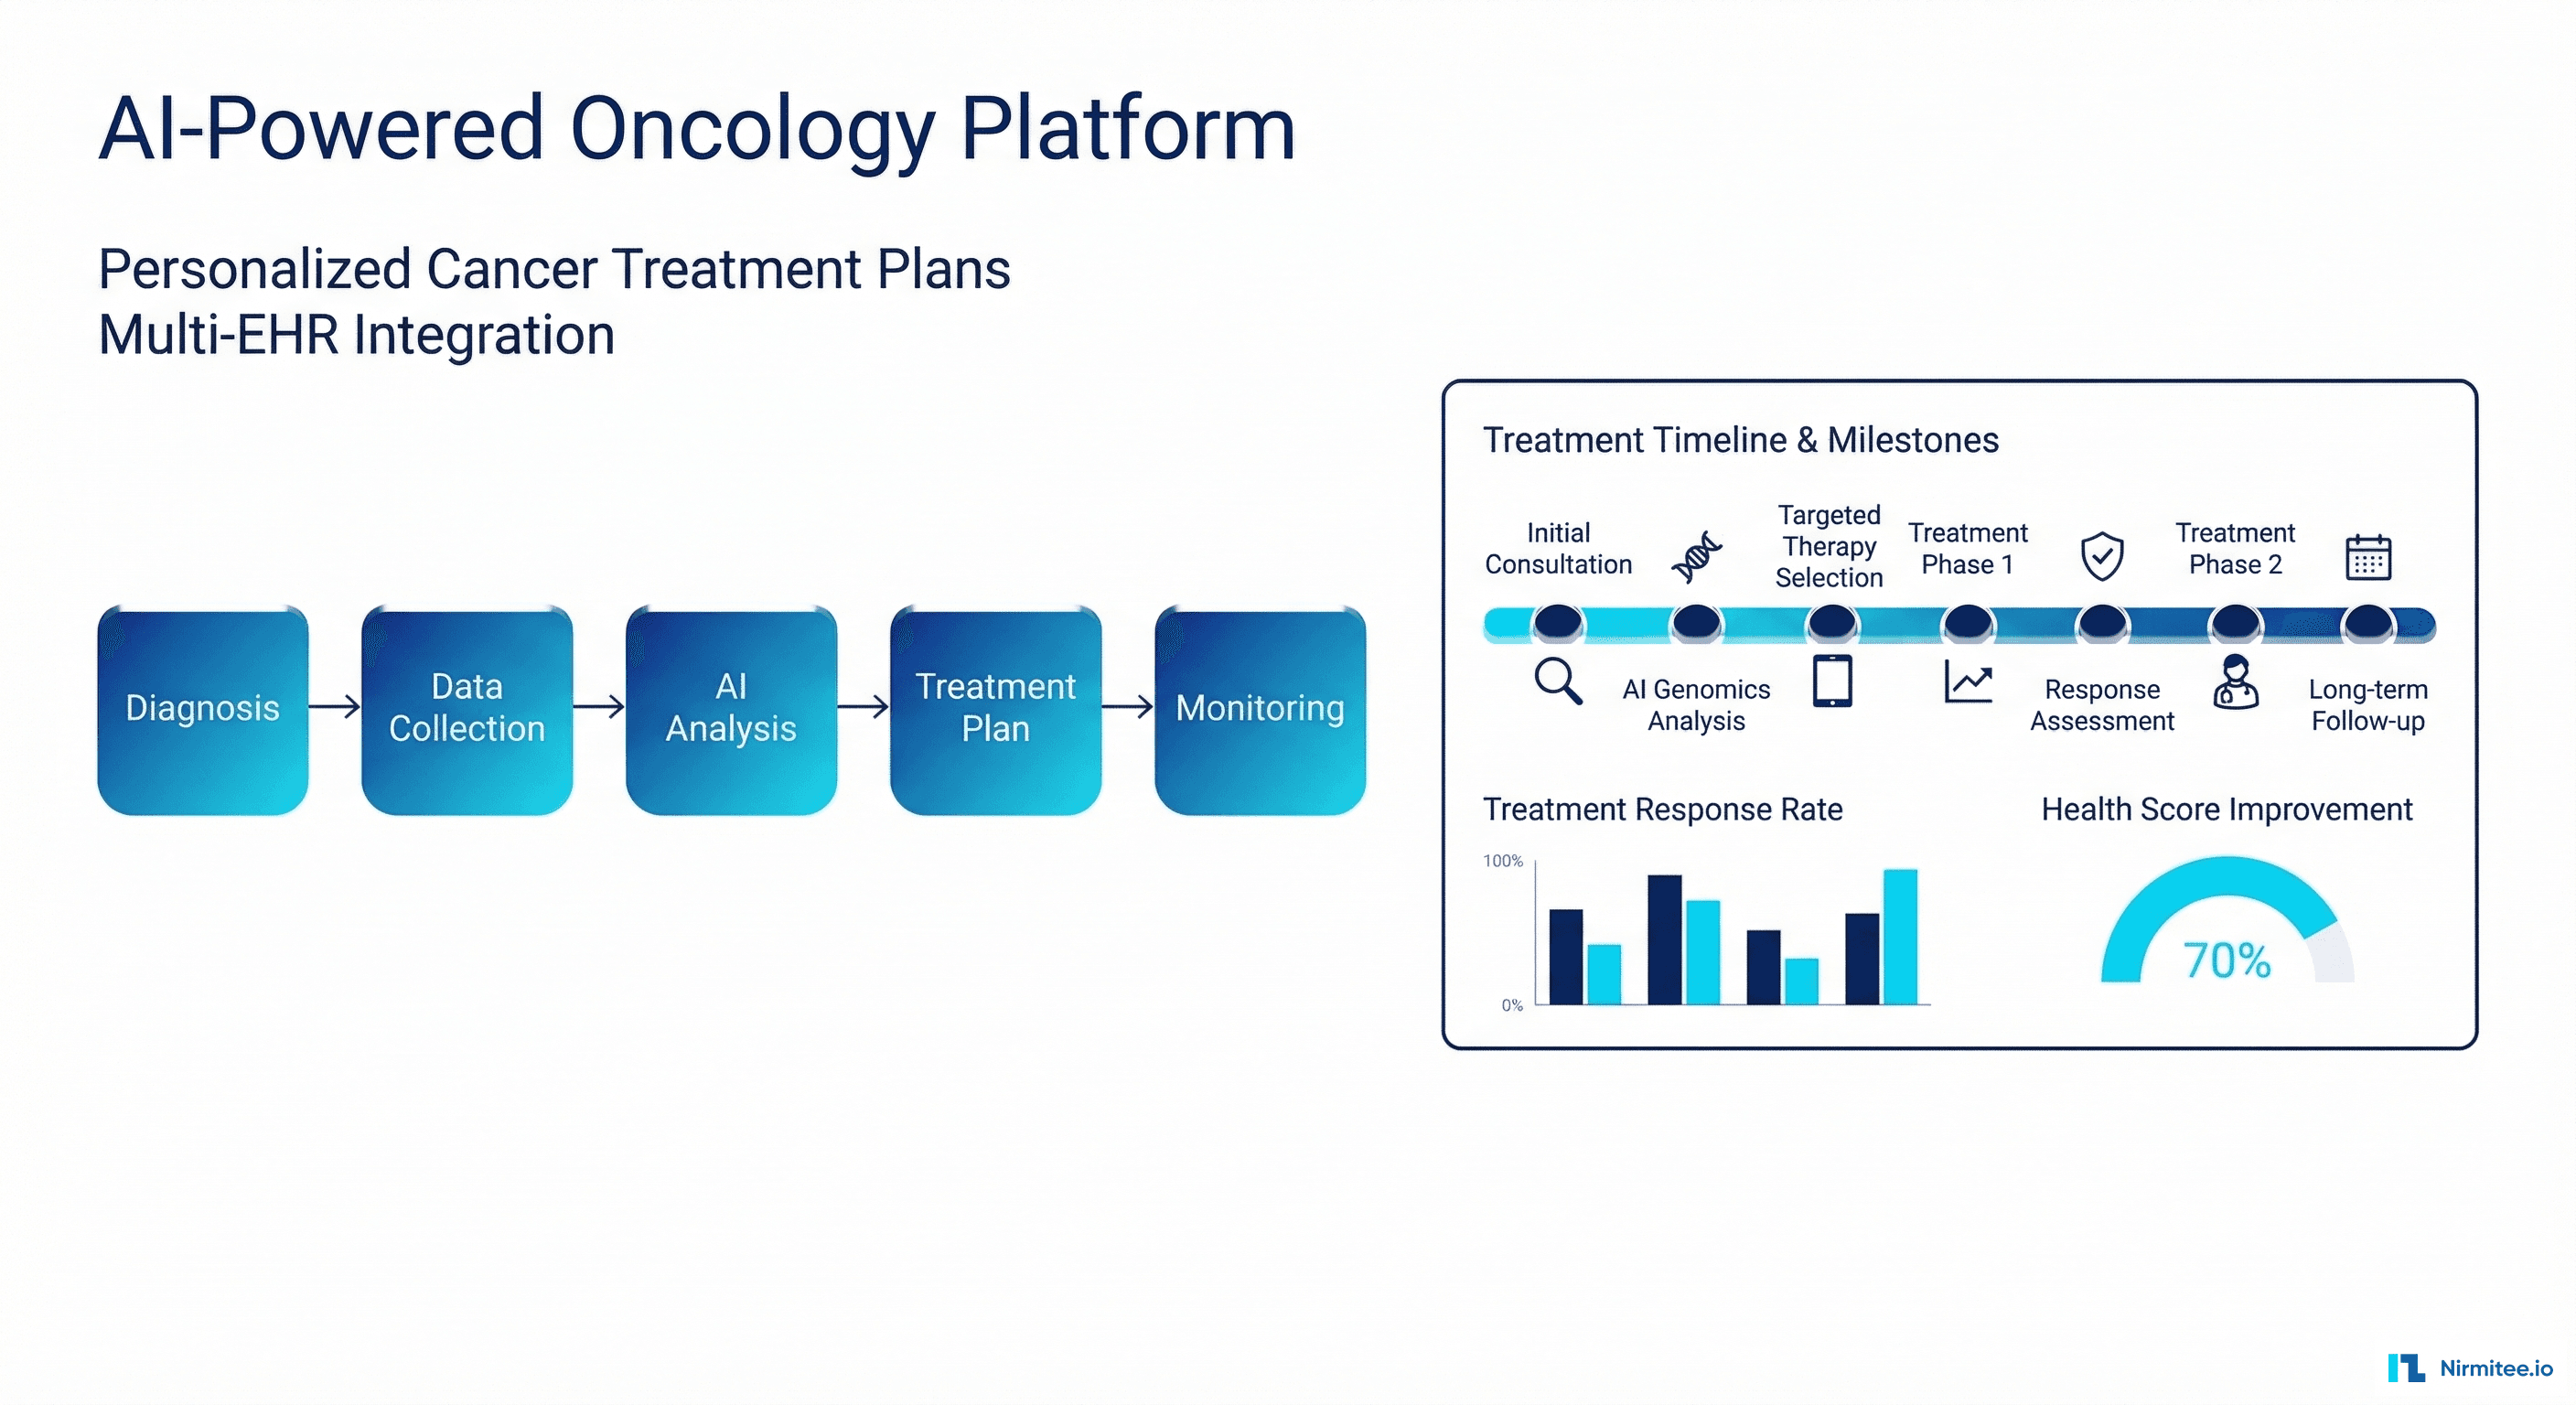
AI-Powered Personalized Oncology Treatment Platform: A Technical Case Study
Building a Patient-First Health Record Platform: Connecting 12 US EMRs Into One View