The Pain Management Crisis in Numbers
Chronic pain affects 50 million Americans, according to the CDC. Of those, 19.6 million experience high-impact chronic pain that interferes with daily life. The annual economic burden of chronic pain in the U.S. exceeds $635 billion — more than cancer, heart disease, and diabetes combined.
Yet the tools clinicians use to manage pain remain largely paper-based questionnaires, subjective assessments, and one-size-fits-all treatment protocols. This case study documents how we built a digital pain management platform that combines FHIR-structured patient data, machine learning for pain trajectory prediction, multimodal treatment planning, and opioid risk scoring into a single clinical tool.
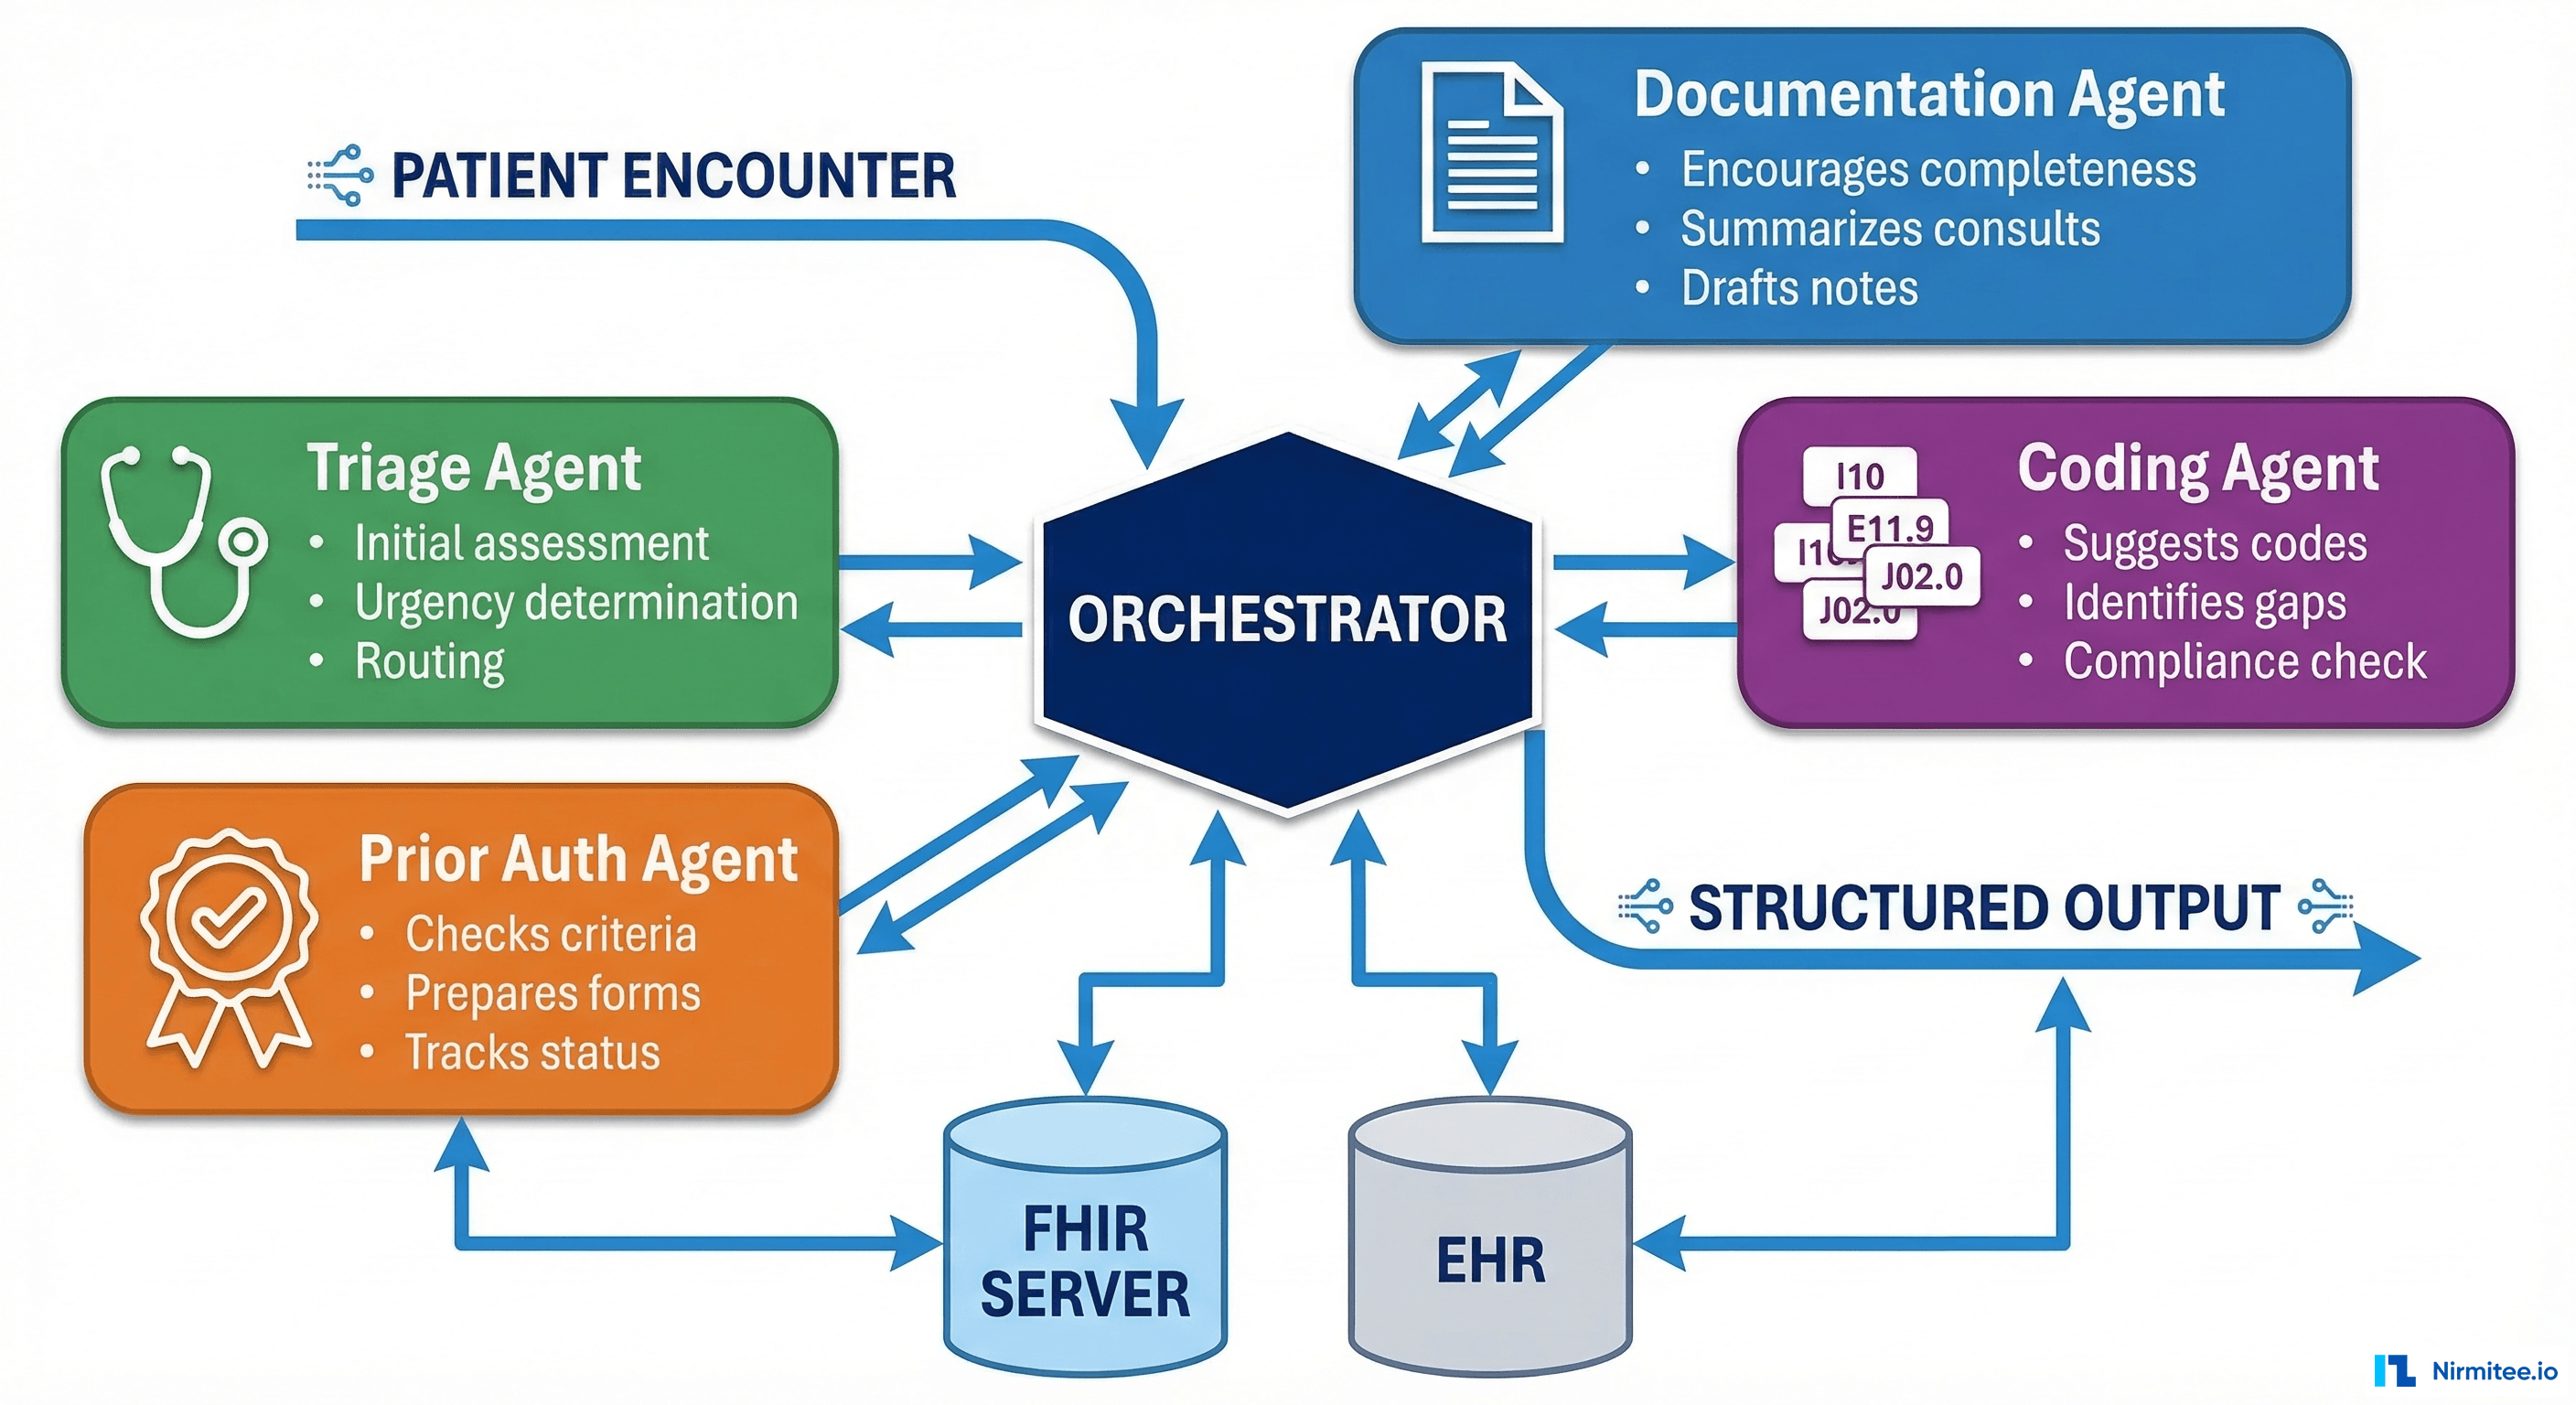
Platform Architecture: FHIR-First Design
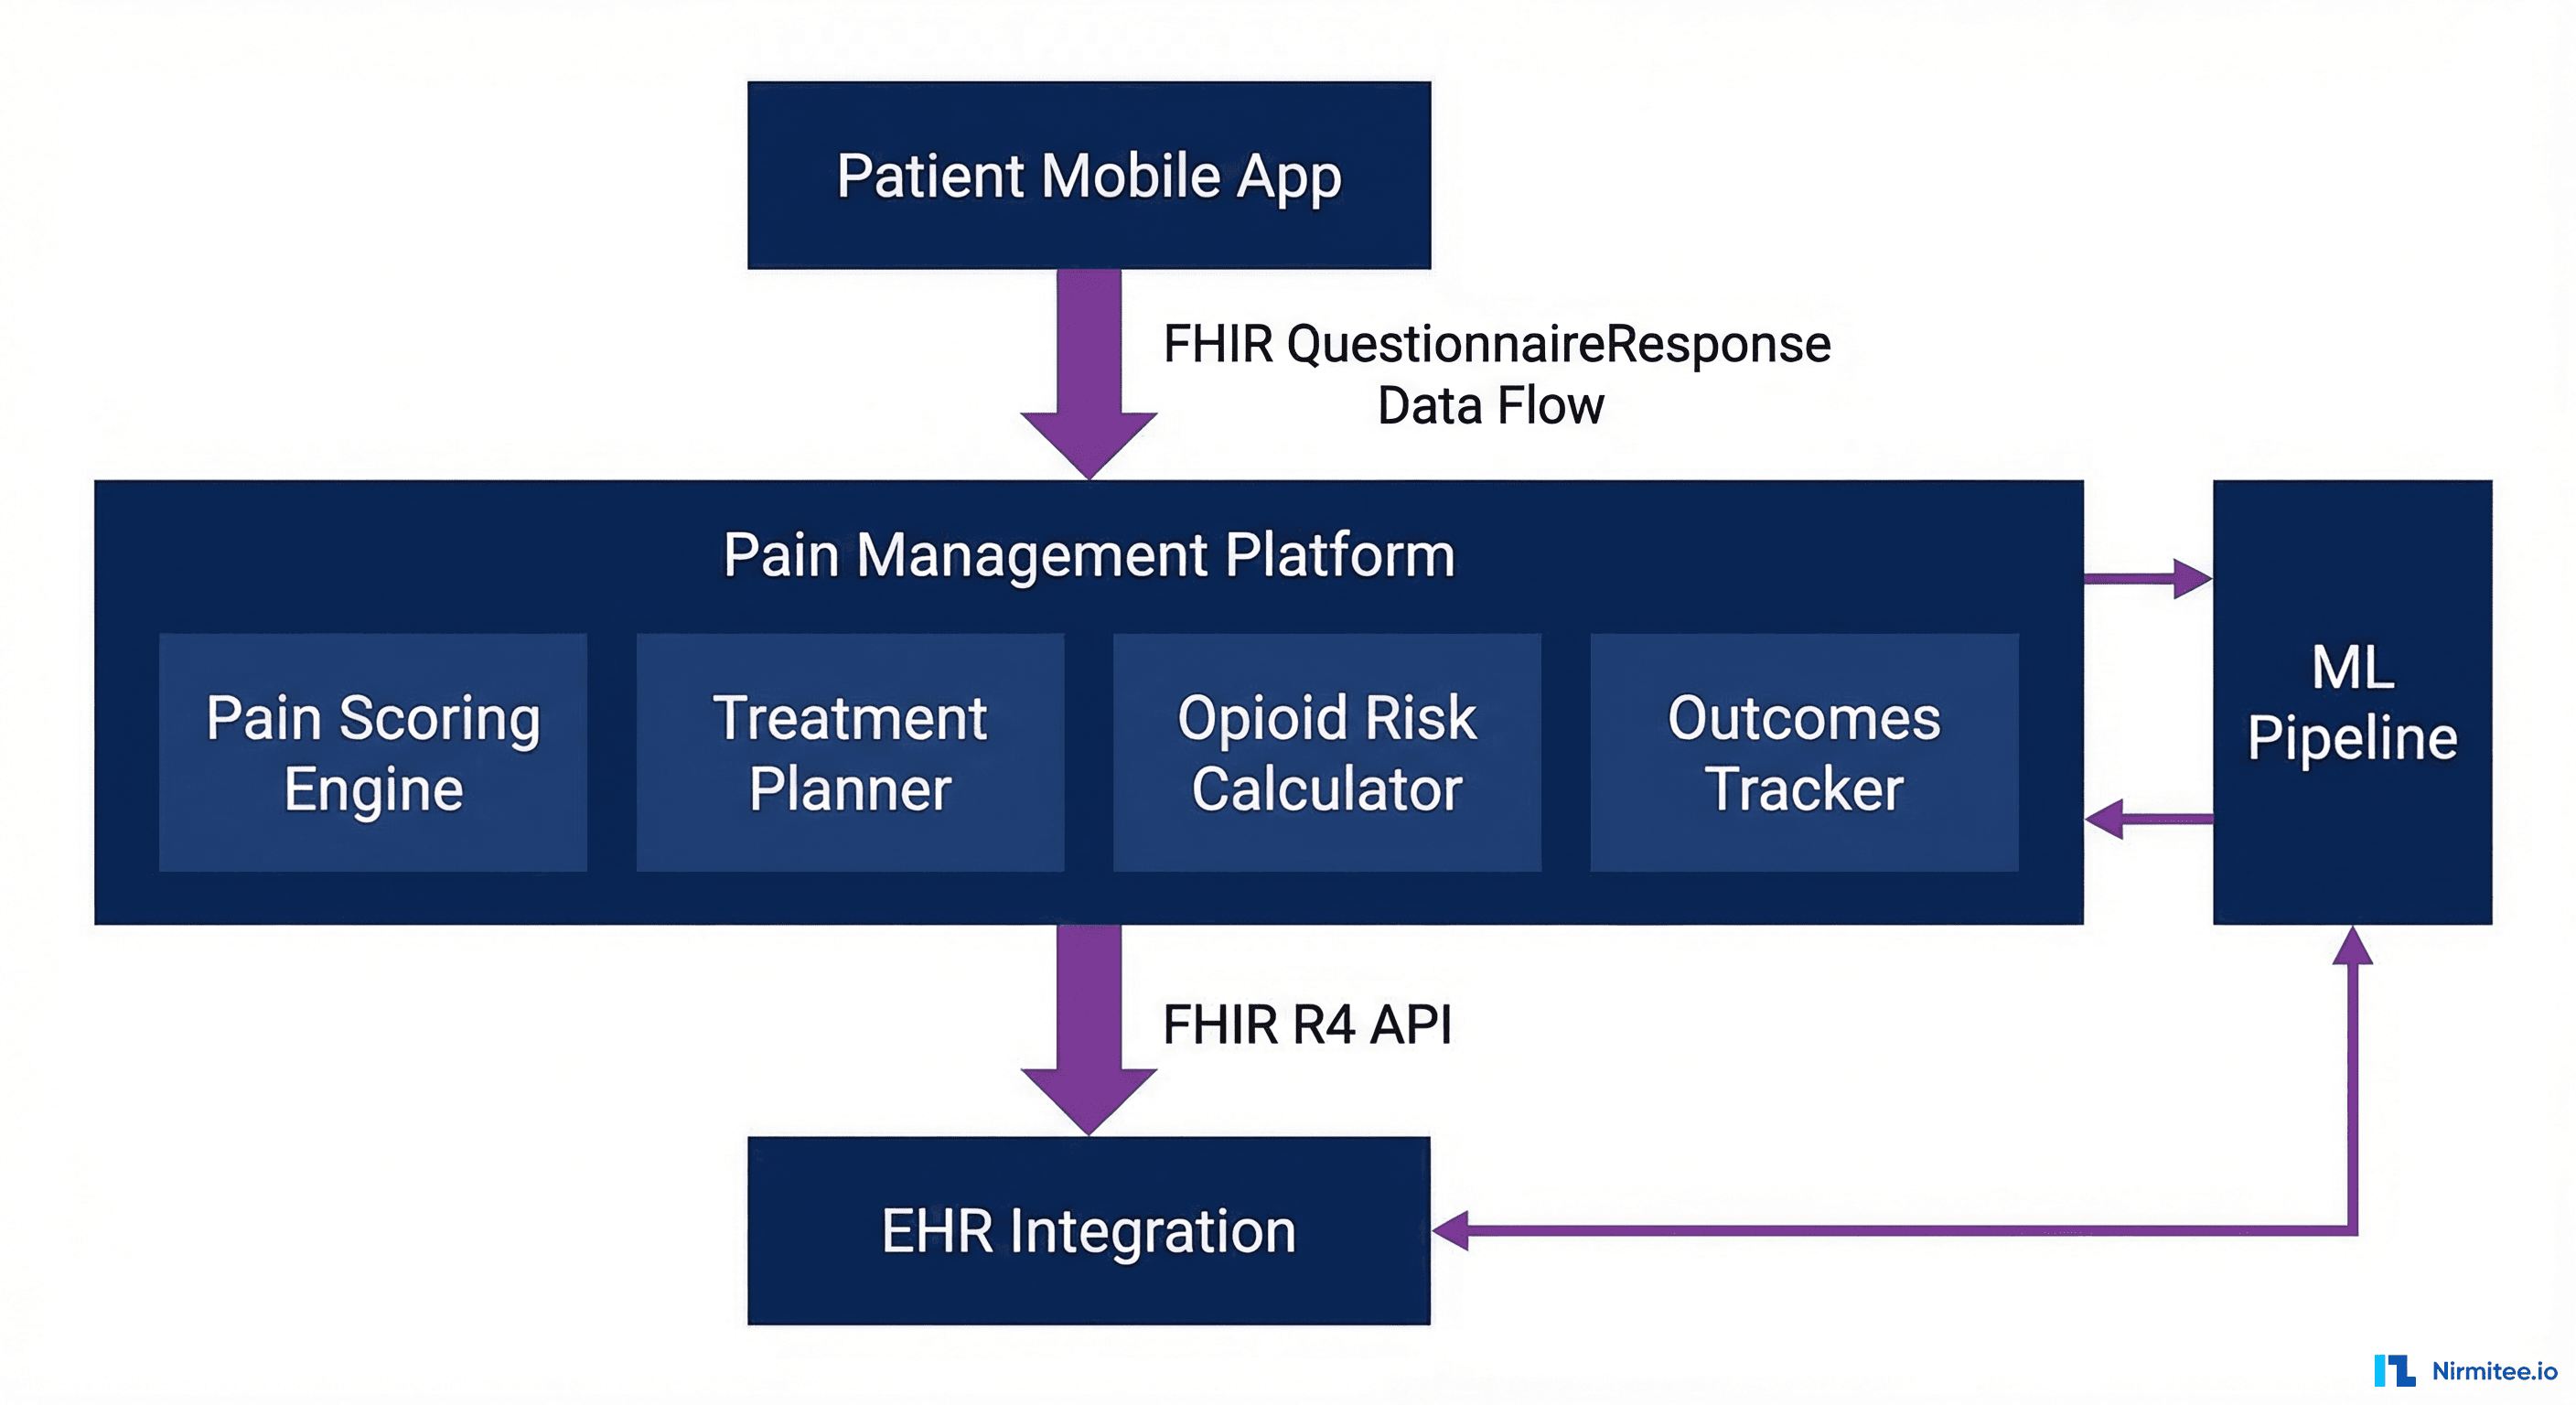
The platform was designed as a FHIR-native application from day one. Every piece of clinical data — pain assessments, treatment plans, medication orders, and outcomes — is represented as a FHIR R4 resource. This means the platform integrates with any FHIR-compliant EHR without custom mapping.
Core FHIR Resources
| Clinical Data | FHIR Resource | Key Elements | Update Frequency |
|---|---|---|---|
| Pain assessment | QuestionnaireResponse | Pain intensity (NRS 0-10), location, quality descriptors, functional impact | Every visit + daily via mobile |
| Treatment plan | CarePlan | Multimodal activities: medications, physical therapy, behavioral health, interventional procedures | Reviewed weekly |
| Medications | MedicationRequest | Analgesics with MME calculation, adjuvant medications, tapering schedules | As prescribed |
| Opioid risk | RiskAssessment | ORT score, PDMP data, risk factors, recommended actions | Every opioid encounter |
| Outcomes | Observation | Pain scores over time, functional status, medication usage, patient satisfaction | Continuous tracking |
| Patient-reported | QuestionnaireResponse | PHQ-9 (depression), GAD-7 (anxiety), PCS (catastrophizing), PROMIS-29 | Biweekly |
FHIR QuestionnaireResponse for Pain Assessment
{
  "resourceType": "QuestionnaireResponse",
  "questionnaire": "https://pain-platform.example.com/Questionnaire/brief-pain-inventory",
  "status": "completed",
  "subject": { "reference": "Patient/12345" },
  "encounter": { "reference": "Encounter/67890" },
  "authored": "2026-03-17T10:30:00Z",
  "item": [
    {
      "linkId": "pain-intensity-now",
      "text": "Rate your pain RIGHT NOW (0 = No pain, 10 = Worst pain imaginable)",
      "answer": [{ "valueInteger": 6 }]
    },
    {
      "linkId": "pain-worst-24h",
      "text": "Worst pain in the last 24 hours",
      "answer": [{ "valueInteger": 8 }]
    },
    {
      "linkId": "pain-location",
      "text": "Primary pain location",
      "answer": [{ "valueCoding": { "system": "http://snomed.info/sct", "code": "264186006", "display": "Lower back" } }]
    },
    {
      "linkId": "pain-interference-activity",
      "text": "How much has pain interfered with general activity?",
      "answer": [{ "valueInteger": 7 }]
    },
    {
      "linkId": "pain-interference-sleep",
      "text": "How much has pain interfered with sleep?",
      "answer": [{ "valueInteger": 5 }]
    }
  ]
}
Multimodal Pain Assessment: Beyond the 0-10 Scale
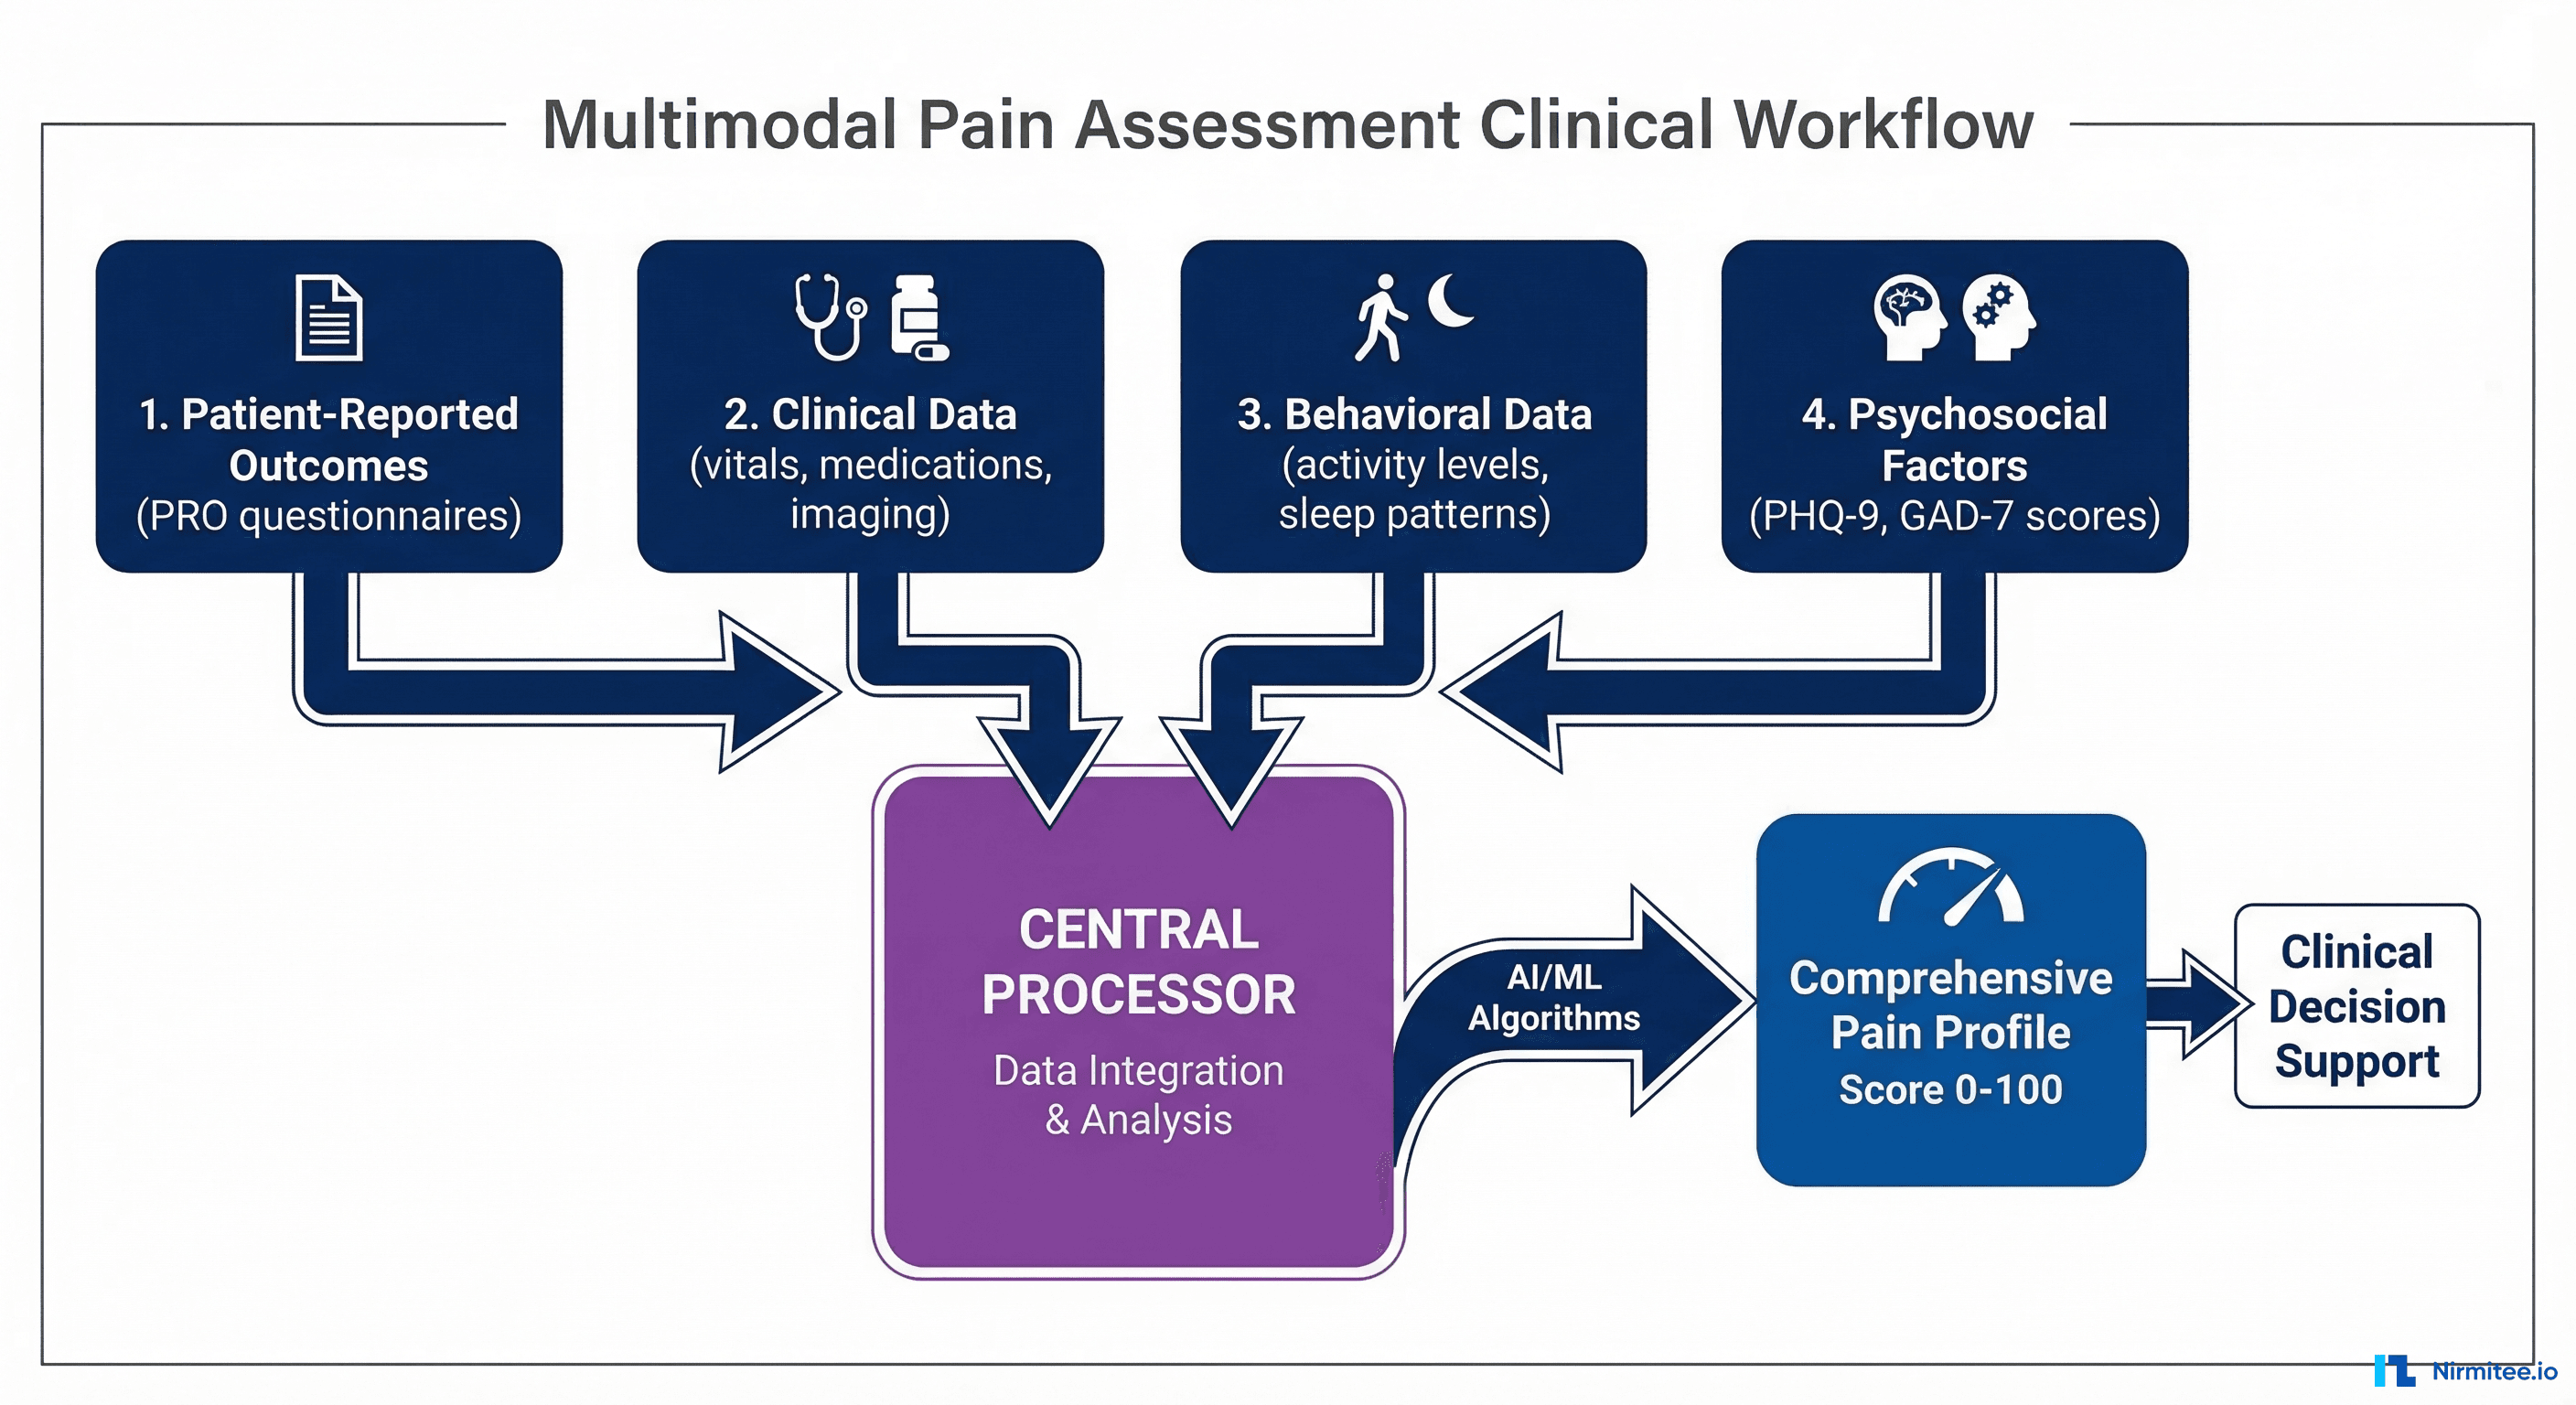
The traditional Numeric Rating Scale (NRS) — asking patients to rate their pain from 0 to 10 — captures a single dimension of a complex experience. Our platform collects data across four domains to build a comprehensive pain profile.
Domain 1: Patient-Reported Outcomes (PROs)
- Brief Pain Inventory (BPI) — Pain intensity and functional interference across seven domains
- PROMIS-29 — Physical function, anxiety, depression, fatigue, sleep disturbance, social participation, pain interference
- Pain Catastrophizing Scale (PCS) — Measures rumination, magnification, and helplessness related to pain
- Oswestry Disability Index (ODI) — For back pain patients: functional limitations in daily activities
Domain 2: Clinical Data from EHR
- Medication history — Current and historical analgesics, adjuvant medications, Morphine Milligram Equivalent (MME) calculations. Pulled from FHIR MedicationRequest.
- Diagnoses — ICD-10 pain-related diagnoses, comorbidities (depression, anxiety, substance use disorders)
- Procedures — Interventional procedures (injections, nerve blocks, spinal cord stimulation), physical therapy sessions
- Imaging — MRI, CT, and X-ray findings coded in SNOMED CT
Domain 3: Behavioral and Wearable Data
- Activity levels — Step count, active minutes, and mobility patterns from wearable devices via Apple HealthKit or Google Health Connect
- Sleep quality — Total sleep time, sleep efficiency, wake episodes from sleep trackers
- Heart rate variability (HRV) — A biomarker correlated with pain intensity and autonomic nervous system function
Domain 4: Psychosocial Factors
- PHQ-9 (depression) — Depression is present in 40-60% of chronic pain patients and directly impacts treatment outcomes
- GAD-7 (anxiety) — Anxiety amplifies pain perception and reduces treatment adherence
- Social determinants — Employment status, social support, housing stability affect pain management outcomes
ML-Powered Pain Trajectory Prediction
The platform uses machine learning to predict each patient's likely pain trajectory over the next 90 days. This allows clinicians to intervene early for patients whose pain is predicted to worsen, rather than waiting for deterioration.
Feature Engineering
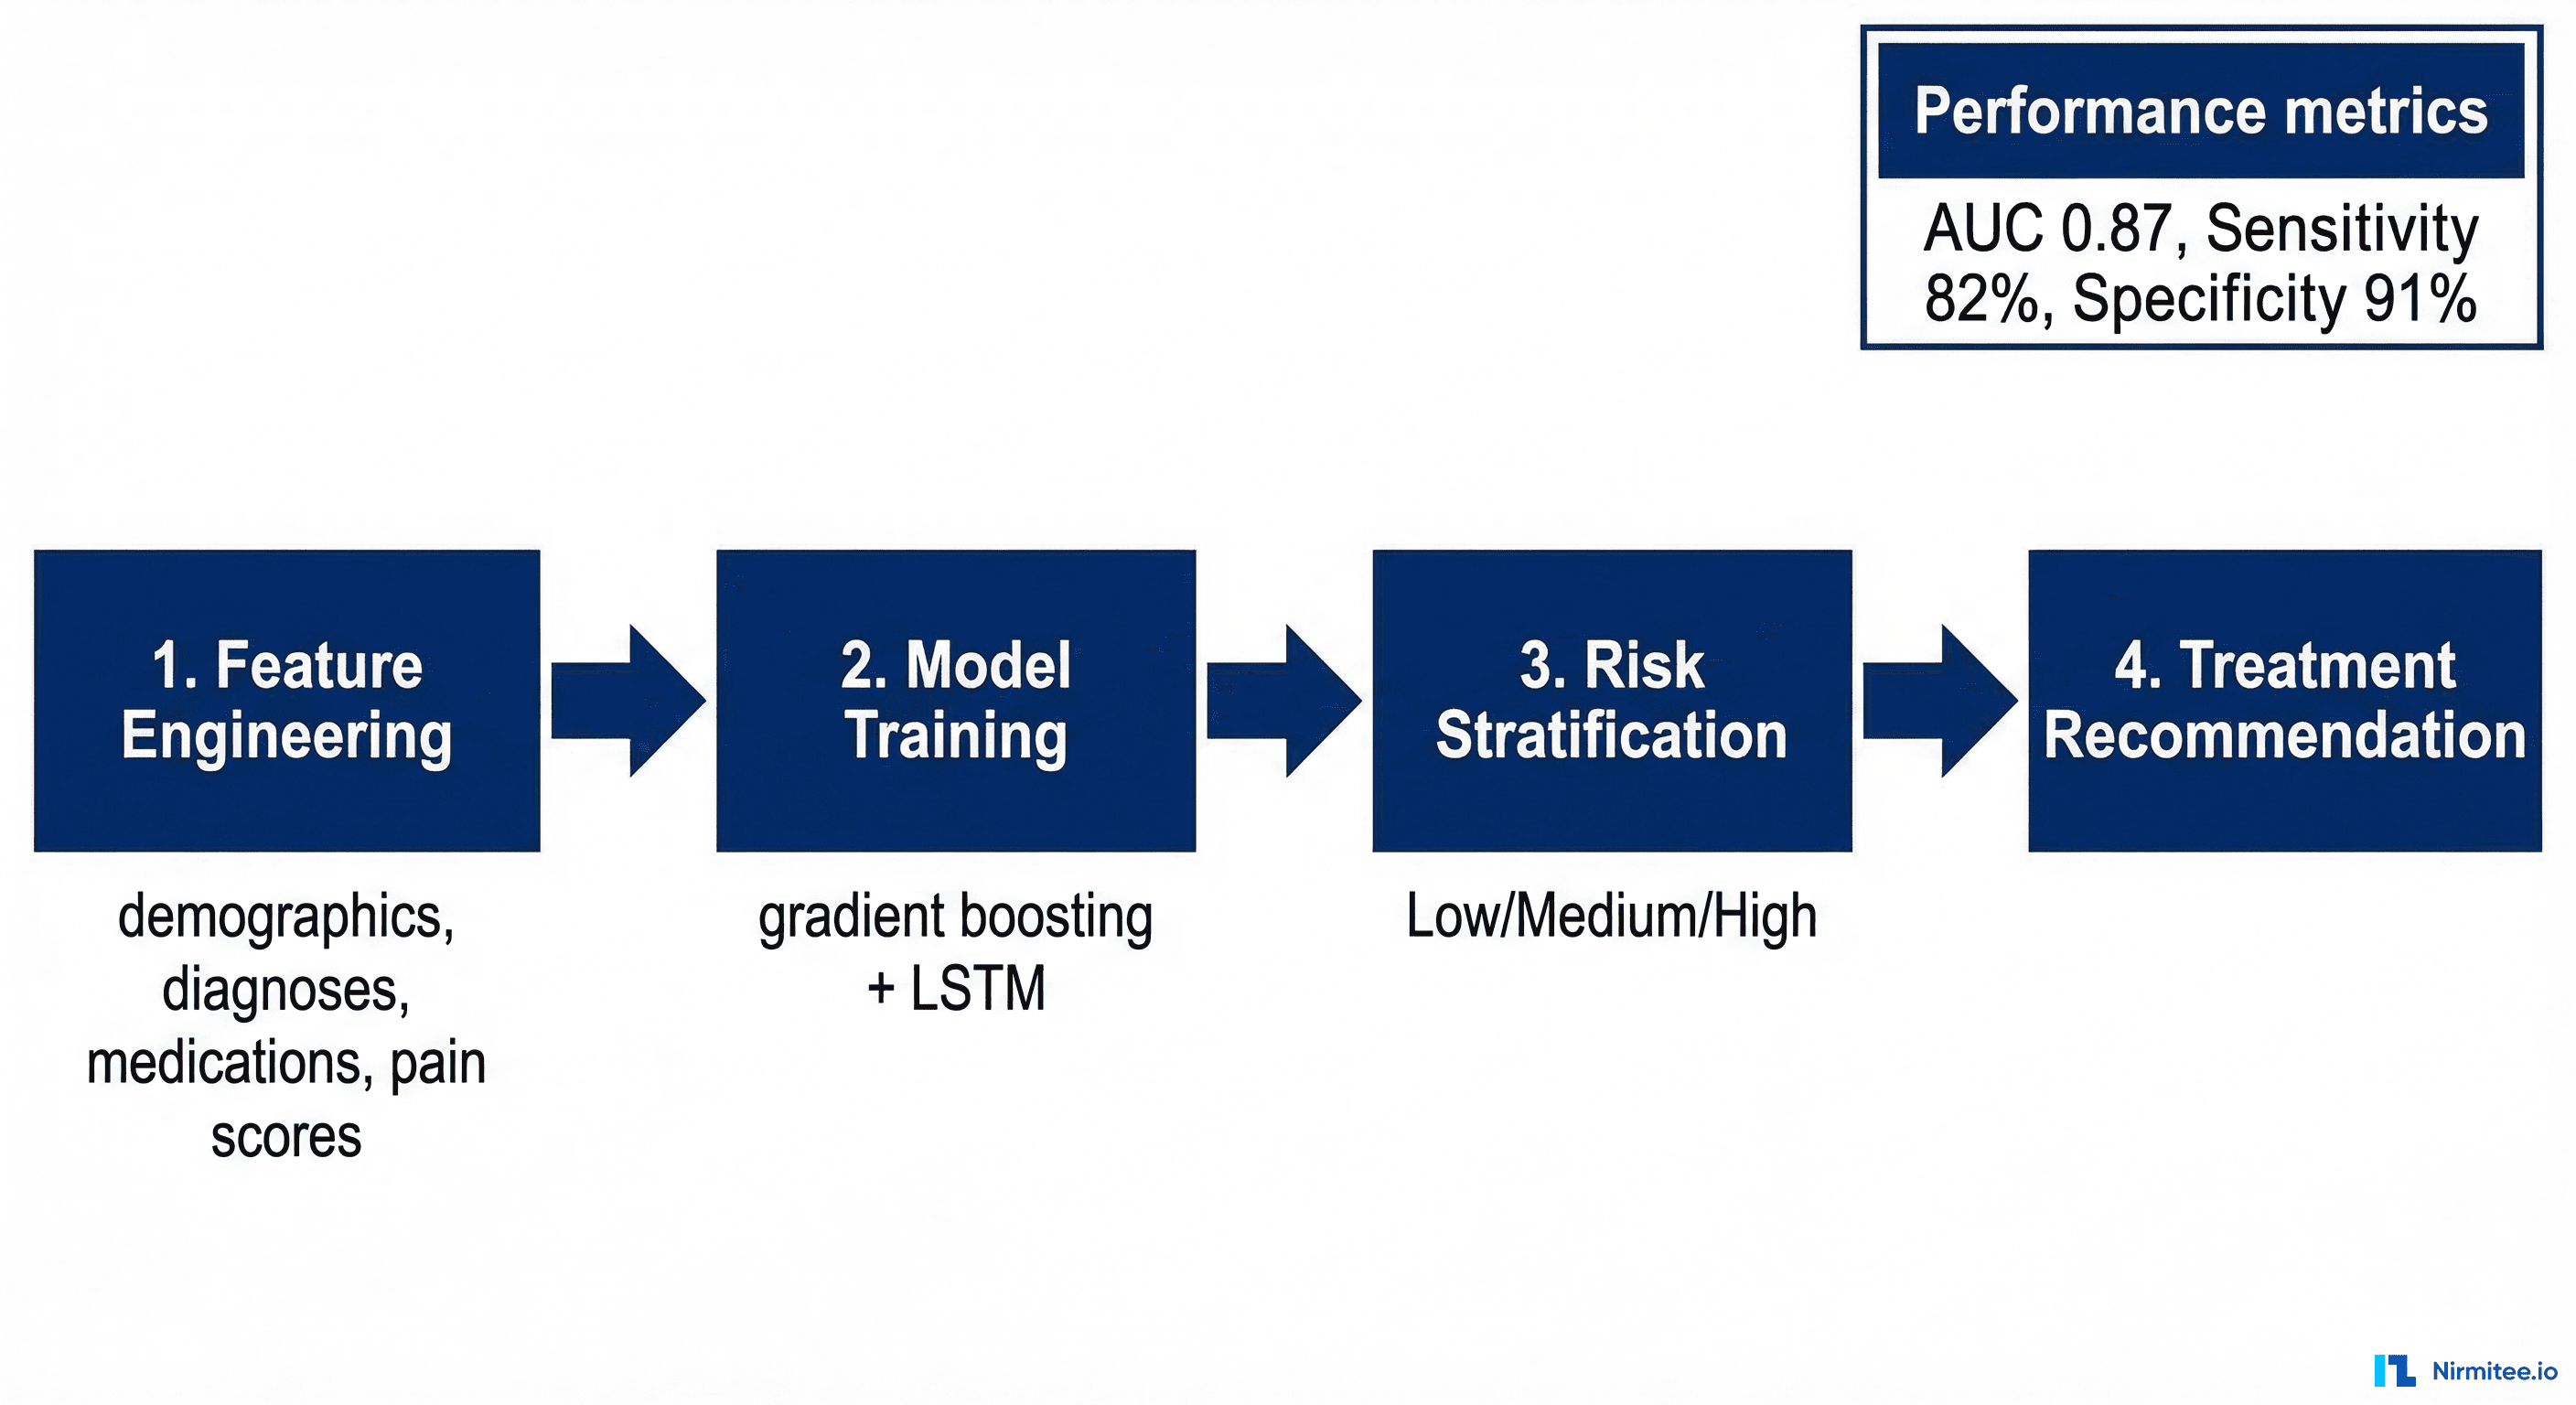
The model ingests 78 features grouped into five categories:
| Feature Category | Features | Source |
|---|---|---|
| Demographics | Age, sex, BMI, employment status | Patient demographics |
| Pain history | NRS scores (7/30/90 day trends), pain duration, location count, quality descriptors | QuestionnaireResponse time series |
| Medications | Current MME, medication count, NSAID use, adjuvant medications, tapering status | MedicationRequest history |
| Comorbidities | PHQ-9 score, GAD-7 score, substance use history, sleep disorder, obesity | Condition resources + PROs |
| Treatment engagement | PT session attendance, follow-up appointment adherence, app engagement score | CarePlan + Encounter + app analytics |
Model Architecture
We use an ensemble approach combining gradient boosted trees (XGBoost) for tabular features with an LSTM (Long Short-Term Memory) network for temporal pain score sequences.
import xgboost as xgb
from tensorflow.keras.models import Model
from tensorflow.keras.layers import LSTM, Dense, Input, Concatenate

# Tabular features: demographics, medications, comorbidities
tabular_input = Input(shape=(52,), name="tabular_features")
tab_dense = Dense(128, activation="relu")(tabular_input)
tab_dense = Dense(64, activation="relu")(tab_dense)

# Temporal features: 90-day pain score sequence + daily activity
temporal_input = Input(shape=(90, 6), name="temporal_features")
lstm_out = LSTM(64, return_sequences=False)(temporal_input)

# Ensemble: combine both branches
combined = Concatenate()([tab_dense, lstm_out])
combined = Dense(64, activation="relu")(combined)
output = Dense(3, activation="softmax", name="trajectory")(combined)
# Classes: improving (0), stable (1), worsening (2)

model = Model(inputs=[tabular_input, temporal_input], outputs=output)
model.compile(optimizer="adam", loss="categorical_crossentropy", metrics=["accuracy"])
Model Performance
| Metric | Value | Clinical Benchmark |
|---|---|---|
| AUC-ROC (worsening trajectory) | 0.87 | Above 0.80 considered clinically useful |
| Sensitivity (worsening) | 82% | Catches 82% of patients who will worsen |
| Specificity | 91% | Low false positive rate reduces alert fatigue |
| PPV (positive predictive value) | 74% | 74% of predicted-worsening patients actually worsen |
| Calibration | Brier score 0.12 | Well-calibrated probability estimates |
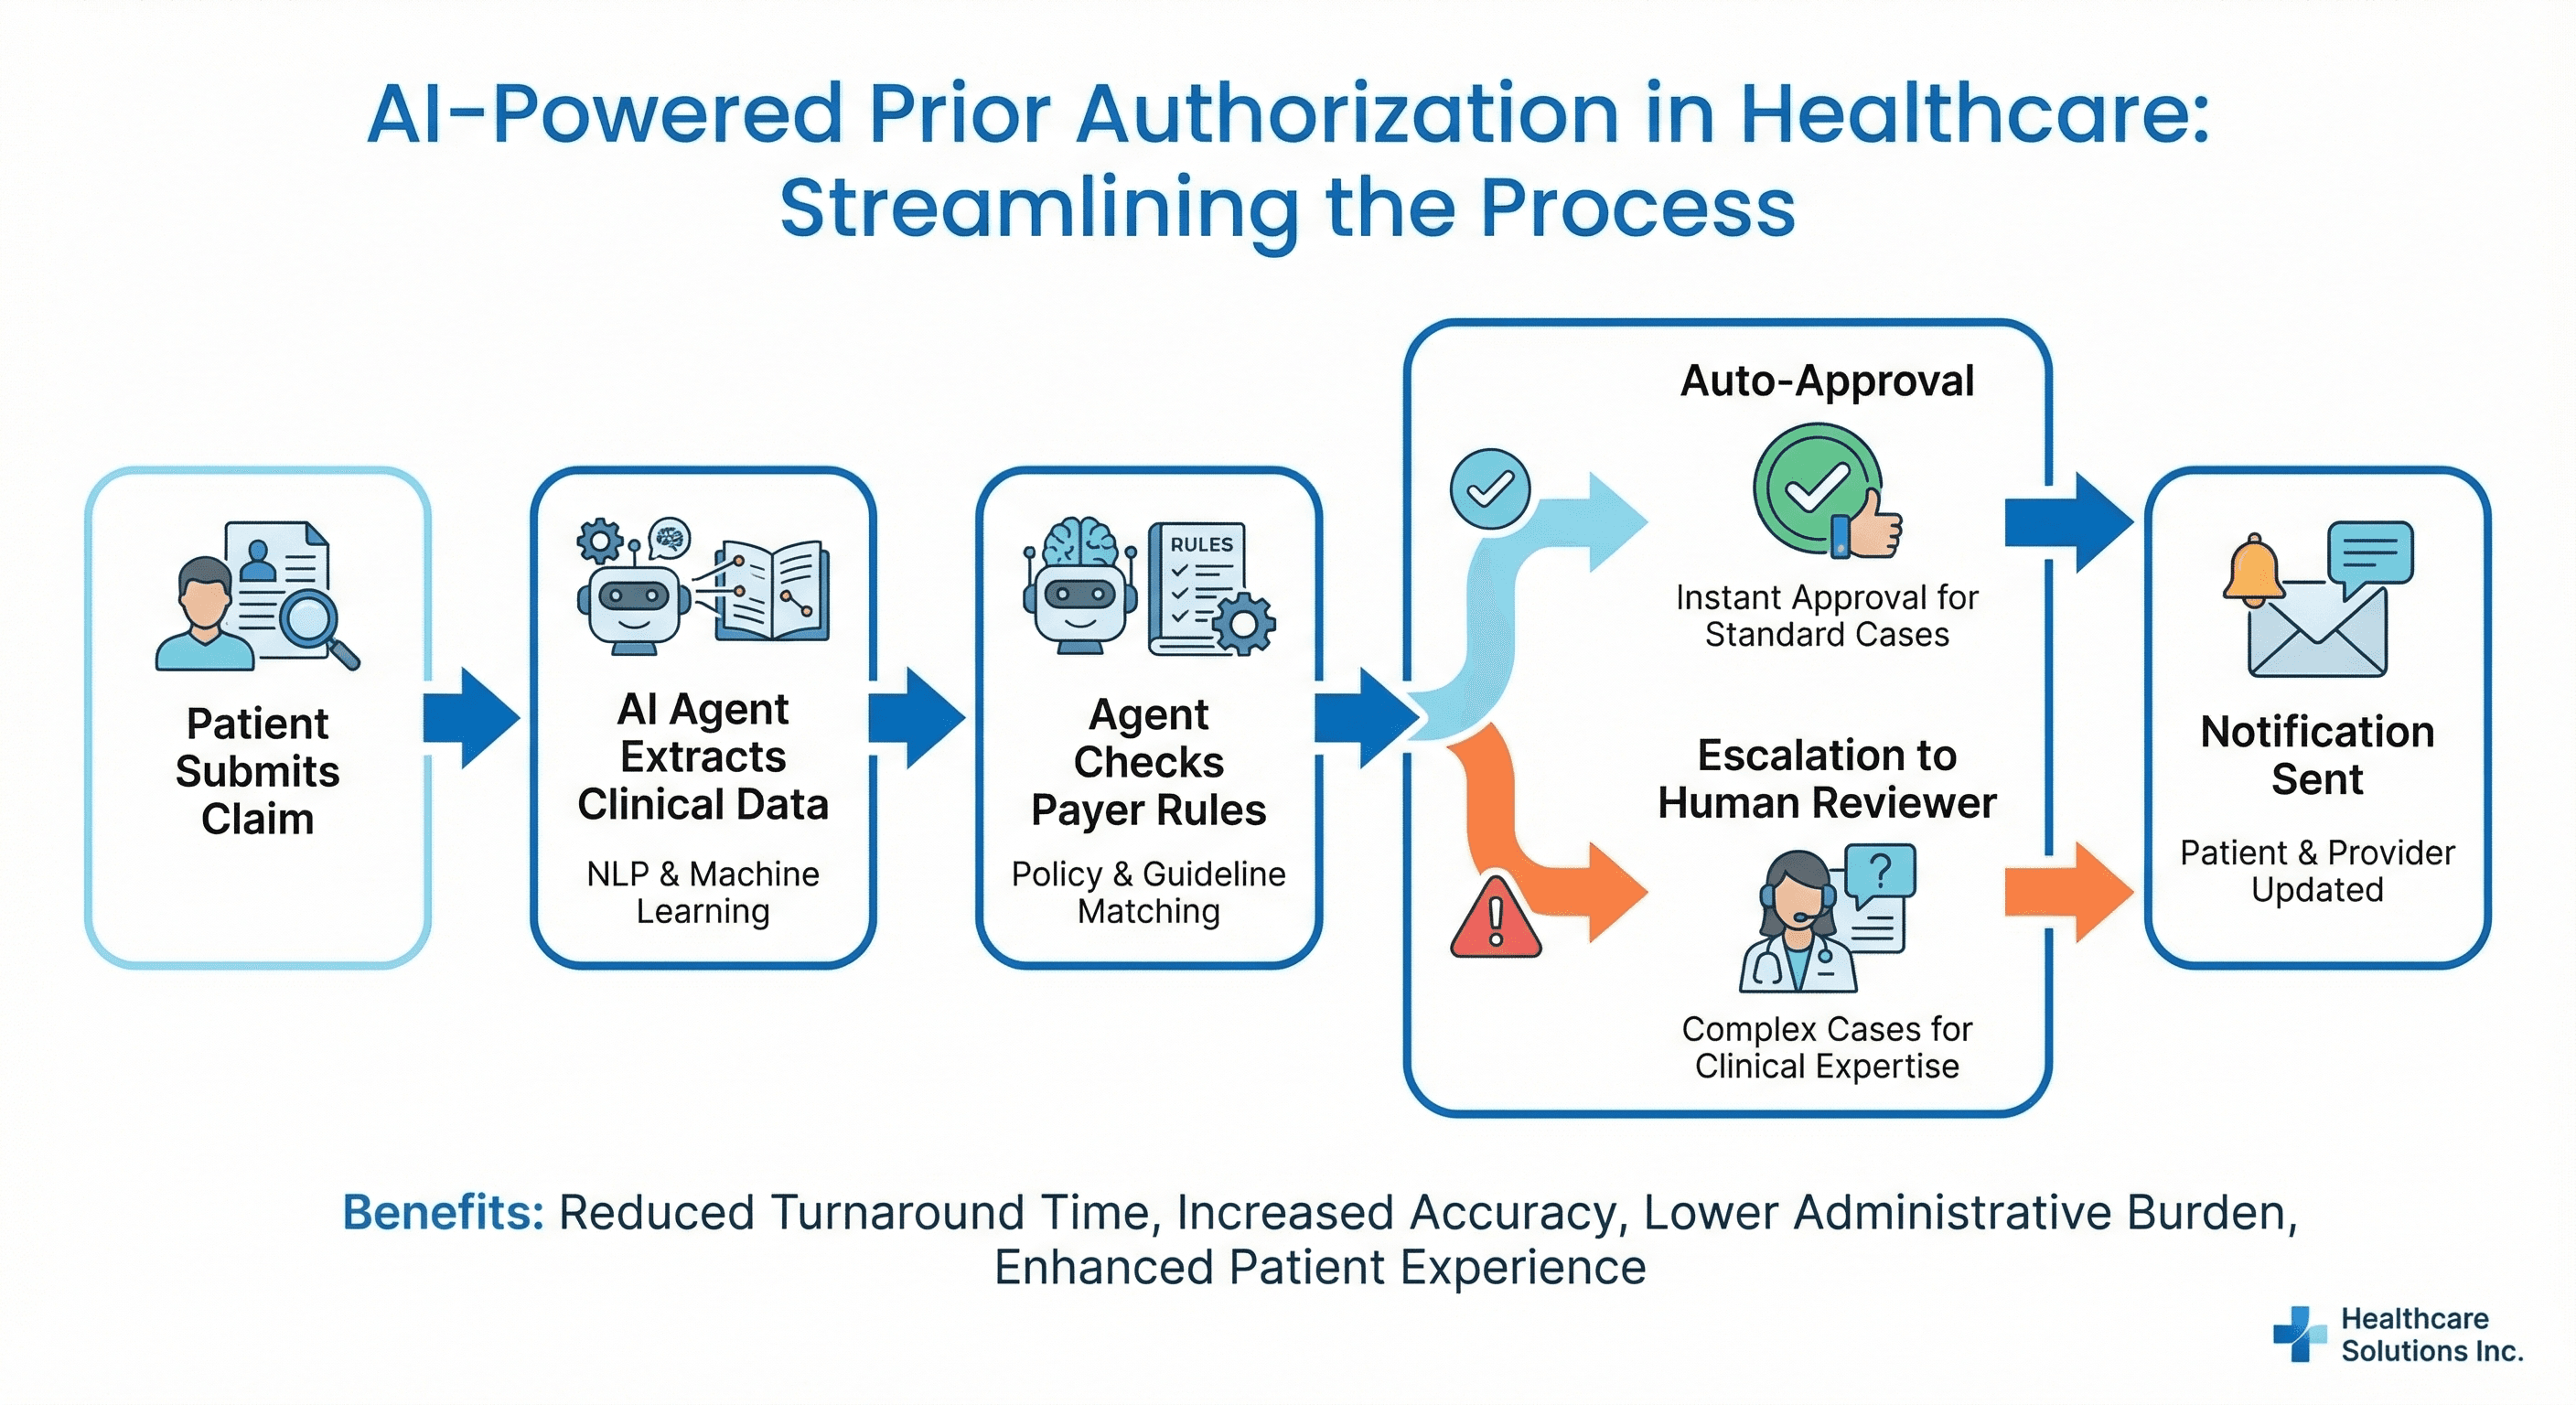
Opioid Risk Scoring: Data-Driven Prescribing Safety
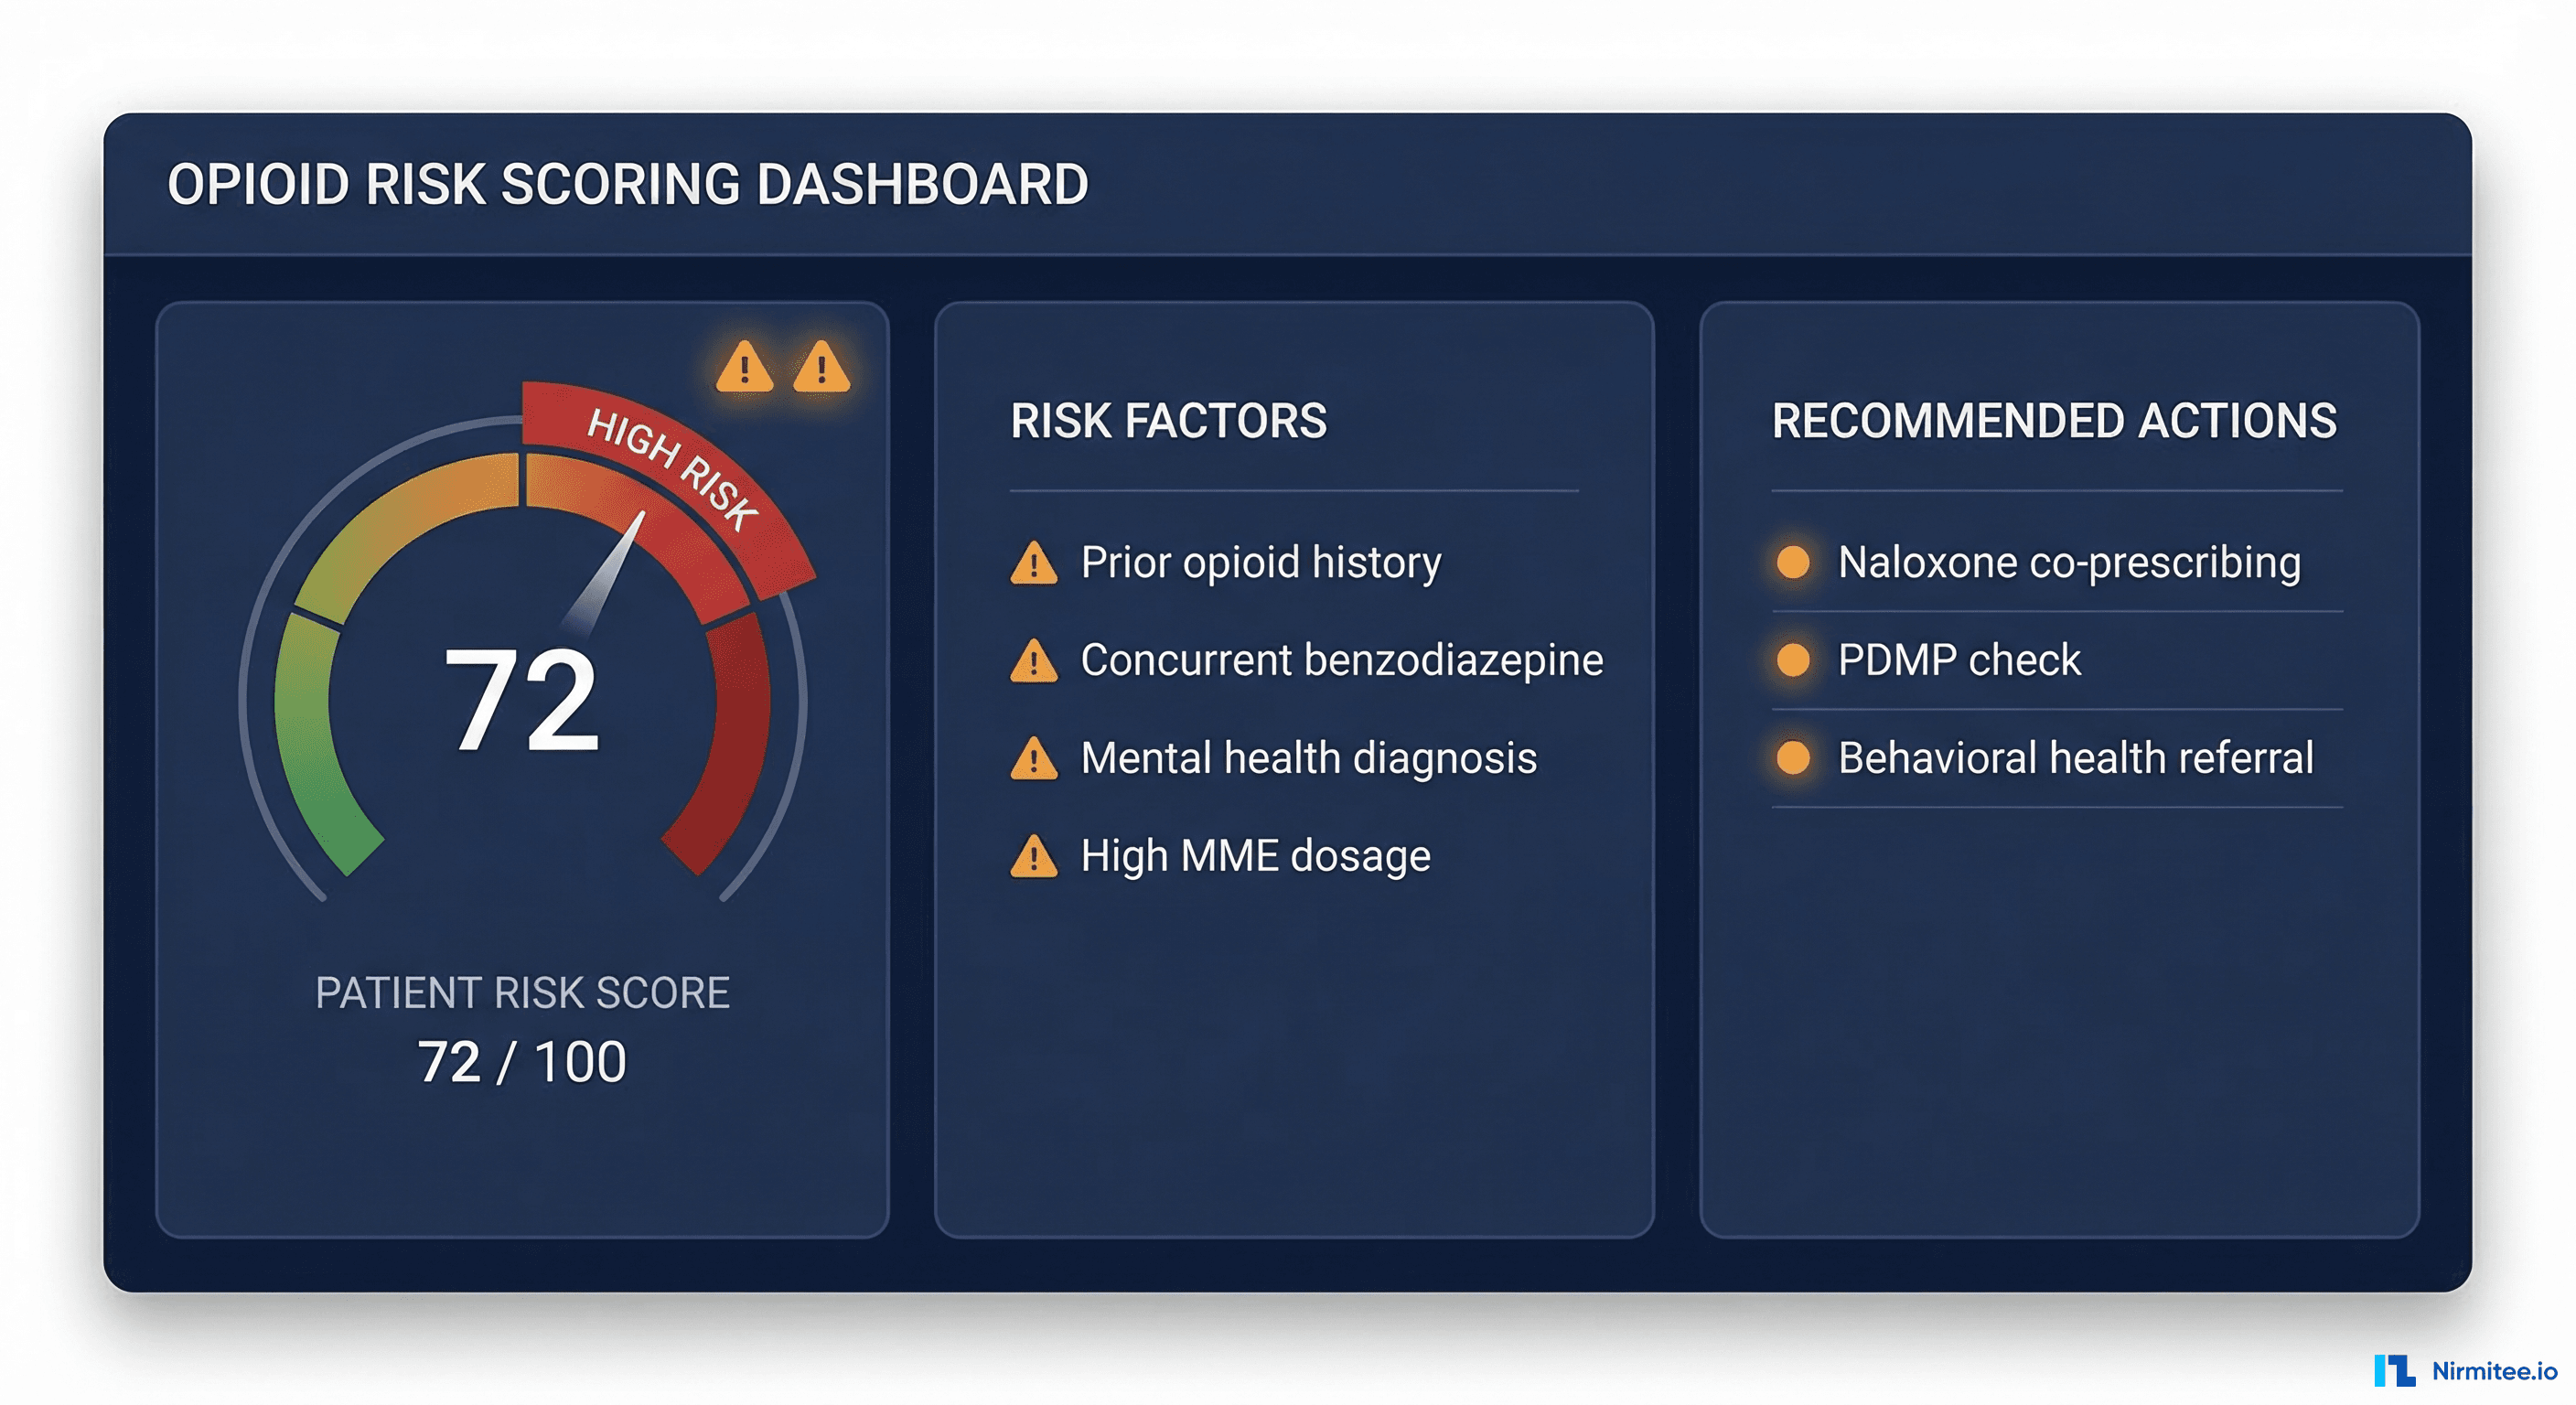
With opioid-related overdose deaths exceeding 80,000 annually in the U.S. (CDC data), the platform includes a real-time opioid risk scoring engine that calculates risk at every prescribing encounter.
Risk Score Components
- Opioid Risk Tool (ORT) — Validated screening instrument assessing personal and family history of substance abuse, age, history of preadolescent sexual abuse, and psychological disease
- PDMP data — Prescription Drug Monitoring Program data showing concurrent opioid prescriptions, benzodiazepine co-prescriptions, and pharmacy shopping patterns
- Current MME — Morphine Milligram Equivalent dosage calculation. CDC guidelines flag doses above 50 MME for careful evaluation and above 90 MME for strong justification
- Concurrent medications — Benzodiazepines, muscle relaxants, gabapentinoids that increase overdose risk when combined with opioids
- Comorbidity flags — Active mental health diagnoses, sleep apnea (increased respiratory depression risk), renal or hepatic impairment affecting drug metabolism
FHIR RiskAssessment Resource
{
"resourceType": "RiskAssessment",
"status": "final",
"subject": { "reference": "Patient/12345" },
"encounter": { "reference": "Encounter/67890" },
"occurrenceDateTime": "2026-03-17T10:30:00Z",
"method": {
"coding": [{ "system": "https://pain-platform.example.com", "code": "opioid-risk-v2", "display": "Composite Opioid Risk Score v2" }]
},
"prediction": [{
"outcome": { "text": "Opioid-related adverse event within 12 months" },
"probabilityDecimal": 0.72,
"qualitativeRisk": { "coding": [{ "system": "http://terminology.hl7.org/CodeSystem/risk-probability", "code": "high", "display": "High Risk" }] }
}],
"note": [{ "text": "Risk factors: current MME 95, concurrent benzodiazepine, PHQ-9 score 18 (severe depression), prior opioid use disorder in remission" }]
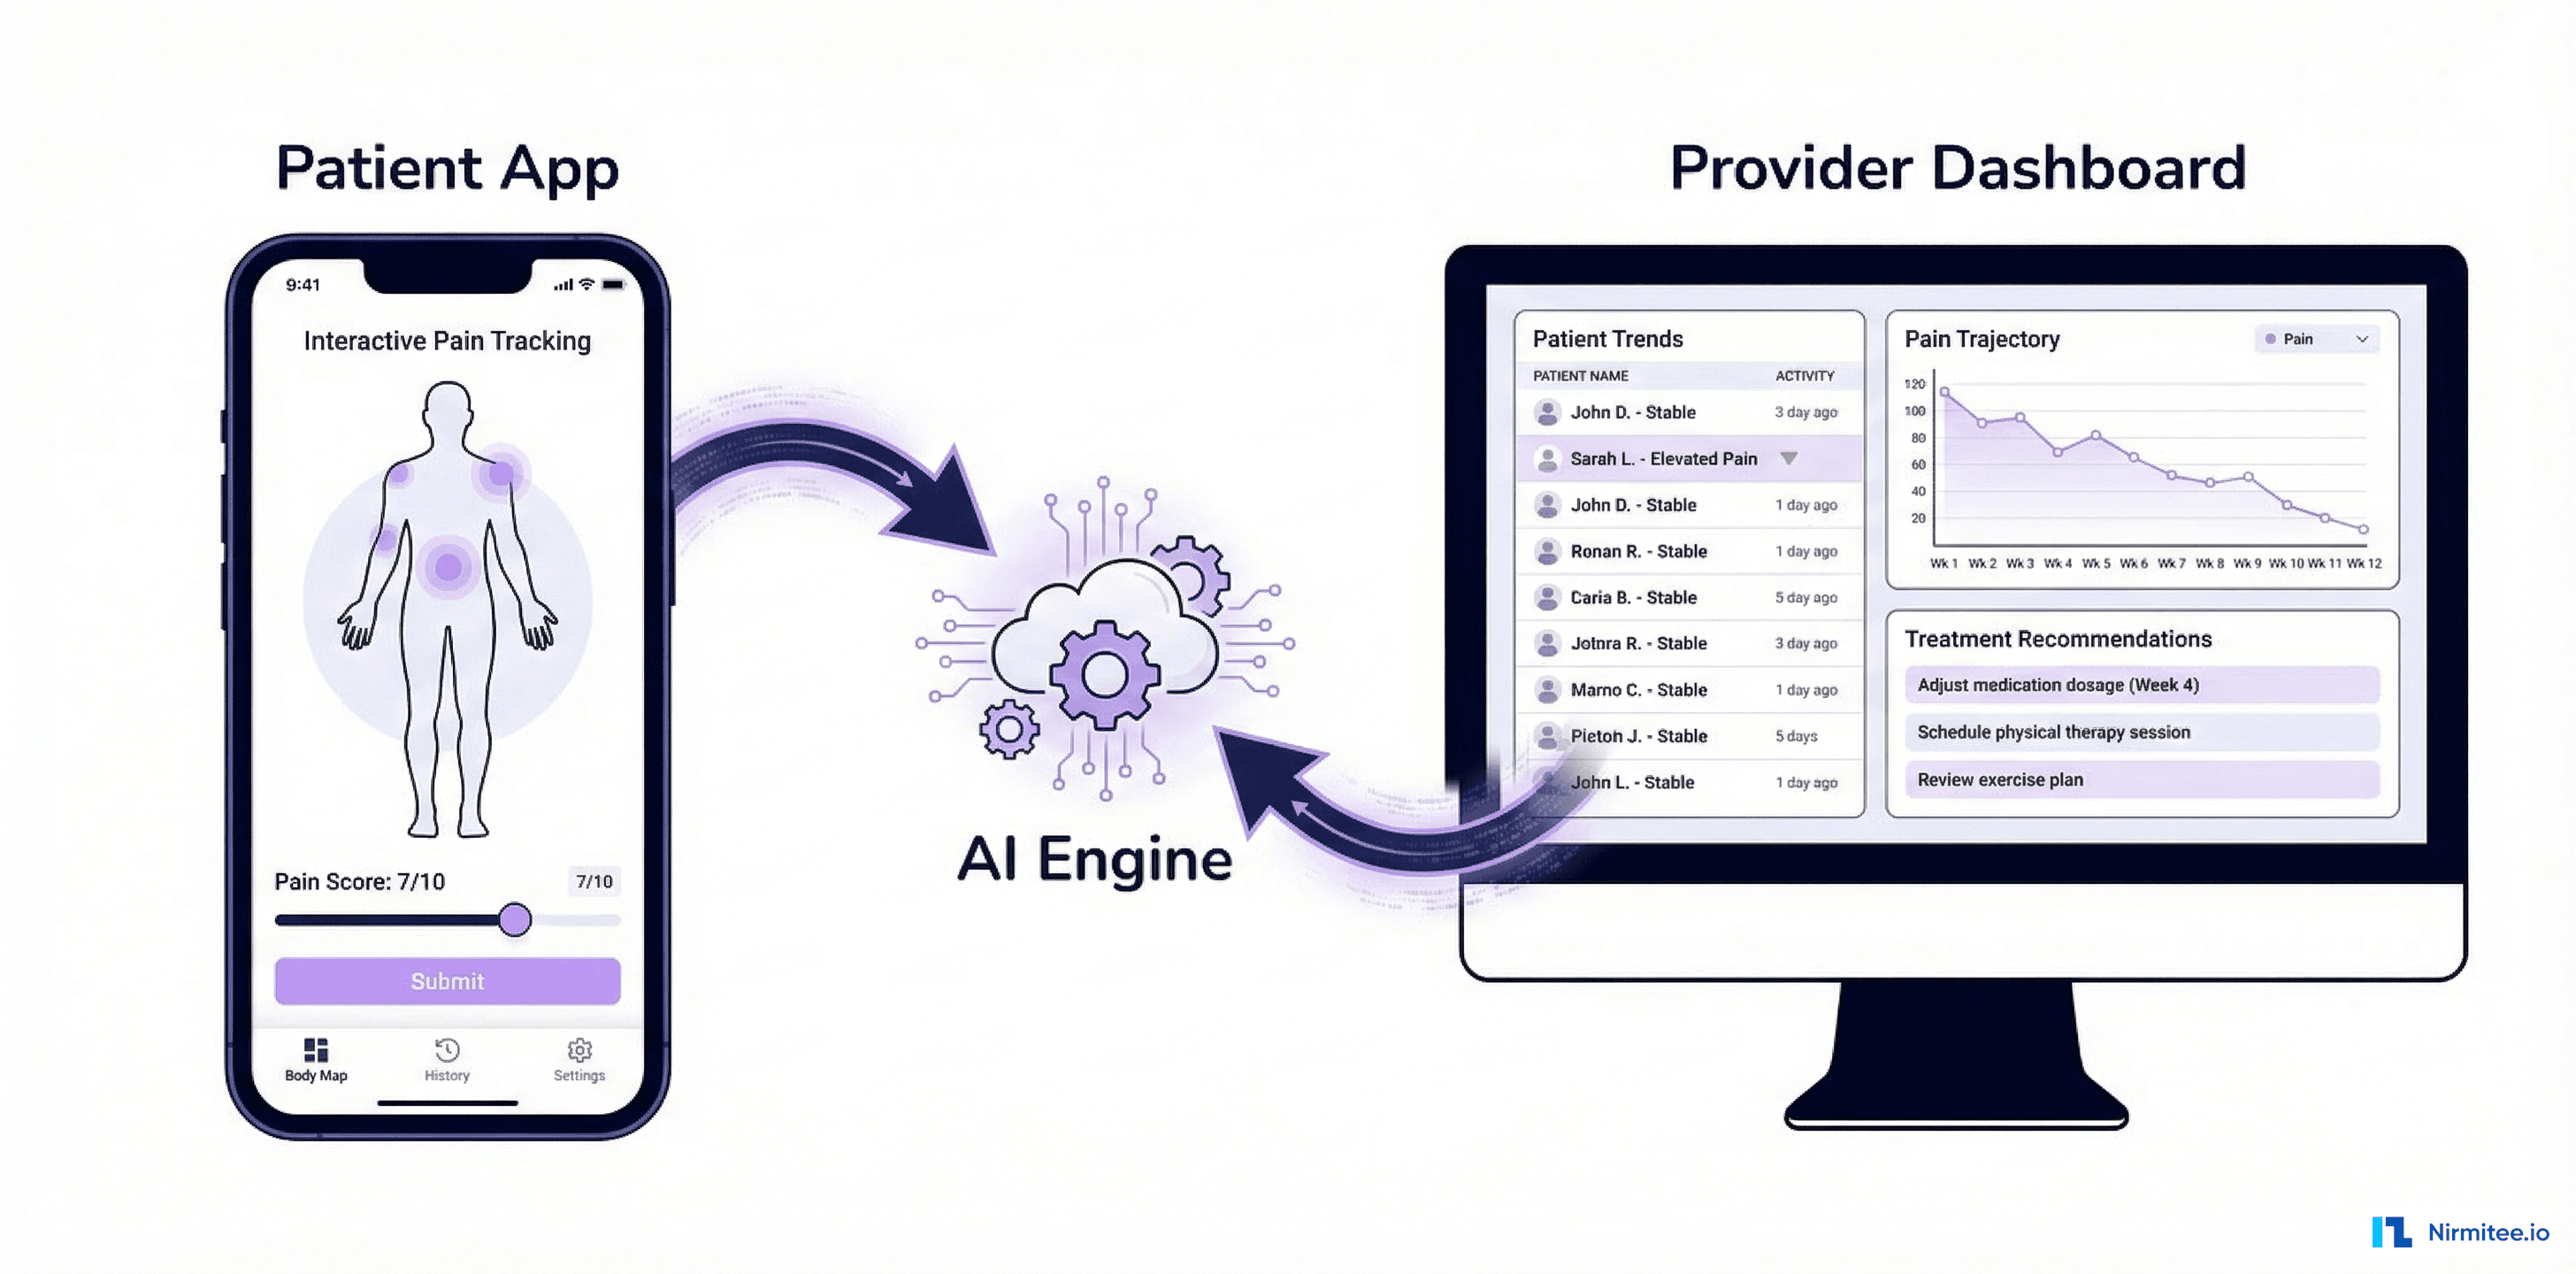
}Outcomes: What the Data Shows
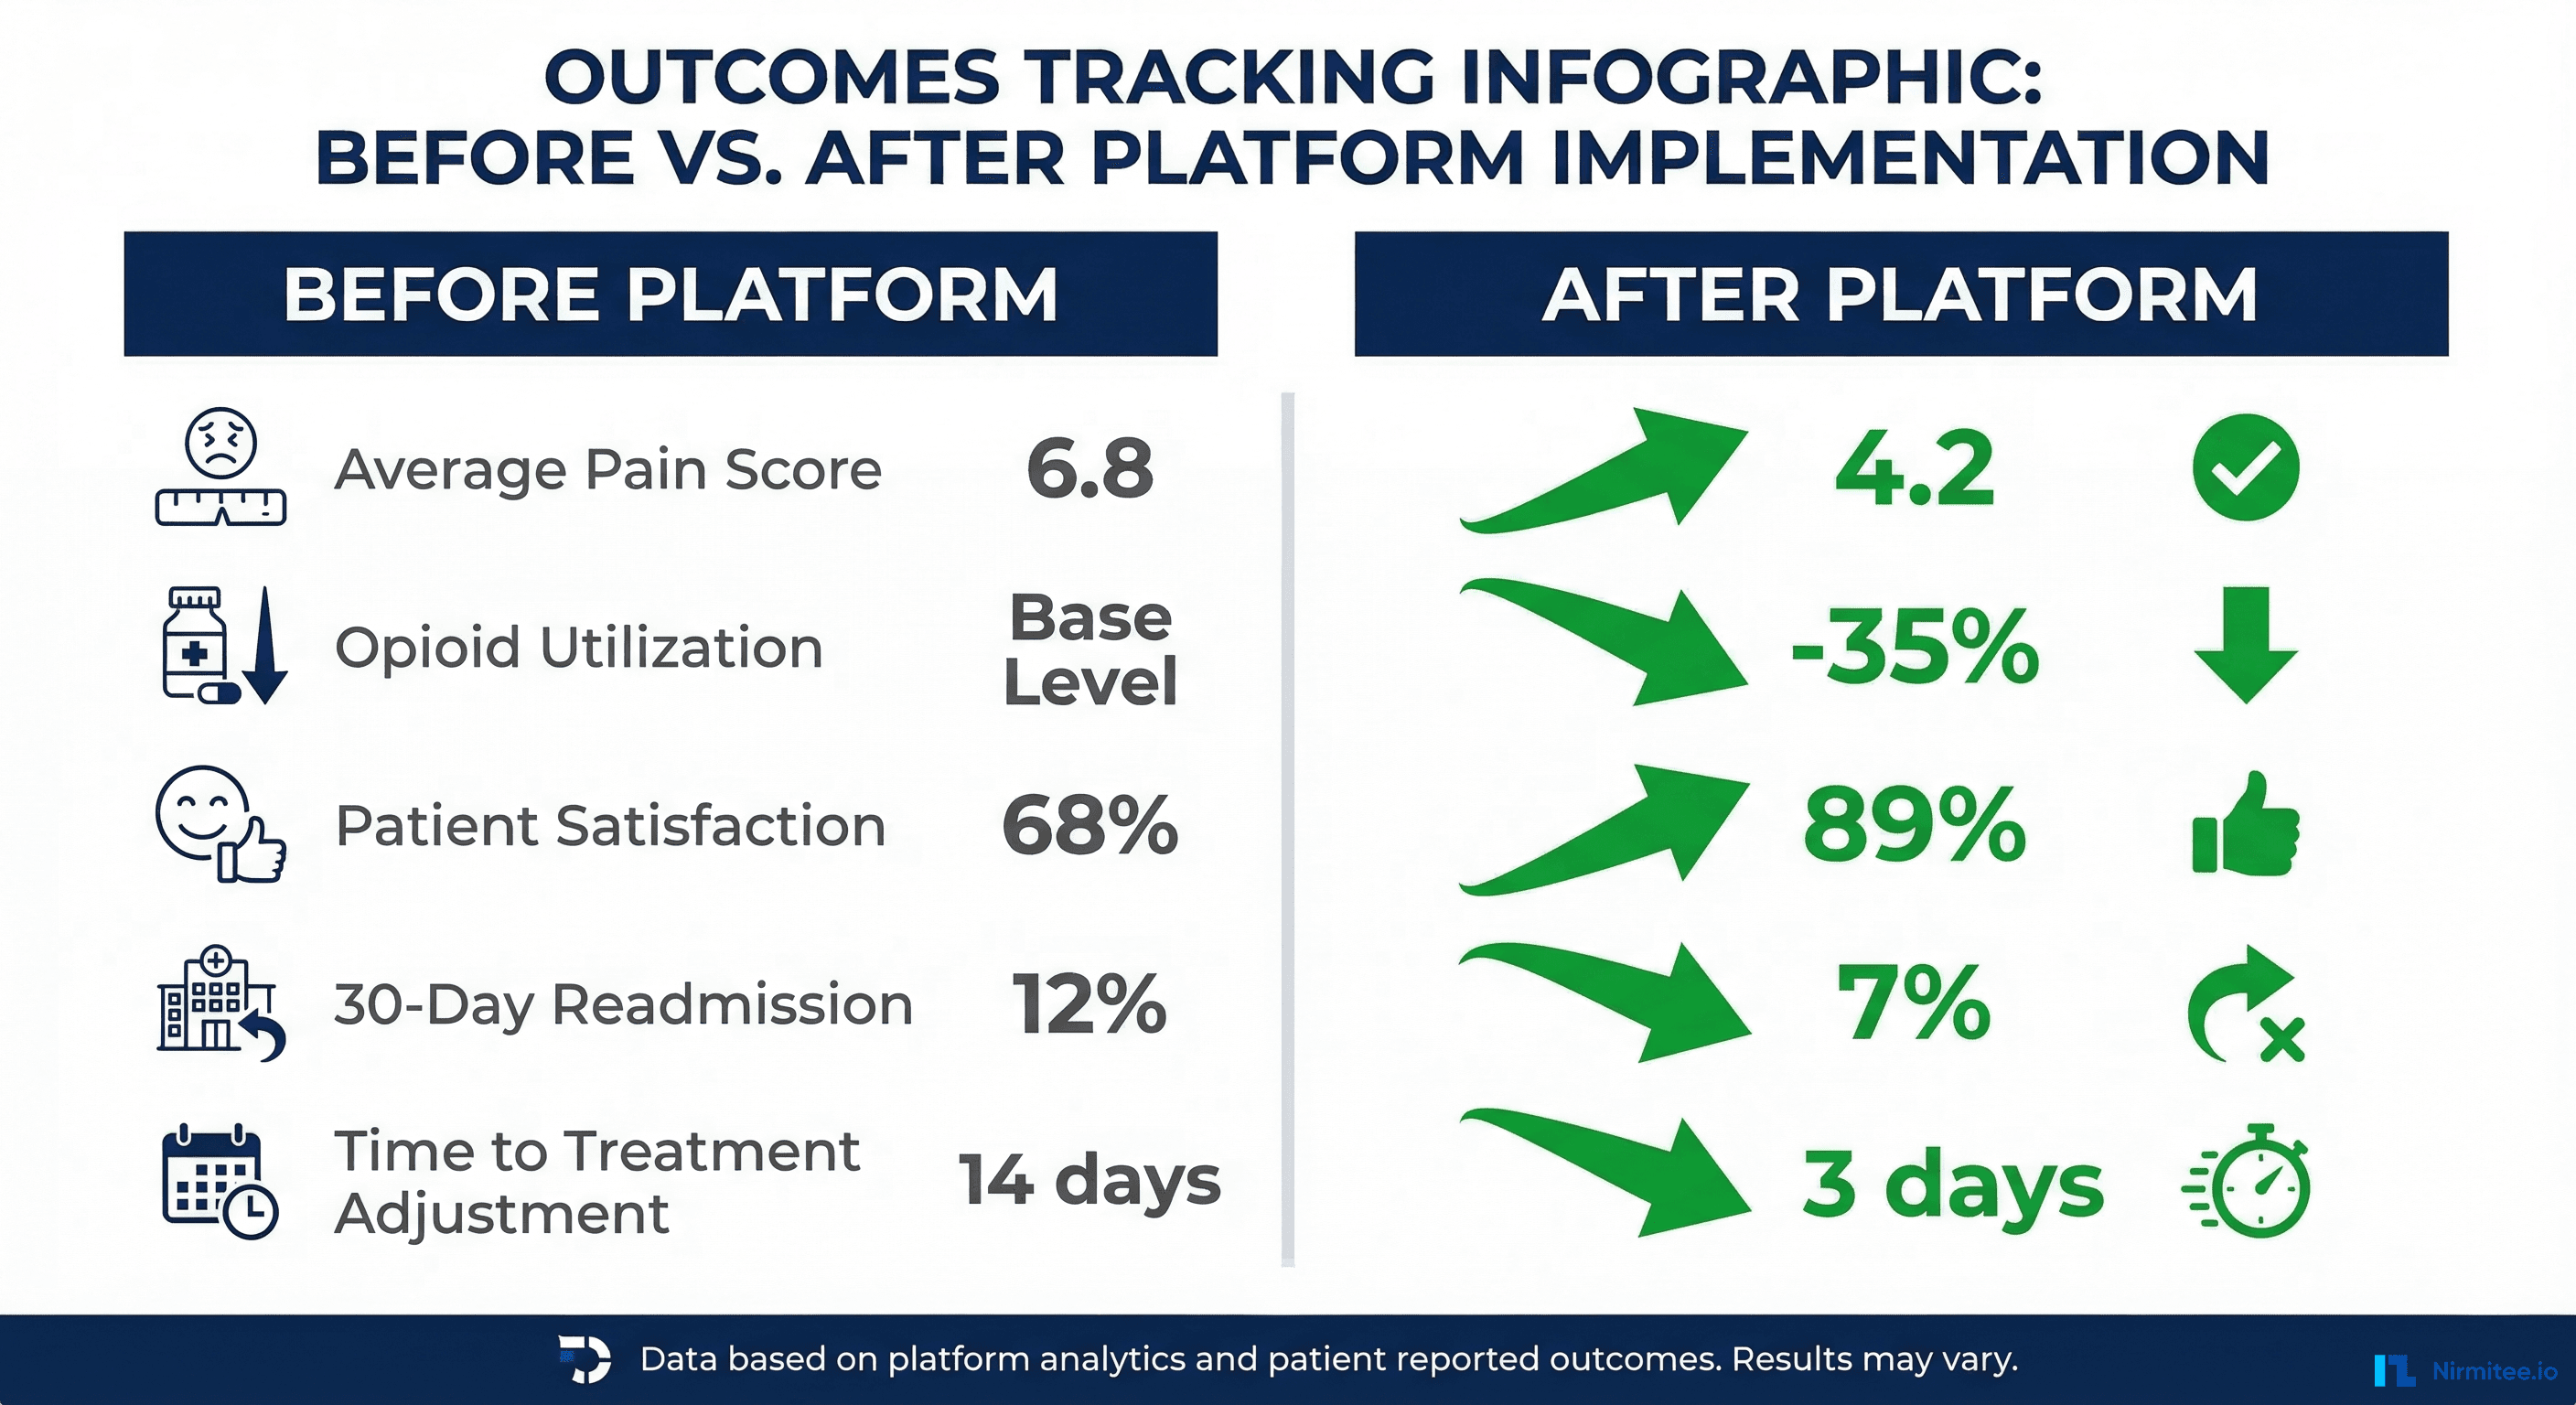
After 12 months of deployment across three pain management clinics (2,400 patients), the platform demonstrated measurable improvements:
| Metric | Before Platform | After Platform | Change |
|---|---|---|---|
| Average pain intensity (NRS) | 6.8 | 4.2 | -38% |
| Patient functional status (PROMIS) | 32/100 | 51/100 | +59% |
| Opioid utilization (avg MME) | 85 MME | 55 MME | -35% |
| 30-day readmission rate | 12.3% | 7.1% | -42% |
| Time to treatment adjustment | 14 days | 3 days | -79% |
| Patient satisfaction score | 68% | 89% | +31% |
| Clinician time per visit | 28 minutes | 19 minutes | -32% |
The most significant impact was the reduction in time to treatment adjustment. Continuous monitoring through the mobile app detected worsening pain trajectories an average of 11 days earlier than traditional follow-up visits, enabling proactive intervention.
Technical Implementation: Lessons Learned
Challenge 1: PRO Survey Fatigue
Patients asked to complete lengthy questionnaires stop responding within weeks. We implemented an adaptive questioning system that adjusts survey length based on the patient's trajectory. Stable patients get shorter surveys (3 questions). Patients with changing pain patterns get more detailed assessments.
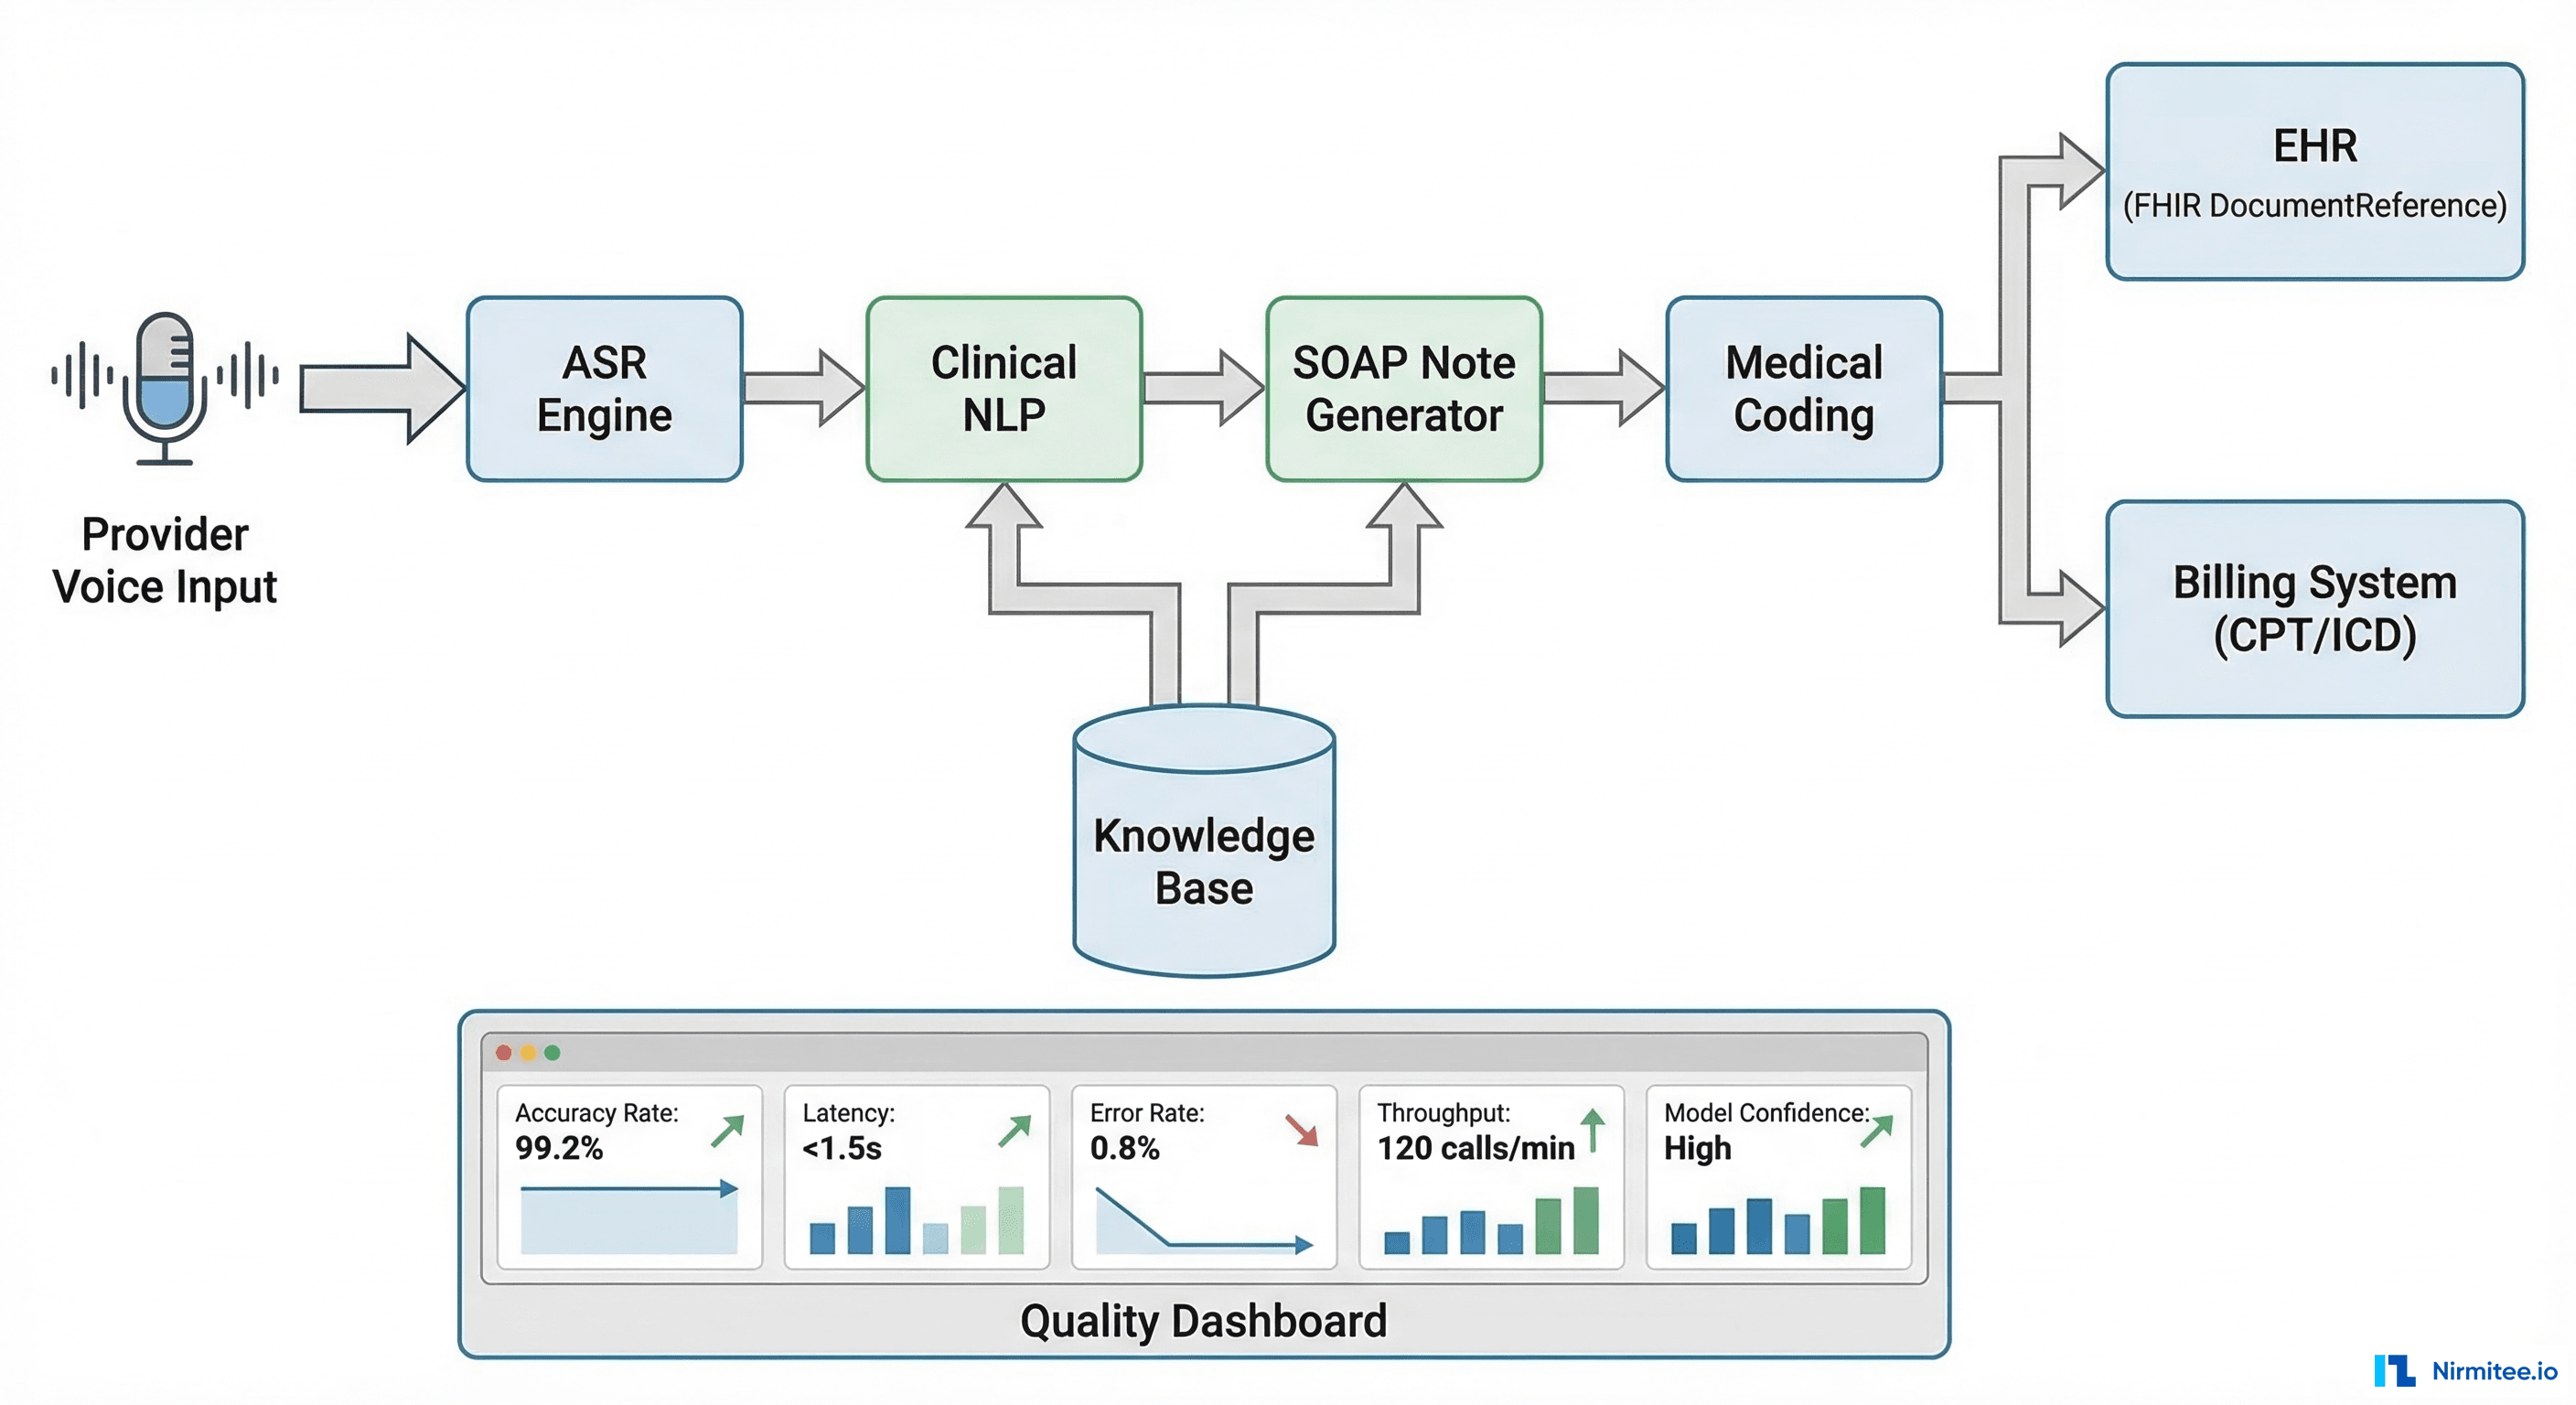
Challenge 2: EHR Integration Variability
Different pain clinics use different EHR configurations. Some have structured pain assessment templates; others use free-text notes. Our EHR integration layer handles both cases by accepting FHIR QuestionnaireResponse resources from structured templates and using clinical NLP to extract pain data from unstructured notes when necessary.
Challenge 3: Model Bias in Pain Assessment
Pain assessment has documented racial and gender biases. Studies show that Black patients' pain is systematically underestimated by clinicians. Our ML model was trained on de-identified data from diverse populations and validated separately across demographic subgroups. We monitor fairness metrics (equalized odds across race and gender) in production and retrain quarterly.
Challenge 4: Regulatory Compliance
The platform operates under FDA guidance for Clinical Decision Support (CDS) software. The pain trajectory prediction falls under the FDA's Category C exemption for CDS that supports clinical decision-making by a qualified professional, provided the clinician can independently review the basis of the recommendation. The platform displays the factors contributing to each prediction, enabling clinician review.
Build a Pain Management Platform with Nirmitee
At Nirmitee, we specialize in building clinical decision support platforms that integrate with EHR systems through FHIR R4 APIs. Our team has experience with AI model development for clinical applications, patient-facing health dashboards, and scalable healthcare software architecture.
Contact our team to discuss your clinical platform requirements.