If you're reading this at 2 a.m. with a screen full of java.lang.OutOfMemoryError: Java heap space, skip the introduction. Jump to the JVM Tuning Cheat Sheet, paste the right mcserver.vmoptions block, restart, and we'll meet you back here for the root-cause fix once your dashboards turn green.
For everyone else: this guide is the playbook our Mirth Connect engineers use when a hospital's interface engine starts bleeding messages because the JVM has run out of room. We've used it on Epic, Cerner, and ADT/SIU integrations carrying 8–12 million HL7 messages a day. It works at small clinics with 4 GB of RAM and at health systems running 32 GB Mirth nodes behind load balancers.
By the end, you'll have a triage flowchart, ready-to-paste JVM configuration blocks for every workload size, a decision tree mapping symptoms to root causes, and a clear sense of when to fix it yourself versus when to call a specialist.
Quick Triage: Is This a True Memory Leak or Just Heap Pressure?
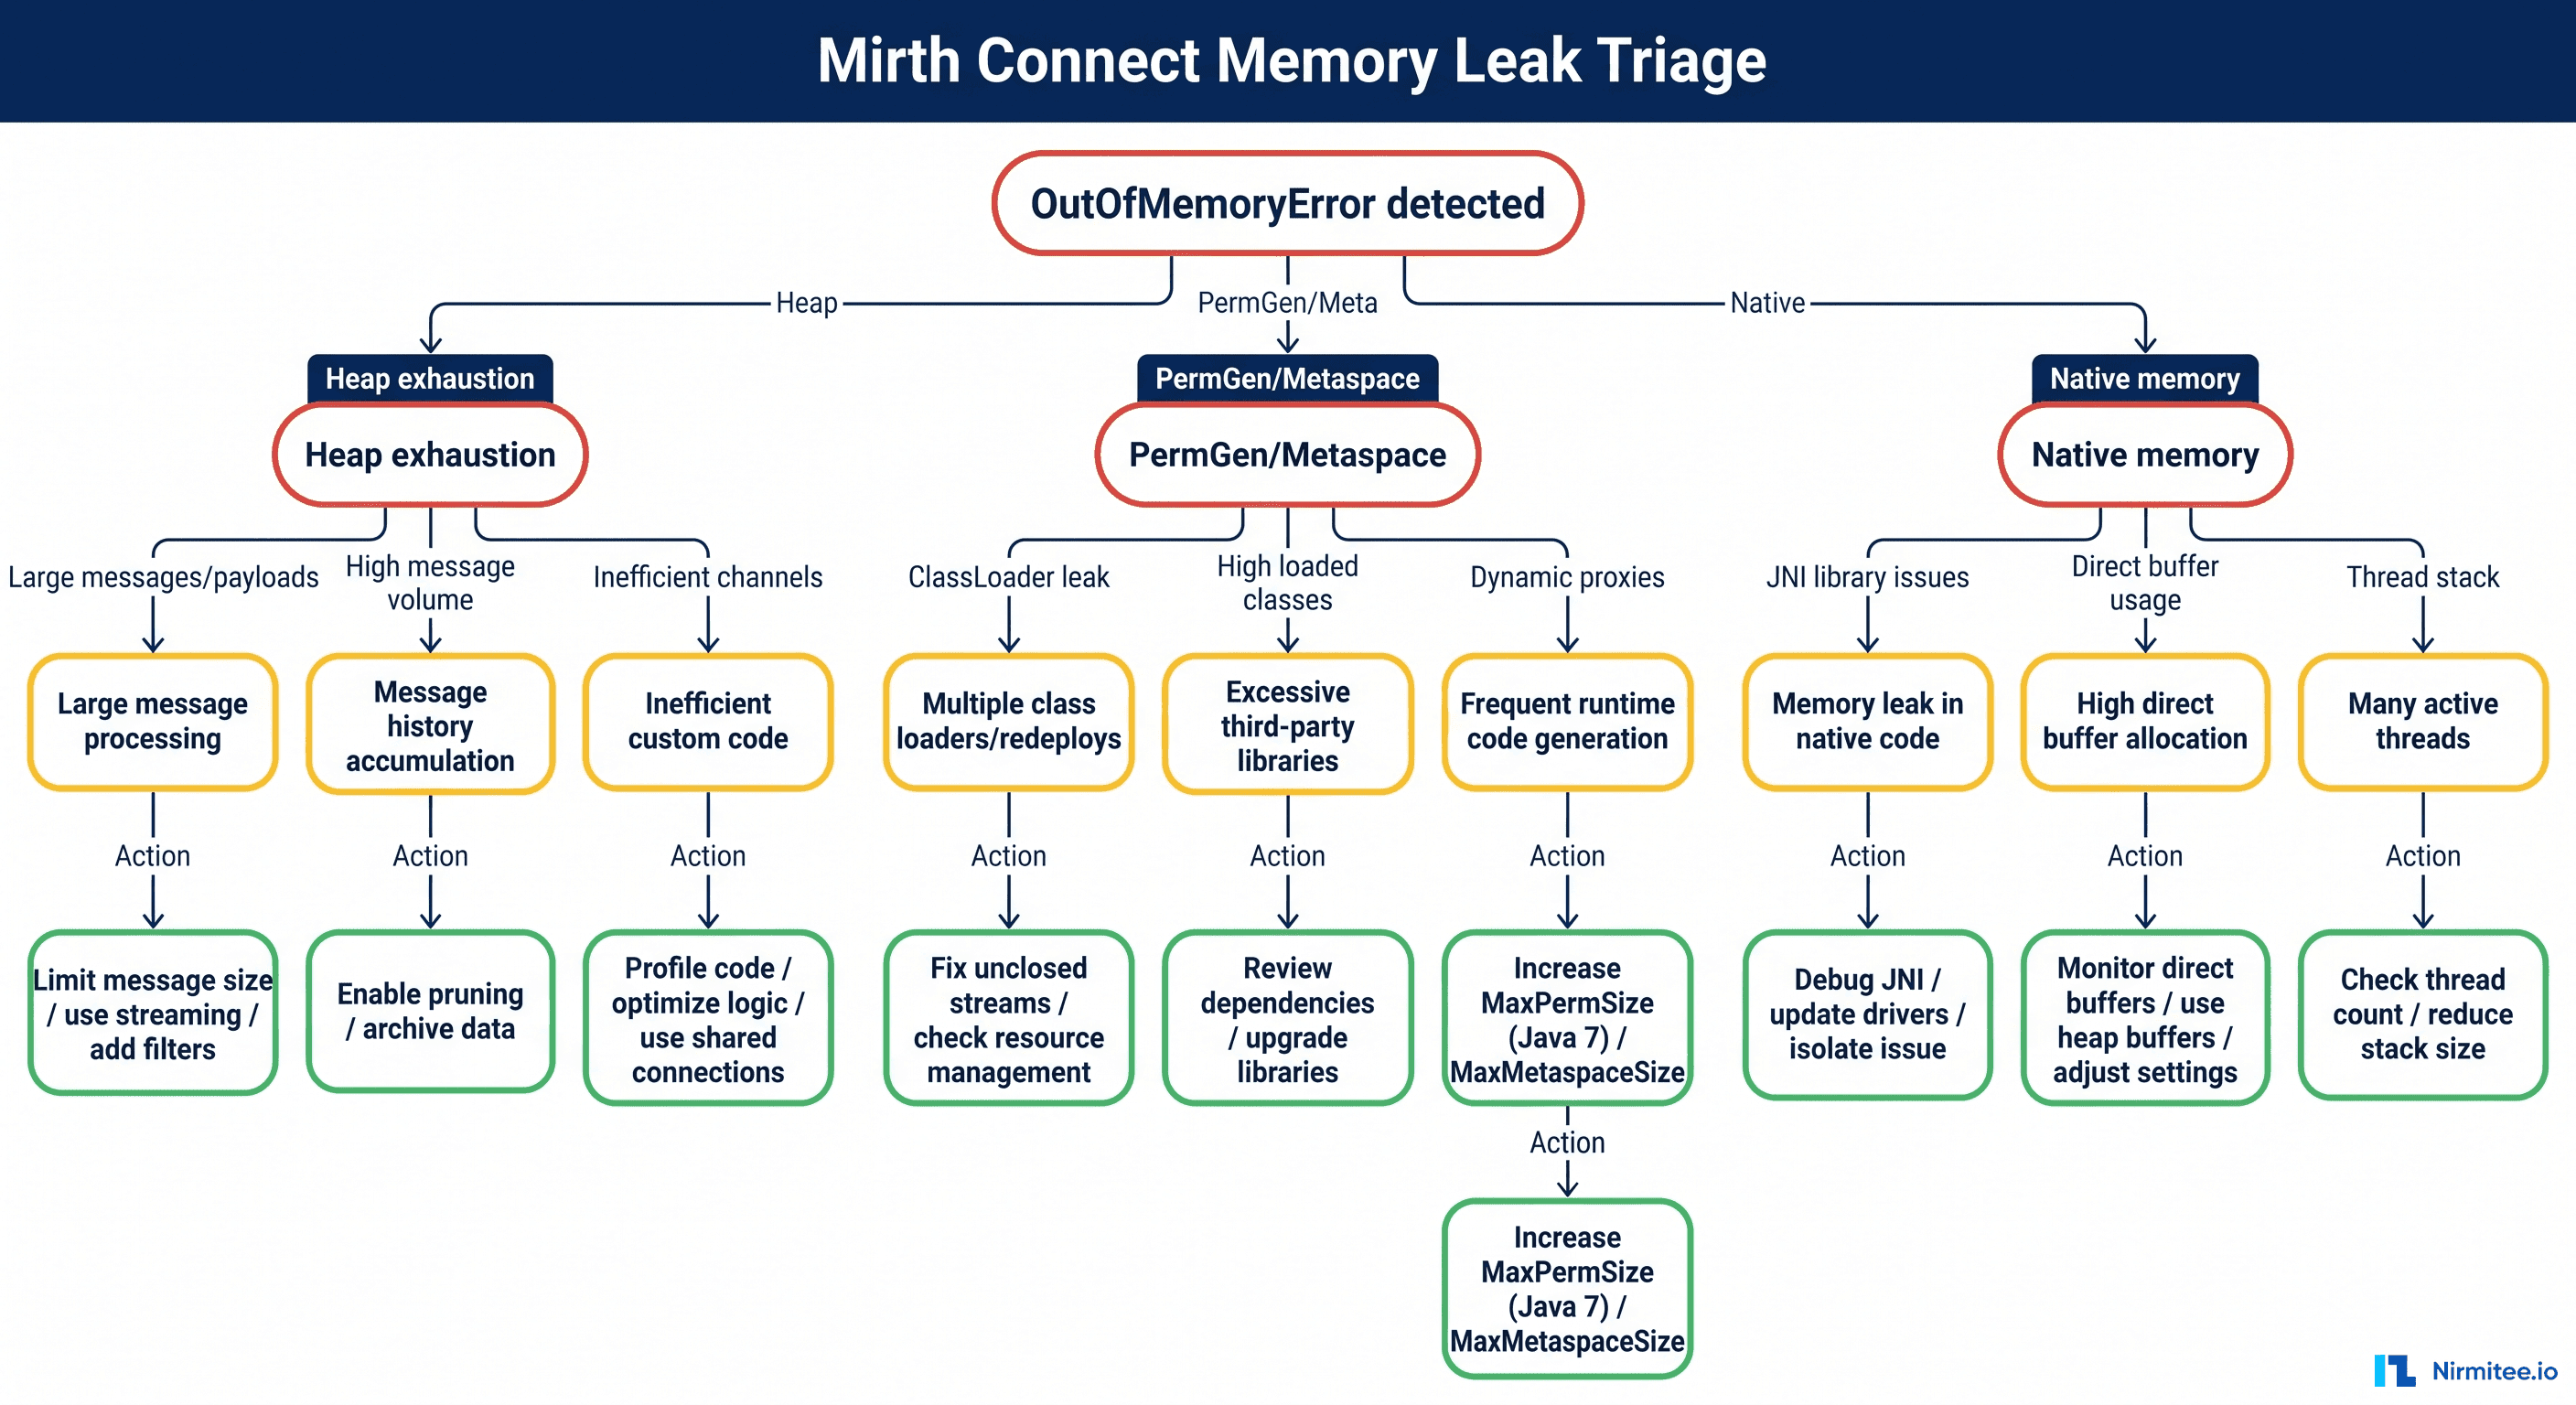
In production Mirth Connect, what teams call "a memory leak" is usually one of four things:
- A real Java memory leak — references being held forever, classic GC roots problem.
- Heap pressure — the heap is correctly sized for normal load, but a burst (large CCDA documents, a backlog of HL7 v2 messages, attachment retention) overwhelms it.
- Undersized heap — the engine has never had enough memory for its workload, and you've been one bad day away from this outage for months.
- Native or thread leak — heap is fine, but the JVM cannot allocate native threads or off-heap memory.
The error message gives you the first clue:
| Error | Most Common Cause |
|---|---|
java.lang.OutOfMemoryError: Java heap space | Heap is exhausted — leak, large objects, or undersized -Xmx |
java.lang.OutOfMemoryError: GC overhead limit exceeded | The JVM is spending >98% of CPU on garbage collection and reclaiming <2% of heap — usually a real leak or severe undersizing |
java.lang.OutOfMemoryError: Unable to create new native thread | OS thread limit hit, often due to channel queue threads or HTTP connector threads not being recycled |
java.lang.OutOfMemoryError: Metaspace | Class metadata growing without bound — common after many channel deploys/redeploys without restart |
java.lang.OutOfMemoryError: Direct buffer memory | Off-heap NIO buffers exhausted — usually large file or HTTP attachment handling |
The triage flowchart below is what we walk teams through on the first call.
The 2 a.m. Stabilization Playbook (10 Minutes to Green)
Before we dive into root causes, here's how to get a bleeding engine breathing again. Do these in order. Do not skip the heap dump — without it you will lose your only chance at root cause.
1. Take a heap dump before restarting
# Find the Mirth PID
ps -ef | grep mcserver | grep -v grep

# Capture a heap dump (this freezes the JVM briefly, but you need this evidence)
jmap -dump:live,format=b,file=/tmp/mirth-heap-$(date +%Y%m%d-%H%M%S).hprof <PID>
2. Capture GC and memory state
jstat -gcutil <PID> 1000 30 > /tmp/mirth-jstat-$(date +%Y%m%d-%H%M%S).txt
jmap -histo:live <PID> | head -50 > /tmp/mirth-histo-$(date +%Y%m%d-%H%M%S).txt
3. Pause the noisy source channels
In the Mirth Administrator, stop the channels with the deepest queues (you'll find them under Dashboard → Channels sorted by Queued). This prevents the engine from being re-flooded the moment it comes back up.
4. Restart Mirth with a temporarily larger heap
Edit mcserver.vmoptions and bump -Xmx by 50% (e.g., 8g → 12g). This buys you time, it does not fix the leak.
5. Resume channels gradually
Start the lowest-throughput channels first. Watch heap and GC for 5 minutes per channel. If heap usage stabilizes in the 40–70% band with regular GC cycles, you're stable.
6. Schedule the real fix for the next change window
A bigger heap masks the leak; it does not cure it.
If you can't get past step 4 — heap fills up again within minutes — you are almost certainly looking at a real leak in a specific channel or transformer, or a runaway attachment problem. That's a phone call, not a config change. Talk to a Mirth engineer, and we'll get on a screen-share within 15 minutes.
The Five Root Causes of Mirth Memory Pressure
After the immediate fire is out, the real question is: what's eating the heap? In our incident data across 80+ Mirth deployments, the same five culprits show up over and over.
1. Attachments Retained After Message Completion (the #1 killer)
Mirth Connect supports attachments — usually base64-encoded PDFs, CCDA documents, or images extracted from HL7 OBX-5 segments. By default, attachments persist on the message itself and remain in memory as part of the connector message until garbage collected. When you process thousands of messages per hour with multi-megabyte attachments, the heap fills up faster than the JVM can reclaim it.
The fix: ensure Remove attachments on completion is enabled in the channel summary tab, and set Store attachments to "Off" if you don't need them after processing. For high-volume channels handling HL7 MDM^T02 with embedded PDFs, also consider storing attachments externally (S3, Azure Blob) and keeping only references in the message store.
In the channel destination, after the attachment has been written or forwarded, explicitly null the reference:
// At the end of the destination transformer
msg['attachmentData'] = null;
attachment = null;
This sounds trivial but it matters: JavaScript scopes in Mirth's Rhino engine can retain references longer than you expect.
2. Channel Queue Backlog Holding Messages in Memory
When a destination connector is slow (a downstream Epic interface is sluggish, a TCP partner is offline, an API is rate-limited), Mirth's destination queue grows. If you have Queue enabled with Reattempt and a high Retry count, queued messages sit in memory and on disk. With large messages and a long queue, this alone can exhaust the heap.
Diagnostic:
-- Run against the Mirth database
SELECT channel_id, COUNT(*) AS queued_messages
FROM d_mm
WHERE status = 'QUEUED'
GROUP BY channel_id
ORDER BY queued_messages DESC;
If any channel shows tens of thousands of queued messages, that's your heap pressure.
The fix:
- Lower the destination queue's "Buffer size" advanced setting (default is 1000; for big messages, drop to 100).
- Set a sensible "Retry count" with backoff — infinite retry on a permanently broken endpoint is how heap goes from 60% to 100% over a weekend.
- For chronic slow destinations, externalize the queue to a real message broker. See our guide on healthcare integration architecture with Mirth and Kafka for the pattern.
3. JavaScript Transformer Scope Leaks
Mirth's transformer engine is Rhino JavaScript with a persistent global scope across messages on the same channel. Variables declared at the top level of a transformer without var, let, or const leak into the global scope and are never collected.
Anti-pattern (leaks):
// No declaration - this becomes a property on the global object,
// retained for the lifetime of the channel
patientMap = {};
patientMap[msg['PID']['PID.3']['PID.3.1'].toString()] = msg['PID']['PID.5'].toString();
After 10 million messages, patientMap has 10 million entries. The channel will leak at a predictable rate per message.
Correct pattern:
// Properly scoped - collected at the end of the transformer
var patientId = msg['PID']['PID.3']['PID.3.1'].toString();
var patientName = msg['PID']['PID.5'].toString();
// Use channelMap if you need cross-step access within a single message
channelMap.put('patientId', patientId);
If you need cross-message state (rate limiting counters, deduplication windows), use Mirth's deploy scripts to initialize bounded structures and the globalMap carefully with a clear eviction policy.
4. Undersized Heap for Actual Workload
The Mirth installer's default -Xmx256m is laughable for any production deployment. We've seen hospitals running Mirth on the defaults for years, with a heap that barely fits a single CCDA. The first sign of growth, and the engine falls over.
There's no universal "right" heap size, but these rules of thumb hold in 90% of cases:
- Less than 100 msgs/sec, small HL7 v2 messages: 4 GB heap is usually plenty.
- 100–500 msgs/sec, mixed HL7 v2 and CCDA: 8 GB heap, G1GC.
- 500–2,000 msgs/sec or heavy FHIR bundles: 16 GB heap, G1GC with pause-time targets.
- More than 2,000 msgs/sec, large attachments, multi-tenant: 32 GB heap, G1GC or ZGC on Java 17+.
The configuration table below is what we paste into mcserver.vmoptions as a starting point. Always validate with a 24-hour load test before going live.
5. Missing Message Pruning
Mirth stores every processed message in the database by default. The D_MM* tables (one per channel) grow without bound unless you configure pruning. Even if pruning is configured, large BLOB columns for content and attachments can balloon to terabytes, and the engine's message search and dashboard summary queries start consuming memory.
The fix:
- For every channel, set Message Pruning under "Set Pruning..." with sensible retention (e.g., metadata 30 days, content 7 days, errors 90 days).
- Schedule the pruner to run during low-traffic windows.
- For long-term clinical retention requirements, archive to cold storage rather than retaining everything in the operational store.
JVM Tuning Cheat Sheet: Ready-to-Paste mcserver.vmoptions
These are real configurations we deploy. The file lives in your Mirth Connect installation directory next to mcserver (Linux) or mcservice.vmoptions (Windows service). After editing, restart Mirth. Always keep a backup of the previous file.
4 GB Workload (small clinic / single-channel ADT)
# mcserver.vmoptions - 4 GB tier
-server
-Xms3g
-Xmx3g
-XX:+UseG1GC
-XX:MaxGCPauseMillis=200
-XX:G1HeapRegionSize=8m
-XX:InitiatingHeapOccupancyPercent=45
-XX:+ParallelRefProcEnabled
-XX:+AlwaysPreTouch
-XX:+HeapDumpOnOutOfMemoryError
-XX:HeapDumpPath=/var/log/mirth/heapdumps
-XX:ErrorFile=/var/log/mirth/hs_err_pid%p.log
-Xlog:gc*:file=/var/log/mirth/gc.log:time,uptime,level,tags:filecount=10,filesize=20M
-Djava.awt.headless=true
8 GB Workload (mid-size hospital, mixed HL7 v2 + CCDA)
# mcserver.vmoptions - 8 GB tier
-server
-Xms6g
-Xmx6g
-XX:+UseG1GC
-XX:MaxGCPauseMillis=200
-XX:G1HeapRegionSize=16m
-XX:InitiatingHeapOccupancyPercent=40
-XX:+ParallelRefProcEnabled
-XX:+AlwaysPreTouch
-XX:+UseStringDeduplication
-XX:+HeapDumpOnOutOfMemoryError
-XX:HeapDumpPath=/var/log/mirth/heapdumps
-XX:ErrorFile=/var/log/mirth/hs_err_pid%p.log
-Xlog:gc*:file=/var/log/mirth/gc.log:time,uptime,level,tags:filecount=10,filesize=50M
-Djava.awt.headless=true
-Dfile.encoding=UTF-8
16 GB Workload (regional health system, high-throughput)
# mcserver.vmoptions - 16 GB tier
-server
-Xms12g
-Xmx12g
-XX:+UseG1GC
-XX:MaxGCPauseMillis=150
-XX:G1HeapRegionSize=32m
-XX:InitiatingHeapOccupancyPercent=35
-XX:+ParallelRefProcEnabled
-XX:+AlwaysPreTouch
-XX:+UseStringDeduplication
-XX:ParallelGCThreads=8
-XX:ConcGCThreads=2
-XX:+HeapDumpOnOutOfMemoryError
-XX:HeapDumpPath=/var/log/mirth/heapdumps
-XX:ErrorFile=/var/log/mirth/hs_err_pid%p.log
-Xlog:gc*:file=/var/log/mirth/gc.log:time,uptime,level,tags:filecount=20,filesize=100M
-Djava.awt.headless=true
-Dfile.encoding=UTF-8
-Dmirth.attachment.tempdir=/var/lib/mirth/attachments
32 GB Workload (multi-tenant / large IDN)
# mcserver.vmoptions - 32 GB tier (Java 17+)
-server
-Xms24g
-Xmx24g
-XX:+UseZGC
-XX:+ZGenerational
-XX:+AlwaysPreTouch
-XX:+UseStringDeduplication
-XX:+HeapDumpOnOutOfMemoryError
-XX:HeapDumpPath=/var/log/mirth/heapdumps
-XX:ErrorFile=/var/log/mirth/hs_err_pid%p.log
-Xlog:gc*:file=/var/log/mirth/gc.log:time,uptime,level,tags:filecount=20,filesize=200M
-Djava.awt.headless=true
-Dfile.encoding=UTF-8
-Dmirth.attachment.tempdir=/var/lib/mirth/attachments
Rules of thumb that apply to every tier:
- Set
-Xmsequal to-Xmxso the heap doesn't resize at runtime (resizing is a known source of latency spikes). - Leave at least 25% of physical RAM for the OS, Postgres if co-located, and native off-heap allocations.
- Enable
-XX:+HeapDumpOnOutOfMemoryError. The next OOM should leave you a smoking gun without manual intervention. - Keep GC logs. Without them, performance investigations are guesswork.
Step-by-Step Diagnostic Sequence
When you have a heap dump and time to investigate, this is the sequence we follow. The full process from "I have a hprof file" to "I know which channel is leaking" takes about 30–60 minutes for a typical case.
Step 1: Confirm the GC Pattern with jstat
jstat -gcutil <PID> 1000 60Expected healthy output (heap oscillates, GC reclaims memory):
  S0     S1     E      O      M     CCS    YGC     YGCT    FGC    FGCT     CGC    CGCT     GCT
  0.00  82.31  45.12  62.04  97.21  95.43    142    1.234     2    0.567      8    0.123    1.924
  0.00  91.45  78.34  62.05  97.21  95.43    143    1.245     2    0.567      8    0.123    1.935
 84.12   0.00  12.67  62.06  97.21  95.43    144    1.256     2    0.567      8    0.123    1.946
Unhealthy output (Old gen at 100%, Full GC every few seconds, no memory reclaimed):
  S0     S1     E      O      M     CCS    YGC     YGCT    FGC    FGCT     CGC    CGCT     GCT
  0.00 100.00  98.45  99.87  97.21  95.43   1244   18.234    87   45.567      0    0.000   63.801
  0.00 100.00 100.00  99.92  97.21  95.43   1245   18.412    88   46.789      0    0.000   65.201
When the O (Old Gen) column is pinned at 99–100% and FGC (Full GC count) increments rapidly with zero benefit, you are in a death spiral. The JVM cannot reclaim memory because every object has a live reference somewhere.
Step 2: Histogram the Heap with jmap
jmap -histo:live <PID> | head -30Sample output from a leaking channel:
 num     #instances         #bytes  class name
----------------------------------------------
   1:       12482104     3201498624  [B (byte arrays)
   2:        8421501      808464096  java.lang.String
   3:        4502342      432224832  com.mirth.connect.donkey.model.message.ConnectorMessage
   4:        2891744      231339520  com.mirth.connect.donkey.model.message.Message
   5:        1843121      147449680  org.mozilla.javascript.NativeObject
That NativeObject count is the Rhino JavaScript scope retaining references — classic transformer leak.
Step 3: Open the Heap Dump in Eclipse MAT
Eclipse Memory Analyzer Tool (free) is the gold standard for .hprof analysis. Load the dump, run the Leak Suspects Report, and look at the Dominator Tree. The top three dominators almost always tell you the story — a specific channel, a specific transformer, a runaway map.
Step 4: Correlate to a Channel
Once MAT shows you something like com.mirth.connect.connectors.http.HttpDispatcher holding 4 GB through a queue, look up which channel uses that connector. Stop the channel, snapshot the heap again, and watch the memory drop.
Step 5: Apply the Right Fix
Match the dominator to one of the five root causes above. Deploy the fix to a non-prod environment, run a 4-hour load test, then schedule production deployment.
What Healthy Mirth Memory Looks Like
After the fix, you want a sawtooth pattern: heap fills with young-generation allocations, GC drops it back down, repeat. The pattern should be predictable, with old-generation usage staying under 70% across days.
If you don't have monitoring in place yet, this is the single highest-ROI investment you can make. A 30-minute Prometheus/Grafana setup will surface heap problems hours before they cause outages. Our Mirth Connect monitoring guide walks through the full setup with the dashboards we use in production.
Root Cause Frequency: What Actually Causes These Outages
Looking back at every Mirth memory incident we've worked on over the past four years, the distribution of root causes is remarkably consistent. Most teams expect the answer to be "we need a bigger heap," but an undersized heap is only the fourth most common cause.
The headline: the top three causes together account for 71% of memory incidents, and all three are configuration or code problems — not infrastructure problems. Throwing RAM at them buys time, not safety.
When to Call a Specialist
Some of this is straightforward. Some of it is not. Here's our honest guidance on when to escalate.
Handle it yourself if:
- The fix is "increase
-Xmx" and your monitoring confirms heap utilization stays under 75% afterward. - You can identify the leaking channel, and the JavaScript anti-pattern is obvious.
- You have a non-production environment to test in.
- The engine is not currently down.
Call a specialist if:
- Heap fills within minutes of restart, even with
-Xmxdoubled. - Eclipse MAT shows dominators in Mirth internals (the engine's own classes, not your transformers).
- You're on Java 8 with Mirth 3.x and considering an upgrade — there are migration gotchas that can make memory worse.
- The deployment is HIPAA-critical and you can't afford another outage. See our guide on Mirth Connect high availability for the architecture pattern.
- You suspect a memory leak in a custom Java extension or connector.
The window between "manageable performance issue" and "C-suite is asking why ER labs aren't flowing" is shorter than most teams think. A 15-minute consultation while you still have options is always cheaper than a 6-hour outage post-mortem.
Beyond the Heap: Long-Term Mirth Memory Hygiene
The teams that never see another OOM aren't lucky — they've operationalized memory management. Here's what they do differently.
1. Treat mcserver.vmoptions as code. Version it in git, code-review changes, and roll them out through your normal change management. Random heap edits in production are a top cause of regression.
2. Run load tests before every major channel deploy. A new transformer that allocates 50 KB more per message will quietly eat 50% more heap when traffic doubles. Catch it before it catches you. Our Mirth Connect performance tuning guide walks through the 10,000 messages/hour benchmark setup.
3. Monitor the four signals that matter. Heap usage, GC pause time, GC frequency, and channel queue depth. If these are green, your engine is healthy. If any of them trend upward without a known cause, investigate before it becomes an outage.
4. Audit attachments quarterly. Volumes grow, document sizes change, new partners send PDFs nobody knew about. The attachment configuration that worked last year may be the leak next year.
5. Prune aggressively. HIPAA retention requirements are about clinical records, not about every HL7 ACK ever sent. Keep the operational store lean.
6. Plan the licensing change. With NextGen's Mirth Connect transitioning to a commercial model, many teams are revisiting their long-term plan. If you're evaluating options, our Mirth Connect alternatives guide compares the realistic paths forward, and the BridgeLink migration guide covers the open-source fork option.
7. Build the runbook. This article is a runbook. Build your own — site-specific, with your PIDs, paths, and Slack channels. The team that handles a 2 a.m. OOM in 10 minutes has rehearsed it.
Production Down? Talk to a Mirth Engineer in 15 Minutes
If you're in the middle of an incident, stop reading and reach out. Our Mirth engineering team is on call for hospital integration emergencies, and we've worked the exact failure modes in this guide on dozens of production deployments.
Need expert help with healthcare data integration and engine reliability? Explore our Healthcare Interoperability Solutions to see how we run interoperability for hospital systems, or our Healthcare Software Product Development services for the deeper architectural work. Talk to our team to get started.