Healthcare organizations lose an estimated $125 billion or more annually to charge leakage—services rendered but never billed, charges coded incorrectly, or revenue silently eroding through gaps in the charge-to-billing pipeline. According to the Healthcare Financial Management Association (HFMA), poor charge capture and reconciliation practices cost organizations 1–5% of net revenue annually. For a $500 million health system, that translates to $5–25 million in preventable losses every year.
Charge reconciliation—the systematic process of verifying that every billable service is captured, coded, and submitted for payment—has traditionally been a labor-intensive, retrospective exercise. Revenue integrity teams manually compare patient encounters against billed charges, hunting for discrepancies days or weeks after services were delivered. By then, the window for timely billing has often closed.
Artificial intelligence is fundamentally transforming this equation. AI-powered charge reconciliation systems can analyze millions of charge transactions in real time, flag anomalies before they become revenue leaks, and continuously learn from historical patterns to predict where charge capture failures are most likely to occur. This shift from reactive reconciliation to proactive revenue protection represents one of the highest-ROI applications of AI in the healthcare revenue cycle.
This guide examines the complete charge reconciliation lifecycle—from charge capture through billing—and details how AI, machine learning, and FHIR-based interoperability are enabling a new generation of revenue integrity solutions that US health systems are deploying today.
What Is Charge Reconciliation and Why Does It Matter?
Charge reconciliation is the process of comparing services documented in the clinical record against charges submitted for billing. It ensures completeness (every service is captured), accuracy (correct codes and quantities), and compliance (charges align with payer rules and federal regulations).
The financial stakes are significant. Research from the MD Clarity platform indicates that over 40% of healthcare organizations report losing 10% or more of annual revenues to leakage, with 19% losing over 20%. The Zotec Partners analysis found that 3–5% of hospital revenue is lost specifically to charge capture failures—resulting in millions of dollars in uncollected reimbursements annually for mid-size hospitals.
Beyond direct revenue loss, charge reconciliation failures create cascading problems:
- Compliance risk: Unbundling errors, upcoding, and billing for services not rendered are among the top enforcement targets of the HHS Office of Inspector General (OIG). The OIG's General Compliance Program Guidance explicitly identifies billing and coding as a primary risk area requiring internal monitoring.
- Denial rate increases: Inaccurate charges generate claim denials. Up to 70% of initially denied claims are later overturned on appeal, representing nearly $18 billion wasted industry-wide on disputes that should not have occurred.
- Audit exposure: Medicare Recovery Audit Contractors (RACs) and commercial payer audits increasingly use algorithmic analysis to identify charge patterns inconsistent with clinical documentation.
- Operational drag: Manual reconciliation workflows consume 15–20 full-time equivalent (FTE) staff at large health systems, with turnaround times of 48–72 hours per reconciliation cycle.
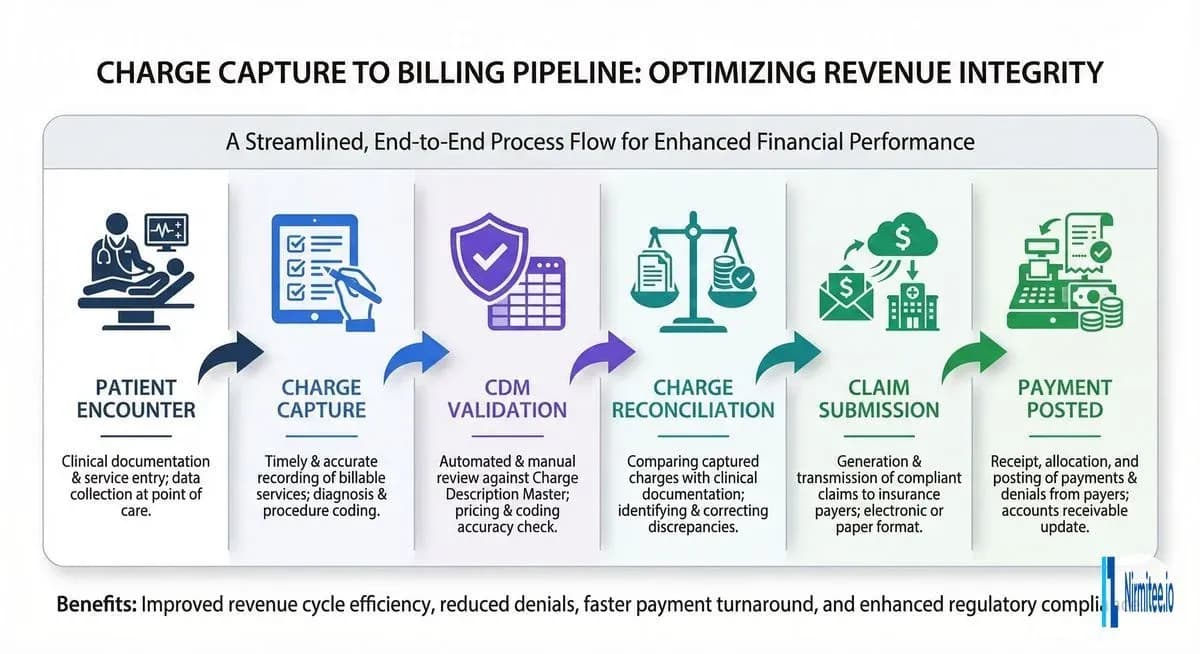
The Charge Capture-to-Billing Pipeline
Understanding charge reconciliation requires mapping the full revenue capture lifecycle. Each stage introduces potential failure points where charges can be missed, miscoded, or delayed.
Stage 1: Patient Encounter and Clinical Documentation
Revenue integrity begins at the point of care. Clinicians document services in the electronic health record (EHR)—procedures performed, medications administered, supplies used, and time spent. The quality and completeness of this documentation directly determines what can be billed. If a physician performs a complex wound debridement but only documents a simple dressing change, the charge differential can be hundreds of dollars per encounter.
Stage 2: Charge Capture
Charge capture converts clinical documentation into billable transactions. In modern EHR systems like Epic and Oracle Health (Cerner), charge capture can be automated through several mechanisms:
- Charge linking: Automatically drops charges when related orders are completed
- Flowsheet-based charging: Files charges based on clinician documentation in structured flowsheets
- Procedure-note triggers: Generates charges when procedure notes are finalized
- Manual charge entry: Clinicians or coders manually enter charges via charge capture applications
Despite automation capabilities, Medaptus research shows that significant gaps remain—particularly in outpatient settings, infusion centers, and observation units where charge rules are complex and documentation requirements vary by payer.
Stage 3: CDM Validation
Every charge flows through the Charge Description Master (CDM)—the organization's master reference file mapping services to CPT/HCPCS codes, revenue codes, and prices. CDM validation ensures that captured charges reference valid, current codes and that pricing is consistent. We cover CDM management in detail below.
Stage 4: Charge Reconciliation
This is where captured charges are compared against the clinical record. The reconciliation process identifies:
- Services documented but not charged (missed charges)
- Charges without supporting documentation (phantom charges)
- Code mismatches between documentation and charge codes
- Quantity discrepancies (e.g., medication doses)
- Timing inconsistencies (charges outside encounter dates)
Stage 5: Claim Submission and Payment
Reconciled charges are bundled into claims (UB-04 for institutional, CMS-1500 for professional), scrubbed against payer-specific edits, and submitted electronically. Post-submission, payment posting and remittance reconciliation close the loop.
Common Types of Charge Leakage
Charge leakage occurs at every stage of the pipeline. Understanding the taxonomy of leakage types is essential for building effective detection systems.
Missed Charges (30–40% of Total Leakage)
The single largest category of charge leakage. Missed charges occur when a service is documented in the clinical record but never converted to a billable charge. Common scenarios include:
- Observation hours: Patients held in observation status often accumulate charges for monitoring, medications, and nursing assessments that are not captured because the observation workflow bypasses standard charge triggers.
- Supply charges: High-cost implants, specialty dressings, and surgical supplies used during procedures may not be linked to charge capture rules, particularly when supply chain systems are not integrated with the EHR.
- After-hours services: Services rendered during off-hours, weekends, or holidays frequently miss charge capture because coverage clinicians may be less familiar with department-specific charging protocols.
- Multi-department encounters: Patients who receive services across multiple departments (e.g., ED to radiology to surgery) create charge fragmentation where each department assumes another captured the charge.
Incorrect Codes (25–30% of Total Leakage)
Coding errors include selecting the wrong CPT code, applying incorrect modifiers, or failing to capture the appropriate level of service. Examples include:
- Downcoding E/M visits (billing a Level 3 when documentation supports Level 4)
- Missing modifier -59 for distinct procedural services, causing bundling denials
- Using outdated codes when annual CPT updates take effect
- Failing to apply bilateral modifiers for procedures performed on both sides
Unbundling Errors (15–20% of Total Leakage)
Unbundling occurs when components of a bundled service are billed separately, either inflating charges (compliance risk) or when the bundled code is more appropriate and would result in different reimbursement. The National Correct Coding Initiative (NCCI) edits define which code pairs should be bundled, and violations trigger automatic denials.
Duplicate Charges (10–15% of Total Leakage)
Duplicate charges arise from system integration failures—when the same service is captured by multiple charge triggers (e.g., both an order completion trigger and a manual charge entry), or when charge files are reprocessed due to system errors.
Late Charges and Timely Filing Failures
Charges captured after the claim has been submitted require costly rebilling processes. Charges captured after the payer's timely filing deadline (typically 90–365 days depending on the payer) result in permanent revenue loss with no recourse.
Manual vs. Automated Charge Reconciliation
The traditional approach to charge reconciliation relies on revenue integrity analysts manually comparing census reports, surgery logs, and departmental records against charge files. This approach has fundamental limitations that AI-powered automation addresses.
Manual Reconciliation: The Legacy Approach
| Dimension | Manual Process |
|---|---|
| Accuracy | 65–75% charge capture rate |
| Turnaround | 48–72 hours per reconciliation cycle |
| Staffing | 15–20 FTEs for large health systems |
| Coverage | Sample-based (10–20% of encounters reviewed) |
| Detection | Retrospective—identifies issues after billing |
| Scalability | Linear—more volume requires more staff |
Manual reconciliation is inherently retrospective. By the time discrepancies are identified, the clinical context has faded, making it difficult to determine whether a missed charge represents an actual service or a documentation artifact. Staff fatigue and turnover further erode accuracy.
AI-Powered Reconciliation: The Modern Approach
| Dimension | AI-Powered Process |
|---|---|
| Accuracy | 90–99% charge capture rate |
| Turnaround | Real-time or near-real-time (minutes) |
| Staffing | 2–3 FTEs for oversight and exception handling |
| Coverage | 100% of encounters analyzed |
| Detection | Proactive—flags issues before claim submission |
| Scalability | Logarithmic—handles volume increases with minimal resource growth |
AI-powered systems analyze every encounter in real time, comparing clinical documentation against expected charge patterns. When an orthopedic surgeon documents a total knee arthroplasty but the charge file only shows the implant supply charge without the procedure code, the system flags it immediately—before the claim is submitted.
AI for Charge Anomaly Detection
The core technical capability enabling modern charge reconciliation is machine learning-based anomaly detection. These systems learn from millions of historical charge transactions to build statistical models of expected charge patterns for every combination of provider, department, procedure type, and patient acuity.
Machine Learning Models for Charge Reconciliation
Three primary model architectures power modern charge anomaly detection:
1. Isolation Forest Models
Isolation forests are unsupervised learning algorithms that identify anomalies by measuring how easily a data point can be isolated from the rest of the dataset. In charge reconciliation, an isolation forest might flag a charge entry where:
- The charge amount is statistically unusual for the associated CPT code
- The number of line items per encounter deviates significantly from the department's historical pattern
- The combination of diagnosis codes and procedure codes is rare in the training data
Isolation forests are particularly effective for detecting novel anomaly types that rule-based systems would miss because they don't require predefined patterns.
2. Supervised Classification Models
Neural networks and gradient-boosted trees trained on labeled historical data (charges confirmed as correct vs. charges identified as errors) can classify new charges with high precision. These models learn complex feature interactions—for example, that a particular combination of surgeon, procedure code, and operating room duration predicts specific supply charges that should appear.
Feature engineering for charge classification models typically includes:
- Provider historical charge patterns (charges per encounter, code distribution)
- Department-level norms (average charges per admission by DRG)
- Temporal features (day of week, time of day, month-end patterns)
- Clinical complexity indicators (comorbidity indices, procedure duration)
- CDM mapping validation (code-to-description consistency)
3. Rules Engine with ML Augmentation
A hybrid approach combines deterministic business rules (e.g., "every knee arthroplasty must include implant charges") with ML-based confidence scoring. The rules engine catches known failure modes with 100% recall, while the ML layer identifies emerging patterns and edge cases. This architecture provides the explainability that compliance teams require while maintaining the adaptability of learning systems.
Confidence Scoring and Prioritization
Not all flagged anomalies carry equal financial impact. AI systems assign confidence scores and estimated revenue impact to each flag, enabling revenue integrity teams to prioritize high-value exceptions. A missed charge on a $50,000 cardiac catheterization receives immediate attention, while a $15 supply charge discrepancy routes to batch review.
CDM (Charge Description Master) Management and Validation
The Charge Description Master is the backbone of charge integrity. A poorly maintained CDM introduces systematic errors that no amount of downstream reconciliation can fully correct.
CDM Structure and Components
A hospital CDM typically contains 30,000–80,000 line items, each mapping:
- Charge code: Internal identifier for the service or supply
- Description: Human-readable service description
- CPT/HCPCS code: Standard procedure or supply code for billing
- Revenue code: UB-04 revenue category
- Price: The facility's charge amount (gross charge)
- Department: Originating department or cost center
- GL account: General ledger mapping for financial reporting
CDM Maintenance Best Practices
According to Freed Associates, seven critical practices define CDM excellence:
- Quarterly code updates: The AMA and CMS release coding changes in January, April, July, and October. Every update must be reflected in the CDM before the effective date.
- Centralized ownership: A dedicated CDM analyst or team should own the master file, with defined change management processes that require clinical, coding, and compliance sign-off.
- Pricing consistency: Charges must be defensible, consistent (left knee same price as right knee), and logical (CT with contrast priced higher than CT without).
- Monthly departmental reviews: Each clinical department should review its CDM section monthly to ensure new services are added and retired services are deactivated.
- Compliance benchmarking: The industry standard benchmark for CDM compliance is 95% or higher. Organizations below this threshold face elevated audit risk.
- Cross-reference validation: Every CDM entry should be validated against NCCI edits, LCD/NCD coverage policies, and payer-specific fee schedules.
- Audit trail: All CDM changes must be logged with timestamps, user identification, and justification—essential for OIG compliance program requirements.
AI-Powered CDM Validation
AI can continuously scan the CDM for issues that periodic manual reviews miss:
- Orphaned codes: CDM entries referencing deleted or replaced CPT codes
- Pricing outliers: Charges that deviate significantly from Medicare fee schedule benchmarks or regional norms
- Missing mappings: New services being delivered clinically that have no corresponding CDM entry
- Bundling conflicts: CDM entries that create NCCI edit violations when charged together
Integration with EHR Charge Capture Systems
Effective charge reconciliation requires deep integration with the EHR platforms where charges originate. The two dominant platforms in the US market—Epic and Oracle Health—each have distinct charge capture architectures.
Epic Integration
Epic's charge capture ecosystem includes several key components:
- Charge Router: The central engine that processes charge triggers and routes them through validation rules before posting to the billing system.
- Professional Billing (PB) and Hospital Billing (HB) workqueues: Queues where charge exceptions are routed for manual review.
- Charge Review workbench: Interface for revenue integrity staff to review and resolve charge discrepancies.
- Cadence/Prelude integration: Links scheduling and registration data to expected charge patterns.
AI reconciliation systems integrate with Epic through several interfaces: HL7v2 ADT/DFT message feeds for real-time charge data, Epic FHIR APIs (R4) for clinical documentation access, and Clarity/Caboodle data warehouse extracts for historical pattern analysis.
Oracle Health (Cerner) Integration
Oracle Health's Millennium platform provides charge capture through its Revenue Cycle Management module, with charge automation driven by order-based charging rules. The FHIR R4 ChargeItem API enables external systems to query and create charge items programmatically, facilitating real-time reconciliation workflows.
FHIR ChargeItem and Account Resources
The HL7 FHIR standard provides two resources directly relevant to charge reconciliation, enabling interoperable charge data exchange across systems. For organizations building or integrating revenue integrity solutions, understanding these resources is essential.
ChargeItem Resource
The FHIR ChargeItem resource represents the administrative record of a charge for healthcare services. Key attributes include:
- status: planned | billable | not-billable | aborted | billed | entered-in-error
- code: The charge code (maps to CDM entry)
- subject: Reference to the Patient
- context: Reference to the Encounter
- occurrencePeriod: When the service was delivered
- performer: Who delivered the service
- quantity: Number of units
- account: Reference to the billing Account
ChargeItem is explicitly an administrative resource—it records the provision of a service for billing purposes but is not itself a financial transaction. A billing engine processes ChargeItems to generate Claim or Invoice resources.
Account Resource
The FHIR Account resource acts as the billing bucket to which ChargeItems are linked. It tracks:
- status: active | inactive | entered-in-error | on-hold | unknown
- type: patient | insurance | guarantor
- subject: The patient or organization
- coverage: Insurance coverage associated with the account
- guarantor: Responsible party for payment
Reconciliation via FHIR
FHIR-based charge reconciliation workflows query ChargeItem resources by encounter, compare against expected charges derived from clinical resources (Procedure, MedicationAdministration, Observation), and flag discrepancies. This approach enables reconciliation logic to operate across EHR boundaries—critical for health systems using multiple EHR platforms or integrating ambulatory and acute care systems.
For organizations building custom revenue cycle management software, the FHIR ChargeItem API provides a standards-based integration path that avoids vendor lock-in.
Real-Time Reconciliation Dashboards
Visibility transforms charge reconciliation from a back-office function to an operational discipline. Modern reconciliation platforms provide real-time dashboards that surface charge integrity metrics at the organizational, departmental, and individual provider levels.
Key Dashboard Metrics
| Metric | Description | Target |
|---|---|---|
| Charge Capture Rate | Percentage of documented services with corresponding charges | >95% |
| Reconciliation Turnaround | Time from service delivery to charge reconciliation | <4 hours |
| Anomaly Detection Rate | Percentage of charges flagged for review | 3–7% |
| False Positive Rate | Percentage of flagged charges confirmed as correct | <15% |
| Revenue Recovery | Dollar value of missed charges identified and captured | Track monthly |
| Late Charge Rate | Percentage of charges posted after claim submission | <2% |
| CDM Compliance Score | Percentage of CDM entries passing validation rules | >95% |
Department-Level Drill-Downs
Effective dashboards allow revenue integrity leaders to drill from organizational KPIs into department-specific patterns. Surgical departments typically show different leakage profiles than radiology or pharmacy. Surgery may have high missed supply charges, while radiology may show coding level discrepancies, and pharmacy may exhibit medication quantity mismatches.
Provider Scorecards
Individual provider charge capture scorecards—showing each physician's charge capture rate relative to peers in the same specialty—create accountability and enable targeted education. When a surgeon's implant charge capture rate drops from 98% to 85%, the dashboard surfaces this trend before it compounds into significant revenue loss.
Compliance: OIG Program Guidance and Regulatory Framework
Charge reconciliation exists within a strict regulatory environment. Organizations must ensure their processes satisfy federal compliance requirements while maximizing legitimate revenue capture.
OIG General Compliance Program Guidance
The OIG's General Compliance Program Guidance (GCPG), issued in November 2023 and reinforced by the February 2026 Industry Compliance Program Guidance for Medicare Advantage, identifies billing and coding as a primary compliance risk area. Key requirements relevant to charge reconciliation include:
- Internal monitoring: Organizations must implement regular auditing and monitoring of billing practices
- Risk assessment: Periodic assessment of charge capture processes for fraud, waste, and abuse vulnerabilities
- Corrective action: Defined processes for addressing identified billing discrepancies, including overpayment refunds within 60 days per the ACA Section 6402 requirement
- Training: Annual compliance training for staff involved in charge capture and coding
False Claims Act Considerations
The False Claims Act (31 U.S.C. sections 3729–3733) imposes treble damages and per-claim penalties for knowingly submitting false claims to government payers. Charge reconciliation processes that identify but fail to correct billing errors can create "knowing" liability under the Act. AI systems that maintain comprehensive audit trails provide documented evidence of good-faith compliance efforts.
AI-Specific Compliance Considerations
As AI becomes integral to charge reconciliation, organizations should address:
- Model transparency: Compliance teams must understand why the AI flagged or cleared specific charges. Black-box models create audit risk.
- Bias monitoring: ML models trained on historical data may perpetuate existing charge capture biases. Regular model performance audits across patient demographics, departments, and payer types are essential.
- Human oversight: AI should augment, not replace, human judgment. Final charge decisions should involve human review, with the AI providing recommendations and confidence scores.
- Documentation: Maintain records of model versions, training data, validation results, and decision rationale for regulatory examination.
Implementation Roadmap: From Assessment to AI-Powered Reconciliation
Deploying AI-powered charge reconciliation is a phased initiative that builds organizational capability progressively. The following roadmap reflects implementation patterns from US health systems that have successfully deployed these solutions.
Phase 1: Assessment and Baseline (Months 1–2)
- Charge leakage audit: Conduct a retrospective analysis of 6–12 months of charge data to quantify current leakage by department, service line, and leakage type
- Workflow mapping: Document current charge capture and reconciliation workflows for each department, identifying manual touchpoints and system gaps
- Baseline metrics: Establish current-state KPIs (charge capture rate, reconciliation turnaround, late charge rate, denial rate attributed to charge errors)
- Technology assessment: Evaluate current EHR charge capture configuration, CDM health, and integration capabilities
Phase 2: Foundation Building (Months 3–4)
- CDM standardization: Clean and validate the CDM against current CPT/HCPCS codes, NCCI edits, and payer fee schedules. Achieve >95% CDM compliance score
- EHR integration: Establish real-time data feeds from the EHR (HL7v2 messages, FHIR APIs) to the reconciliation platform
- Data pipeline: Build the data infrastructure for ML model training—historical charge data, clinical documentation, claim outcomes, and denial reasons
- Rules engine deployment: Implement deterministic reconciliation rules for known high-impact leakage patterns (e.g., surgery supply charges, observation charges)
Phase 3: AI Deployment (Months 5–8)
- Model training: Train anomaly detection models on 12–24 months of historical charge data with labeled outcomes (correct charges, missed charges, coding errors)
- Shadow mode: Deploy models in observation mode alongside existing processes. Compare AI recommendations against manual reconciliation outcomes to validate accuracy
- Dashboard launch: Deploy real-time reconciliation dashboards for revenue integrity leadership, department managers, and individual providers
- Workflow integration: Route AI-flagged exceptions into existing EHR workqueues for seamless review by revenue integrity staff
Phase 4: Optimization and Scale (Months 9–12)
- Model refinement: Retrain models with production feedback data. Reduce false positive rates based on analyst adjudication patterns
- Department expansion: Extend coverage from pilot departments to all clinical areas
- ROI measurement: Quantify recovered revenue, staffing efficiency gains, denial rate improvements, and compliance metric improvements
- Continuous learning: Establish automated model retraining pipelines triggered by code updates, payer policy changes, or performance degradation
Measuring ROI: The Business Case for AI Charge Reconciliation
Health system CFOs evaluating AI charge reconciliation investments should model returns across four value categories:
| Value Category | Typical Impact | Example (500-bed System) |
|---|---|---|
| Recovered missed charges | 1–3% of net patient revenue | $5M–$15M annually |
| Reduced denials | 15–25% reduction in charge-related denials | $1.5M–$3M annually |
| Staffing efficiency | 60–70% reduction in manual reconciliation FTEs | $1M–$1.5M annually |
| Compliance risk reduction | Quantified by reduced audit findings | $500K–$2M in avoided penalties |
For a 500-bed health system with $500M in net patient revenue, the total annual value of AI-powered charge reconciliation typically ranges from $8M to $21.5M—against implementation costs of $2M–$4M in the first year and $500K–$1M in ongoing annual costs. The payback period is typically 3–6 months.
Frequently Asked Questions
What is charge reconciliation in healthcare?
Charge reconciliation is the systematic process of comparing services documented in clinical records against charges submitted for billing. It ensures every billable service provided to a patient is captured, correctly coded, supported by documentation, and submitted to the appropriate payer. The goal is to eliminate revenue leakage while maintaining compliance with federal billing regulations.
How does AI improve charge reconciliation accuracy?
AI improves accuracy by analyzing 100% of encounters in real time (versus 10–20% in manual sampling), learning from millions of historical charge patterns to identify anomalies, and flagging discrepancies before claims are submitted. Machine learning models can detect subtle patterns—such as a specific surgeon consistently missing supply charges for a particular procedure—that manual reviewers would never identify across thousands of daily transactions.
What is a Charge Description Master (CDM) and why does it matter for reconciliation?
The Charge Description Master is the master reference file that maps every billable service to its corresponding CPT/HCPCS code, revenue code, and price. It typically contains 30,000–80,000 line items for a hospital. An inaccurate CDM introduces systematic errors into every charge that references a flawed entry—making CDM integrity the foundation of effective charge reconciliation. The industry benchmark for CDM compliance is 95% or higher.
How much revenue do hospitals lose to charge leakage?
Industry estimates indicate that healthcare organizations lose 1–5% of net patient revenue to charge capture and reconciliation failures. For a $500 million health system, this translates to $5–25 million annually. Across the US healthcare industry, charge leakage contributes to an estimated $125 billion or more in revenue losses, with missed charges representing the largest single category at 30–40% of total leakage.
What FHIR resources support charge reconciliation?
The two primary FHIR resources for charge reconciliation are ChargeItem and Account. ChargeItem represents the administrative record of a billable service, including the charge code, patient, encounter, performer, and quantity. Account acts as the billing container to which ChargeItems are linked. Together, they enable interoperable charge data exchange across EHR platforms and support standards-based reconciliation workflows.
Healthcare organizations that continue to rely on manual, retrospective charge reconciliation are leaving millions of dollars in legitimate revenue uncaptured while exposing themselves to compliance risk. AI-powered reconciliation—integrated with EHR charge capture systems, validated against a well-maintained CDM, and monitored through real-time dashboards—represents the standard of care for revenue integrity in 2026 and beyond.
The technology is proven, the ROI is compelling, and the implementation path is well-defined. The organizations that act now will compound their advantage as their AI models learn and improve with every reconciliation cycle.
To explore how agentic AI is transforming the broader revenue cycle, including charge reconciliation as a key workflow, read our comprehensive guide. For a deeper dive into the 12 RCM workflows that benefit from automation architecture, see our technical breakdown.