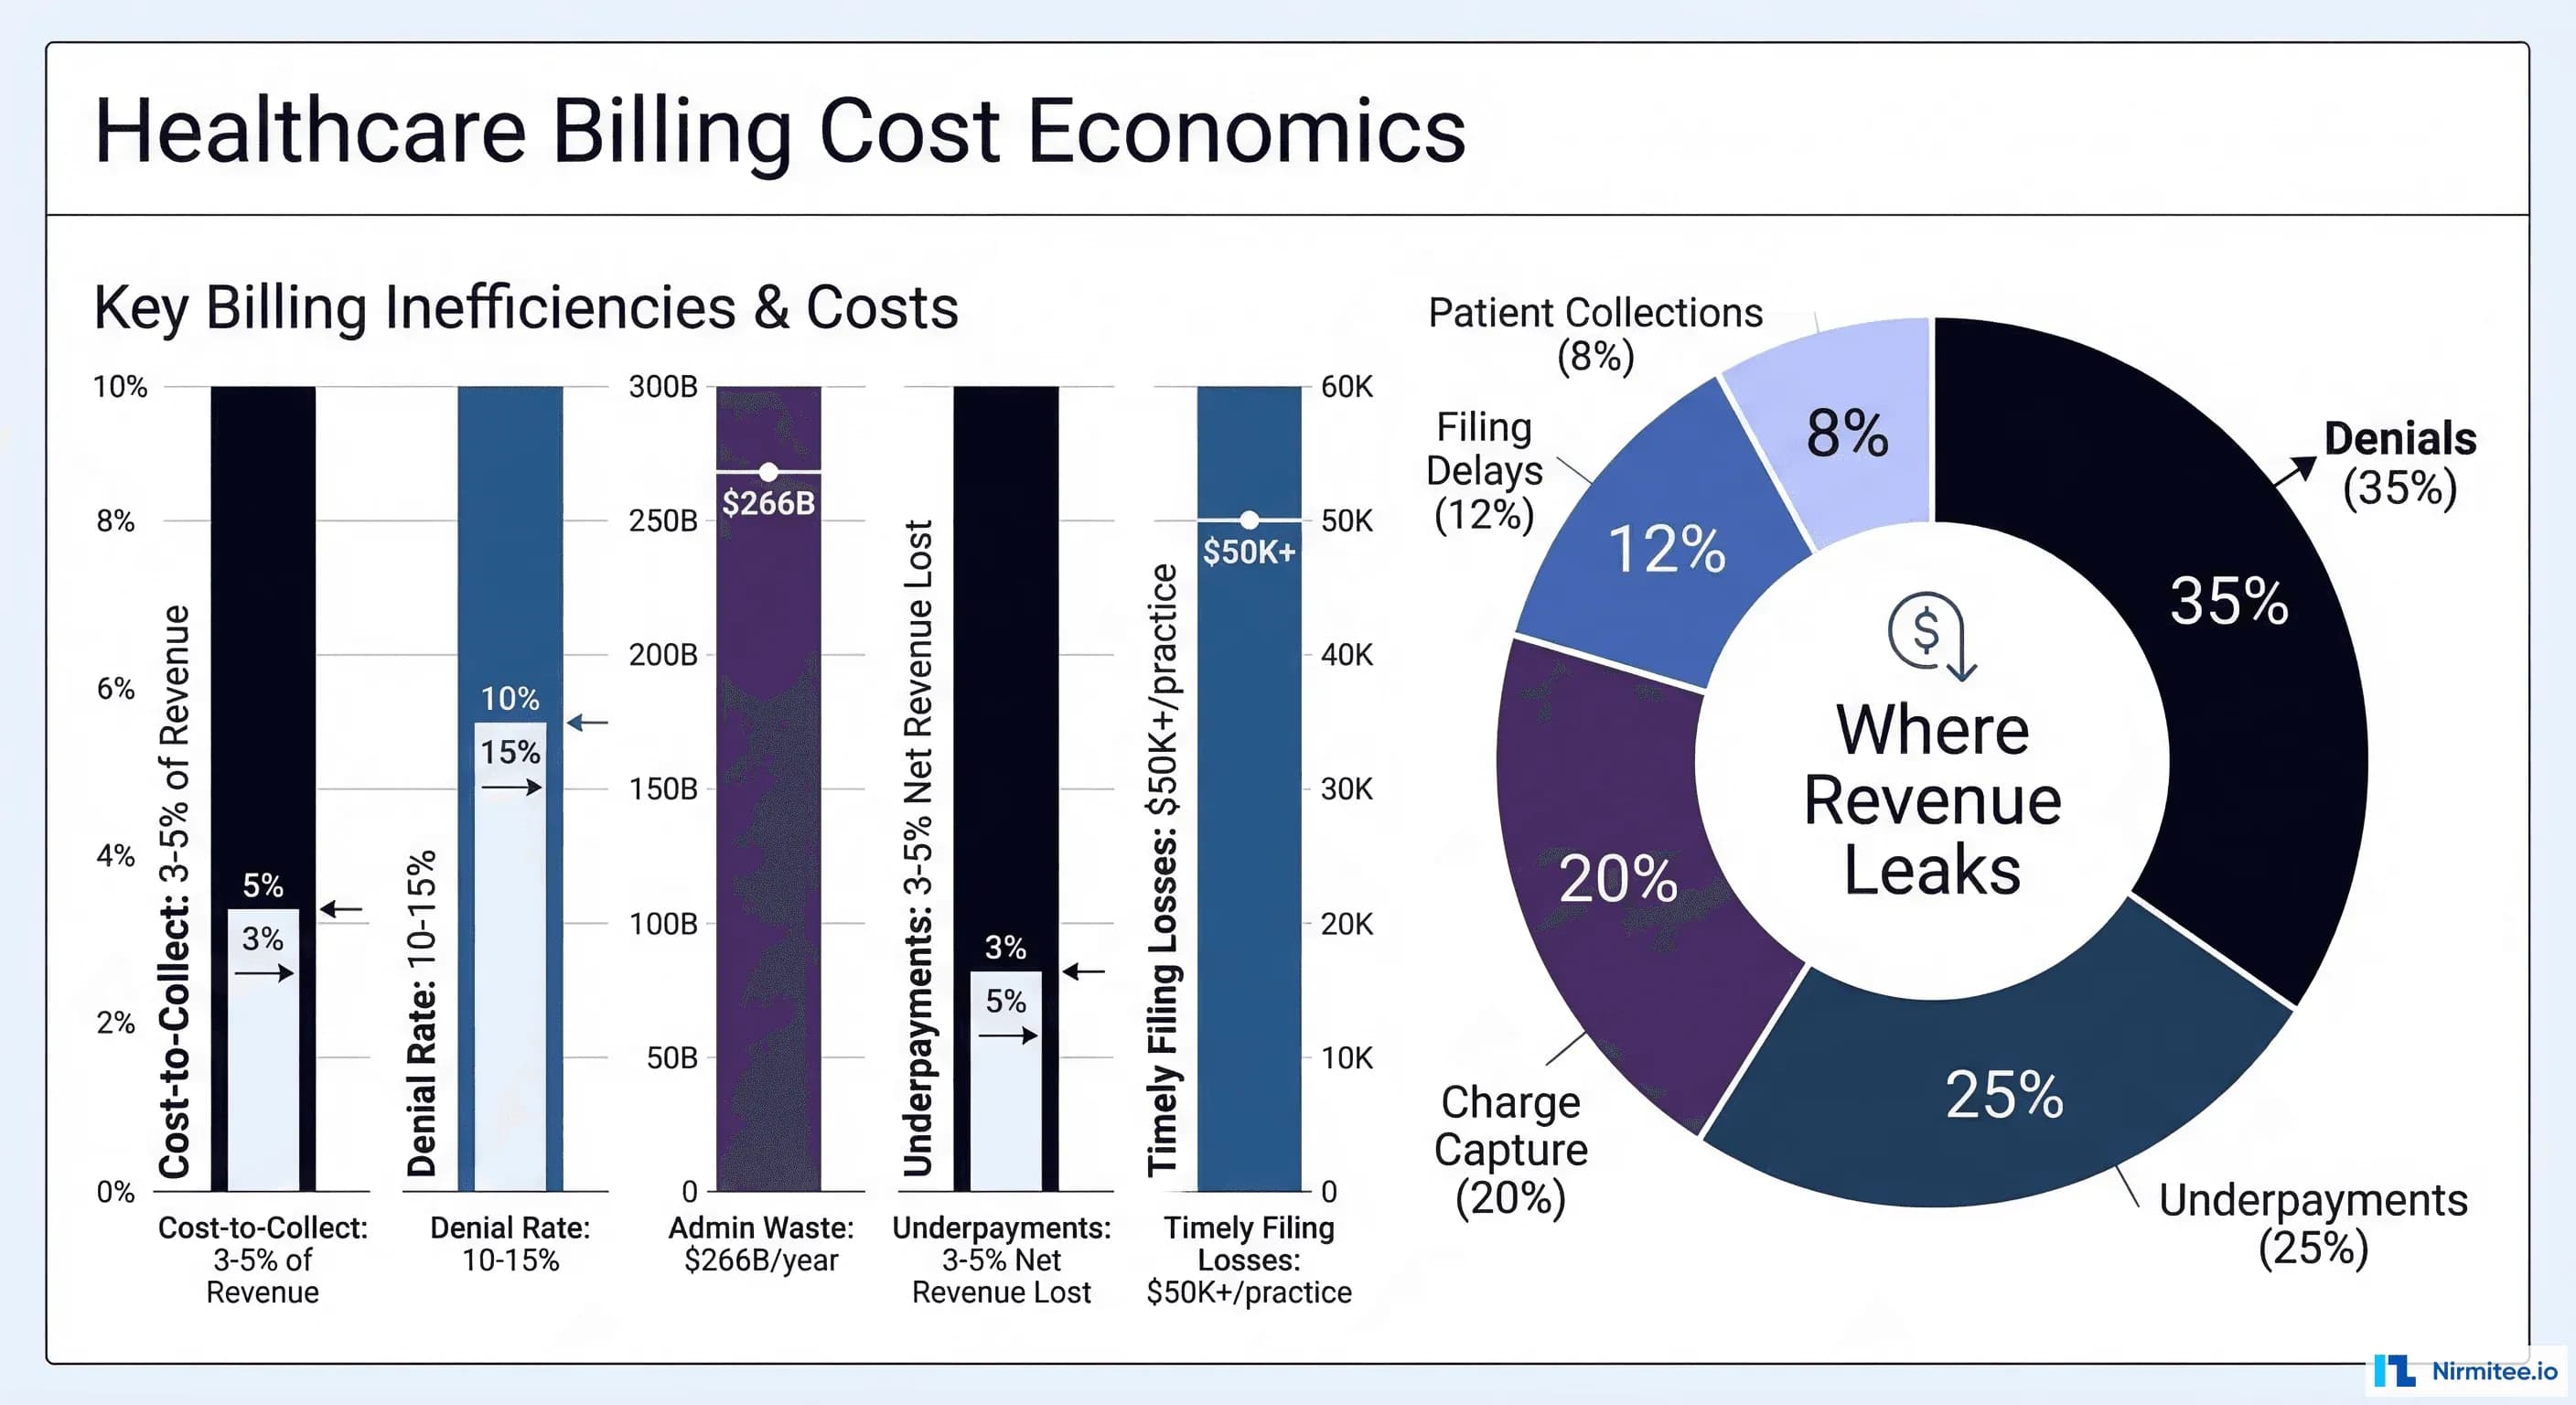
Healthcare CFOs are navigating a financial landscape that grows more challenging every quarter. Hospital operating margins averaged just 2.1% in 2024—down from 7.0% in 2019—and continued declining into 2025. Meanwhile, the U.S. healthcare system hemorrhages roughly $266 billion annually in administrative waste, with billing inefficiency as a primary driver. The cost-to-collect benchmark, once 3–5% of net revenue, has dropped to 2% at best-practice organizations—yet most health systems still operate well above that threshold.
This is not a technology problem. It is a margin problem. And AI is the most powerful lever available to solve it.
This guide is written for the healthcare CFO who needs to understand exactly how AI impacts billing margins, which levers to pull first, and how to build a defensible ROI case for the board. We go beyond vendor marketing to provide operational frameworks, margin impact formulas, implementation timelines, and a complete CFO dashboard for tracking results.
The Current State of Healthcare Billing Economics
Before diving into AI solutions, every CFO must understand the baseline economics driving billing margin compression. The numbers paint a stark picture.
The $266 Billion Administrative Waste Problem
According to Health Affairs research, administrative costs represent the largest category of healthcare waste in the United States—roughly $266 billion annually. This figure dwarfs clinical waste categories. The U.S. spends $1,055 per capita on healthcare administration, compared to $306 in Germany (the second-highest spender). The fragmented multi-payer system, inconsistent billing processes, and lack of standardization create compounding inefficiencies at every step of the revenue cycle.
For a mid-sized health system generating $500 million in annual revenue, administrative waste typically consumes $15–25 million—money that flows directly off the bottom line.
Key Billing Benchmarks Every CFO Should Know
| Metric | Industry Average | Best Practice | AI-Enabled Target |
|---|---|---|---|
| Cost-to-Collect | 3–5% of net revenue | 2% | 1–1.5% |
| Clean Claim Rate | 70–85% | 95% | 97–99% |
| Denial Rate | 10–15% | 5–7% | 2–4% |
| Days in A/R | 45–65 | 35–40 | 28–32 |
| First-Pass Resolution Rate | 75–80% | 90% | 95–98% |
| Net Collection Rate | 92–95% | 97% | 98–99% |
| Underpayment Leakage | 3–5% of net revenue | 1–2% | <0.5% |
The gap between industry average and AI-enabled performance represents millions of dollars in margin improvement for most organizations. According to McKinsey's 2025 analysis, AI enablement of revenue cycle operations could cut cost-to-collect by 30 to 60 percent while optimizing payment accuracy.
The 7 Margin Levers AI Impacts in Healthcare Billing
AI does not improve billing in a single sweeping motion. It operates through specific, measurable margin levers—each with distinct economics, implementation requirements, and ROI timelines. Here are the seven levers that matter most to the CFO.
Lever 1: Reduce Cost-to-Collect Through AI-Powered Coding
Current State
Medical coding remains one of the most labor-intensive steps in revenue cycle management. The average coder handles 20–25 charts per hour for outpatient and 2–4 per hour for inpatient. Coding errors are the leading cause of claim denials, and the percentage of providers reporting denial rates above 10% surged from 30% in 2022 to 41% in 2025, according to Experian's State of Claims report. Each denied claim costs $25–$118 to rework.
AI-Enabled State
AI coding engines using Natural Language Processing (NLP) analyze clinical documentation and automatically assign CPT and ICD-10 codes with accuracy rates exceeding 95%. These systems process charts in seconds rather than minutes, reducing the volume of denials caused by coding errors by 60–80%. Real-world example: Inova Health System reduced annual coding costs by $500,000, decreased Days Not Final Billed (DNFB) by 50%, and increased charge capture by 10% after implementing autonomous AI coding.
Margin Impact Formula
Annual Savings = (Current Denial Rate − AI Denial Rate) × Total Claims × Average Rework Cost + Coder FTE Reduction × Average Coder Salary
For a system processing 500,000 claims annually: Reducing denial rate from 12% to 4% = 40,000 fewer reworked claims × $50 average rework cost = $2 million in annual savings from denials alone, plus $300,000–$500,000 in reduced coding labor.
Implementation Timeline
3–6 months for full deployment. Most AI coding platforms require 4–8 weeks of training on your specific documentation patterns before achieving target accuracy. Expect 90-day parallel coding (AI + human review) before transitioning to AI-primary workflows.
Key vendors: Nym Health, 3M 360 Encompass, Fathom AI, Nuance DAX
Lever 2: Accelerate Cash Flow With AI Claim Scrubbing
Current State
The average healthcare organization submits claims with a first-pass clean claim rate of 70–85%. Every rejected or denied claim extends the cash conversion cycle by 30–90 days. With Days in A/R averaging 45–65 days at most organizations, millions of dollars sit in receivables rather than operating accounts. This creates working capital pressure that forces CFOs into expensive short-term borrowing or delays capital investments.
AI-Enabled State
AI claim scrubbing engines analyze every claim against payer-specific rules, historical denial patterns, and real-time policy changes before submission. These systems catch errors that rules-based scrubbers miss because they learn from denial patterns across the entire payer landscape. Organizations implementing AI-enhanced claims processing report first-pass clean claim rates of 95–99.25% and processing time reductions of up to 80%, according to industry analyses.
Margin Impact Formula
Cash Flow Improvement = (Days in A/R Reduction) × (Average Daily Revenue) × (Cost of Capital Rate)
Reducing Days in A/R from 50 to 32 for a $300M health system = 18 days × $822,000 daily revenue = $14.8 million in accelerated cash. At a 5% cost of capital, that represents $740,000 in annual interest savings alone—plus the operational benefits of having cash available for investment.
Implementation Timeline
2–4 months. AI claim scrubbing typically integrates with existing practice management systems via HL7/FHIR interfaces. Most organizations see measurable improvement within 60 days of go-live.
Key vendors: Experian Health, Change Healthcare (Optum), Waystar, Olive AI
Lever 3: Reduce Staff Costs Through Intelligent Automation
Current State
Revenue cycle management is one of the most labor-intensive functions in healthcare. The typical health system employs 12–15 billing FTEs per $10 million in net revenue. Staff spend 60–80% of their time on routine, repetitive tasks: eligibility verification, claim status inquiries, payment posting, and simple denial follow-ups. With billing staff salaries averaging $45,000–$65,000 and turnover rates above 30% in many markets, labor costs consume the majority of billing department budgets.
AI-Enabled State
AI and robotic process automation (RPA) handle routine tasks end-to-end, freeing staff to focus on complex denials, underpayment appeals, and patient financial counseling—work that actually requires human judgment. According to McKinsey, agentic AI is driving toward a “touchless revenue cycle” where 60–80% of routine transactions require zero human intervention. This does not mean eliminating staff—it means redeploying them to exception handling and high-value recovery work where they generate 3–5x more revenue per hour.
Margin Impact Formula
Labor Savings = (Routine Tasks Automated %) × Total Billing FTEs × Average Fully-Loaded Cost × Productivity Multiplier
Automating 70% of routine tasks across a 50-person billing team: 35 FTEs worth of routine work eliminated. Redeploy 20 staff to high-value recovery (generating additional collections), reduce team by 15 through attrition = $825,000–$975,000 in annual labor savings plus incremental revenue from redeployed staff.
Implementation Timeline
4–8 months for a phased rollout. Start with eligibility verification and claim status automation (highest volume, lowest complexity), then expand to payment posting, simple denials, and patient communications.
Key vendors: Automation Anywhere, UiPath, Olive AI (now part of Waystar), Notable Health
Lever 4: Catch Underpayments With AI Contract Variance Detection
Current State
Healthcare underpayments are among the most insidious margin killers because they are invisible. According to the Medical Group Management Association (MGMA), underpayments account for 3–5% of annual net revenue losses for the average provider. For mid-sized health systems, that translates to $1–3 million per year in revenue that was earned but never collected. Most organizations lack the tools to compare every remittance against contracted rates at the procedure-code level, so underpayments go undetected until it is too late to appeal.
AI-Enabled State
AI-powered contract management platforms ingest every payer contract, model expected reimbursement at the CPT/DRG level, and automatically flag variances when payment arrives below the contracted rate. These systems compare each remittance at the procedure or diagnosis code level against the payer's exact fee schedule. In 2022 alone, Ensemble Health Partners recovered more than $200 million in underpayments for clients, with 70% identified beyond the standard variance report. An orthopedics MSO identified $10.3 million in underpayments using AI detection.
Margin Impact Formula
Recovery Revenue = Net Patient Revenue × Underpayment Rate × Detection Improvement % × Recovery Success Rate
For a $200M health system with 4% underpayment rate: $200M × 4% = $8M in annual underpayments. AI detection identifies 90% (vs. 30% manually) = $7.2M identified. At 65% recovery rate = $4.68 million recovered annually.
Implementation Timeline
1–3 months. Contract variance detection is one of the fastest AI wins because it works with existing remittance data. Most platforms require only a contract library upload and ERA/835 feed to begin detection.
Key vendors: MD Clarity (RevFind), Rivet Health, CareEco, Waystar
Lever 5: Prevent Timely Filing Losses With AI Status Tracking
Current State
Timely filing denials account for 10–15% of all claim denials—and they are almost entirely preventable. Each major payer has different filing deadlines (ranging from 90 days to 365 days), and tracking hundreds of thousands of claims against dozens of different deadlines using manual processes inevitably leads to missed windows. A practice submitting 500 claims per month can lose $50,000+ annually from untimely filing denials at just a 5% late rate. For large health systems, the losses scale to millions.
AI-Enabled State
AI claim lifecycle management platforms track every claim from submission through final adjudication, automatically escalating claims approaching filing deadlines. These systems use predictive models to identify claims at risk of timely filing denial weeks before the deadline, triggering automated follow-up workflows. The result: zero missed filing deadlines. AI agents can also auto-generate appeal letters when denials occur, cross-referencing denial reasons with payer-specific rules and supporting documentation.
Margin Impact Formula
Prevented Losses = Total Claims × Late Filing Rate × Average Claim Value × Recovery Rate Improvement
For a system with 600,000 annual claims and a 3% late filing rate: 18,000 claims × $285 average value = $5.13M at risk. AI reduces late filing to near-zero = $4.6–$5.1 million in prevented losses.
Implementation Timeline
2–4 months. Requires integration with clearinghouse data feeds and payer portals. Most modern platforms use API-based connections that avoid the need for manual status checking.
Key vendors: Availity, Trizetto (Cognizant), Quadax, Waystar
Lever 6: Optimize Charge Capture With AI-Powered Identification
Current State
Missed charges represent one of the largest untapped revenue opportunities in healthcare. During audits, 12–16% of hospital outpatient bills are found to be missing billable services, according to Health Catalyst research. When just 1% of revenue is lost to charge integrity issues, a mid-size hospital can see losses up to $15 million. The problem is particularly acute in procedural specialties (surgery, cardiology, orthopedics) where complex multi-component procedures frequently result in unbilled supply charges, assistant surgeon fees, or ancillary services.
AI-Enabled State
AI charge capture platforms analyze clinical documentation, operative notes, and EHR data in real time to identify services rendered but not billed. Advanced systems use computer vision in operating rooms to track implants and supplies used during procedures. Results are compelling: hospitals using AI report a 15% increase in captured revenue from previously missed charges, with charge capture accuracy improvements of 75–85%. One large health system achieved a $7.8 million revenue increase through AI-powered charge capture analytics.
Margin Impact Formula
Revenue Lift = Net Patient Revenue × Missed Charge Rate × Capture Improvement % × Average Charge Value
For a $400M health system with 3% missed charge rate: $400M × 3% = $12M in unbilled services. AI captures 70% of missed charges = $8.4 million in annual revenue lift.
Implementation Timeline
3–6 months. Charge capture optimization requires deep integration with EHR systems, CDI workflows, and often departmental workflows. Surgical charge capture (with cameras/sensors) may require 6–9 months including hardware installation.
Key vendors: SmarterDx, Infinx, Health Catalyst, R1 RCM
Lever 7: Improve Patient Collections With AI Payment Propensity
Current State
Patient responsibility now accounts for 25–35% of total revenue for many healthcare organizations, driven by the growth of high-deductible health plans. Yet patient collection rates remain stubbornly low—most organizations collect only 30–40% of patient balances after insurance. Traditional approaches (paper statements, generic collection calls, one-size-fits-all payment plans) fail to account for individual patients' financial situations, communication preferences, and payment propensity.
AI-Enabled State
AI payment propensity models analyze demographic data, payment history, insurance coverage, and behavioral signals to predict each patient's likelihood to pay and optimal engagement channel. Patients with high propensity receive digital-first outreach (text, email, portal). Patients with low propensity are routed to financial counseling and assistance programs. Payment plan amounts are calibrated to each patient's ability to pay, maximizing collection rates while reducing bad debt. Organizations using AI-driven patient engagement report 10–25% improvements in patient collection yield and 30–40% reductions in collection costs.
Margin Impact Formula
Collection Improvement = Patient A/R Balance × Collection Rate Increase % × (1 − Collection Cost Reduction %)
For a system with $30M in annual patient balances and 35% current collection rate: Improving to 45% = $3M in additional collections. With 35% lower collection costs = $3.65 million net improvement.
Implementation Timeline
2–4 months. Patient engagement platforms typically require integration with the patient accounting system, EHR demographics, and payment processing. Most offer SaaS deployment with rapid configuration.
Key vendors: Cedar, Waystar (PatientSimple), Collectly, VisitPay
The CFO Dashboard: 10 KPIs to Track AI Billing Performance
Deploying AI without rigorous measurement is organizational malpractice. Every CFO needs a real-time dashboard tracking these 10 KPIs across the AI-enabled revenue cycle:
Financial Performance KPIs
- Cost-to-Collect Ratio — Target: <2% of net revenue. Measure monthly. This is your north star metric—it captures the efficiency of the entire billing operation in a single number.
- Net Collection Rate — Target: >98%. The percentage of allowable charges actually collected. AI should push this above 98% by reducing denials, catching underpayments, and improving patient collections.
- Days in Accounts Receivable — Target: <32 days. Every day of reduction represents significant working capital improvement. Track separately for commercial, Medicare, Medicaid, and self-pay.
- AI ROI Ratio — Target: >3:1 by Year 2. Total measurable financial impact divided by total AI investment (software, implementation, training, maintenance). Should exceed 3:1 within 18–24 months.
Operational Efficiency KPIs
- First-Pass Clean Claim Rate — Target: >96%. The percentage of claims accepted on first submission without rejection or denial. AI claim scrubbing should push this above 96%.
- Denial Rate — Target: <4%. Track total denial rate and denial rate by category (clinical, technical, authorization). AI should have the greatest impact on technical and coding-related denials.
- Timely Filing Compliance — Target: 99.9%+. With AI tracking, there is no acceptable excuse for missing a filing deadline. This should approach 100%.
Revenue Recovery KPIs
- Underpayment Detection Rate — Target: >90% of contract variances detected. Measure the percentage of underpayments identified compared to total estimated underpayments (validated through periodic deep audits).
- Charge Capture Rate — Target: >97%. The percentage of billable services that are successfully captured and billed. AI-powered charge capture should push this above 97%.
- Patient Collection Yield — Target: >42%. The percentage of patient responsibility balances actually collected within 120 days. AI propensity models should improve yield while reducing cost per dollar collected.
The AI Billing Vendor Landscape
Choosing the right AI vendors is a strategic decision that impacts years of operational performance. The landscape is rapidly evolving, with both established RCM platforms adding AI capabilities and pure-play AI startups disrupting specific margin levers.
Vendor Selection Framework for CFOs
When evaluating AI billing vendors, prioritize these criteria:
- Payer coverage breadth — Does the AI model cover your top 10 payers? Regional payers? Medicaid managed care?
- Integration depth — Native EHR integration vs. API-based vs. manual interfaces. Native integration reduces implementation time by 40–60%.
- Transparency and explainability — Can the AI explain why it made a specific coding decision or flagged a claim? This is critical for compliance and auditor defensibility.
- Performance guarantees — Leading vendors offer contractual performance guarantees (e.g., minimum denial rate reduction, guaranteed clean claim rate improvement).
- Scalability model — Per-claim pricing vs. per-provider vs. enterprise licensing. Align the cost model with your volume trajectory.
- HIPAA and security posture — SOC 2 Type II certification, BAA execution, data residency controls, and encryption standards are non-negotiable.
Building the 3-Year ROI Projection
Every CFO needs a defensible financial model to present to the board. Here is a framework for building your AI billing ROI projection, validated against real-world implementation data.
Year 1: Foundation and Quick Wins (Months 1–12)
| Investment Category | Estimated Cost |
|---|---|
| AI platform licensing (2–3 solutions) | $150,000–$300,000 |
| Implementation and integration | $75,000–$150,000 |
| Training and change management | $25,000–$50,000 |
| Total Year 1 Investment | $250,000–$500,000 |
| Expected Returns — Year 1 | Estimated Value |
|---|---|
| Underpayment recovery (fastest win) | $500,000–$1,500,000 |
| Denial rate reduction | $200,000–$800,000 |
| Accelerated cash flow (interest savings) | $100,000–$300,000 |
| Total Year 1 Returns | $800,000–$2,600,000 |
Year 1 ROI: 160–520% (most organizations achieve break-even within 6–9 months).
Year 2: Expansion and Optimization (Months 13–24)
Year 2 focuses on expanding AI coverage and optimizing initial deployments. Additional AI modules (charge capture, patient collections, workforce automation) come online. Staff redeployment savings begin materializing as automation matures. Expected incremental savings: $800,000–$1,500,000 beyond Year 1 levels.
Year 3: Full Maturity (Months 25–36)
By Year 3, all seven margin levers are AI-enabled. The organization operates at best-practice benchmarks. Cumulative savings reach $2,000,000–$3,200,000 annually. The AI ROI ratio exceeds 3:1, and the margin improvement is sustainable and compounding as AI models continue learning from your data.
According to industry research, most health systems can expect 200–400% return on investment within 3–5 years of AI implementation, with McKinsey projecting AI could increase healthcare productivity by 1.8–3.2% annually, equivalent to $150–260 billion per year across the U.S. healthcare system.
Implementation Roadmap: Where to Start
Not all margin levers are created equal. The optimal sequencing depends on your organization's specific pain points, but this framework applies to most health systems:
Phase 1 (Months 1–3): Immediate Revenue Recovery
- Deploy AI underpayment detection (fastest ROI, lowest integration complexity)
- Implement AI claim scrubbing (immediate clean claim rate improvement)
- Activate AI timely filing tracking (prevent ongoing losses)
Phase 2 (Months 3–6): Coding and Denial Reduction
- Deploy AI coding assistance (parallel mode with human oversight)
- Implement AI denial prediction and prevention
- Begin measuring KPI baselines for all 10 dashboard metrics
Phase 3 (Months 6–12): Workforce Optimization and Patient Collections
- Roll out RPA for routine tasks (eligibility, status inquiries, payment posting)
- Deploy AI charge capture (requires deeper clinical workflow integration)
- Implement AI patient payment propensity models
Phase 4 (Months 12–18): Continuous Optimization
- Transition to AI-primary coding workflows
- Expand automation to complex denial management
- Implement predictive analytics for payer negotiation leverage
- Begin using AI-generated insights for contract renegotiation
Risk Mitigation: What CFOs Must Watch For
AI implementation is not without risk. Smart CFOs plan for these challenges:
- Compliance risk — Ensure AI coding decisions are auditable and explainable. The OIG and CMS are increasing scrutiny of AI-assisted coding. Maintain human oversight on high-value and complex claims.
- Integration failure — The #1 cause of AI project failure in healthcare is poor EHR integration. Require vendors to demonstrate live integrations with your specific EHR platform before signing.
- Change management resistance — Billing staff may resist AI adoption if they perceive it as a job threat. Frame AI as augmentation (handling the tedious work) rather than replacement. Highlight the career growth opportunity in exception handling and complex recovery.
- Vendor lock-in — Avoid long-term contracts until you have validated ROI through a pilot period. Negotiate 12-month initial terms with performance-based renewal provisions.
- Data quality dependency — AI is only as good as the data it processes. Invest in data normalization and cleansing before deploying AI models. Garbage in, garbage out applies doubly to AI.
The Bottom Line: A CFO's AI Billing Mandate
The math is straightforward. A mid-sized health system generating $300–$500 million in annual revenue can expect:
- $2–$5 million in annual margin improvement across all seven levers
- 30–60% reduction in cost-to-collect
- 200–400% ROI within 3 years
- 15–20 day reduction in Days in A/R, unlocking millions in working capital
The question for healthcare CFOs is no longer whether to invest in AI for billing operations. It is how quickly you can deploy it and how strategically you sequence the margin levers to maximize near-term ROI while building toward long-term operational excellence.
The organizations that move first will compound their advantage. Every month of delay is a month of preventable margin leakage.
Related reading: