Your AI agent passed the demo. Leadership is excited. The compliance officer wants to see it in production. And then someone asks the question that separates pilot projects from production deployments: "How do we know it's not hallucinating?"
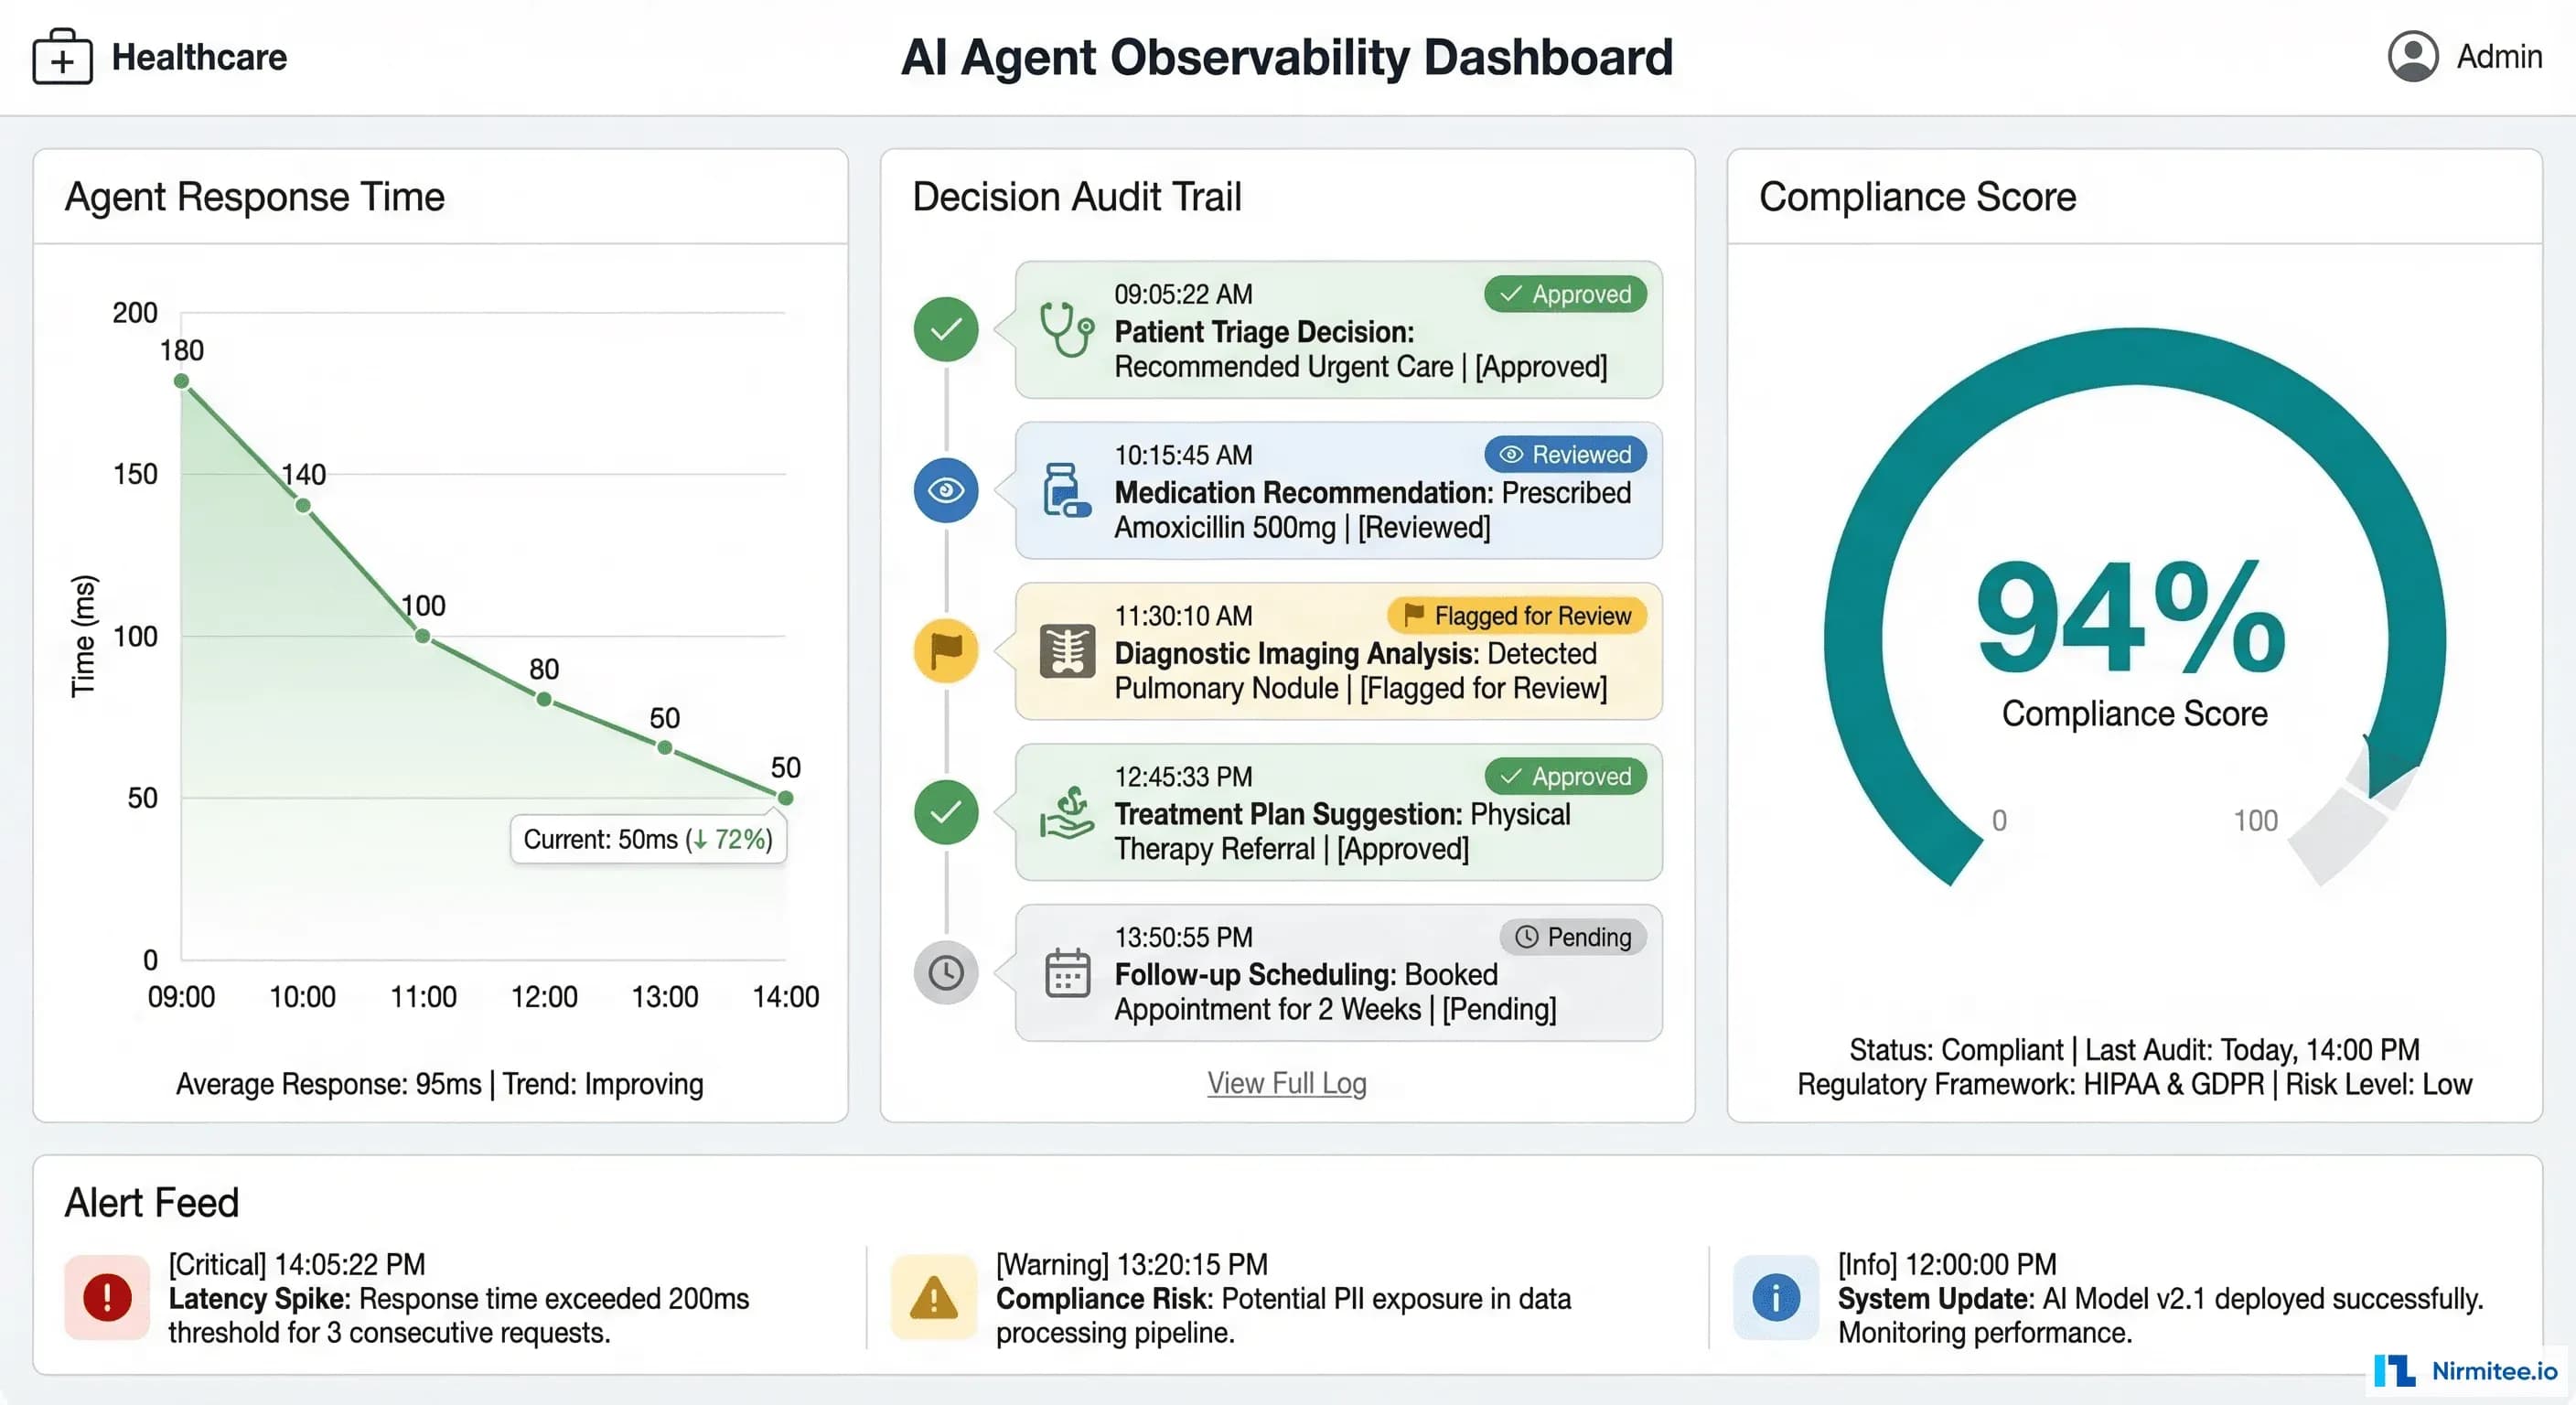
Standard application performance monitoring tools like Datadog, New Relic, and Dynatrace are excellent at what they were built for: tracking HTTP latency, error rates, throughput, and infrastructure health. But healthcare AI agents introduce failure modes that these tools were never designed to detect. An agent can return a 200 OK response in under two seconds while confidently recommending a drug interaction that could harm a patient. Your APM dashboard will show green across the board.
This guide covers the observability infrastructure you need before a healthcare AI agent goes live — the specific logging schemas, hallucination detection pipelines, alerting thresholds, and compliance dashboards that give your DevOps team operational confidence and your compliance officer an audit trail that satisfies OCR investigators.
Why Standard APM Falls Short for Healthcare AI
Traditional APM monitors three things well: latency, errors, and throughput. For a REST API serving static business logic, that is sufficient. For an AI agent that retrieves clinical data, reasons over it with a large language model, and generates natural language responses, you need to monitor at least five additional dimensions:
- PHI access logging — Every FHIR resource the agent reads must be recorded with the patient identifier, resource type, timestamp, and the authorization scope that permitted access. HIPAA's minimum necessary standard means you must demonstrate the agent only accessed data it needed.
- Clinical accuracy tracking — When a human reviewer corrects an agent's output, that correction must be logged, categorized, and fed back into accuracy metrics. A 6% correction rate on Tuesday that climbs to 12% by Thursday is an operational signal your APM tool will never surface.
- Hallucination detection — The agent may generate statements not supported by any retrieved clinical data. Detecting this requires comparing output claims against source documents in real time — a capability that exists nowhere in traditional monitoring stacks.
- Cost per interaction — Each agent invocation may trigger multiple LLM calls, each with different token counts and pricing tiers. Without per-interaction cost tracking, a sudden shift in query complexity can blow through your monthly budget in days.
- Regulatory audit trail — An OCR investigator does not want to see Datadog dashboards. They want structured logs showing exactly what PHI was accessed, what the agent did with it, what output was generated, and whether a human reviewed that output. This requires purpose-built logging, not APM metrics.
The Comprehensive Logging Schema
Before you instrument anything, define what you are logging. Healthcare AI agent observability requires five distinct log categories, each with specific fields that serve both operational and compliance purposes.
1. FHIR Resource Access Logs
Every interaction between the agent and the FHIR server must be recorded. This is not optional — it is the foundation of your HIPAA audit trail.
{
  "event_type": "fhir_access",
  "timestamp": "2026-03-16T14:23:01.847Z",
  "trace_id": "abc123def456",
  "resource_type": "MedicationRequest",
  "patient_id_hash": "sha256:a1b2c3d4...",
  "fhir_id": "MedicationRequest/mr-789",
  "access_scope": "patient/MedicationRequest.read",
  "agent_session_id": "session-456",
  "requesting_practitioner": "practitioner-dr-smith",
  "access_justification": "patient_query_medications"
}
Note the patient_id_hash field. Store a SHA-256 hash of the patient ID in your observability pipeline, not the raw identifier. This lets you correlate access patterns and run analytics without exposing PHI in your logging infrastructure. The raw mapping stays in the EHR system behind existing access controls.
2. LLM Call Logs
Every call to a language model must be logged with token counts, latency, cost, and the model version. This serves three purposes: cost management, latency optimization, and reproducibility during incident investigation.
{
  "event_type": "llm_call",
  "timestamp": "2026-03-16T14:23:02.100Z",
  "trace_id": "abc123def456",
  "model": "gpt-4o-2026-02",
  "tokens_in": 3847,
  "tokens_out": 412,
  "latency_ms": 1823,
  "cost_usd": 0.0287,
  "temperature": 0.1,
  "system_prompt_version": "v2.4.1",
  "phi_in_context": true,
  "phi_categories_in_context": ["medications", "conditions", "demographics"]
}
3. Tool Call Logs
When the agent invokes external tools — drug interaction checkers, clinical decision support APIs, terminology services — each call must be logged with its arguments, results, and latency.
{
  "event_type": "tool_call",
  "timestamp": "2026-03-16T14:23:03.950Z",
  "trace_id": "abc123def456",
  "tool_name": "rxnorm_interaction_check",
  "arguments": {"drug_a": "metformin", "drug_b": "lisinopril"},
  "result_summary": "no_interaction_found",
  "result_confidence": 0.98,
  "latency_ms": 387,
  "source_api": "NIH RxNorm REST API v1.2"
}
4. Agent Decision Logs
The agent's final output, along with its confidence score and human review status, must be logged. This is the record your compliance officer will reference most frequently.
{
  "event_type": "agent_decision",
  "timestamp": "2026-03-16T14:23:04.200Z",
  "trace_id": "abc123def456",
  "input_hash": "sha256:e5f6g7h8...",
  "output_hash": "sha256:i9j0k1l2...",
  "confidence_score": 0.92,
  "review_status": "pending_human_review",
  "output_category": "medication_summary",
  "sources_cited": 4,
  "hallucination_check_result": "pass"
}
5. PHI Handling Event Logs
This is the log category that does not exist in any standard APM tool. Track exactly what PHI entered the agent's context window and what PHI appeared in the output.
{
  "event_type": "phi_handling",
  "timestamp": "2026-03-16T14:23:04.300Z",
  "trace_id": "abc123def456",
  "phi_types_in_context": ["patient_name", "dob", "mrn", "medications"],
  "phi_types_in_output": ["medications"],
  "output_contains_raw_phi": false,
  "phi_masking_applied": true,
  "masking_method": "regex_plus_ner",
  "masking_confidence": 0.99
}
Hallucination Detection in Production
Hallucination detection is the single most important observability capability for healthcare AI agents. A hallucinated drug name or fabricated lab value is not a UX issue — it is a patient safety event. Here is how to implement detection in production without adding unacceptable latency.
Step 1: Claim Extraction
Parse the agent's output into individual factual claims. For a response like "The patient is currently taking metformin 500mg twice daily and lisinopril 10mg once daily," extract two claims: (1) patient takes metformin 500mg twice daily, (2) patient takes lisinopril 10mg once daily.
Use a lightweight LLM call or rule-based NLP to decompose outputs into atomic statements. This adds 100-200ms but is essential for granular verification.
Step 2: Semantic Similarity Against Source Documents
For each extracted claim, compute semantic similarity against the FHIR resources that were in the agent's context window. Use an embedding model (such as text-embedding-3-large or a locally hosted model like BGE-M3) to embed both the claim and each source passage, then compute cosine similarity.
import numpy as np
from openai import OpenAI

client = OpenAI()

def compute_similarity(claim: str, source_passages: list[str]) -> float:
    """Compute max semantic similarity between a claim and source passages."""
    all_texts = [claim] + source_passages
    response = client.embeddings.create(
        model="text-embedding-3-large",
        input=all_texts
    )
    embeddings = [np.array(e.embedding) for e in response.data]
    claim_emb = embeddings[0]

    max_similarity = 0.0
    for source_emb in embeddings[1:]:
        similarity = np.dot(claim_emb, source_emb) / (
            np.linalg.norm(claim_emb) * np.linalg.norm(source_emb)
        )
        max_similarity = max(max_similarity, similarity)

    return max_similarity
Set your similarity threshold based on empirical testing with your specific agent and data. A starting point: claims with similarity below 0.75 are flagged for review; claims below 0.55 are blocked.
Step 3: Natural Language Inference (NLI) for Entailment Checking
Semantic similarity catches many hallucinations but misses subtle ones — an agent might say "no known drug interactions" when the source documents simply do not mention interactions (absence of evidence is not evidence of absence). NLI models classify whether a premise (the source document) entails, is neutral toward, or contradicts a hypothesis (the agent's claim).
from transformers import pipeline

nli_model = pipeline(
    "text-classification",
    model="cross-encoder/nli-deberta-v3-large",
    device=0  # GPU
)

def check_entailment(source_text: str, claim: str) -> dict:
    """Check if source text entails the claim."""
    result = nli_model(
        f"{source_text} [SEP] {claim}",
        top_k=None
    )
    scores = {r["label"]: r["score"] for r in result}
    return {
        "entailment": scores.get("ENTAILMENT", 0),
        "neutral": scores.get("NEUTRAL", 0),
        "contradiction": scores.get("CONTRADICTION", 0),
        "decision": "pass" if scores.get("ENTAILMENT", 0) > 0.7
                    else "flag" if scores.get("NEUTRAL", 0) > 0.5
                    else "block"
    }
For production deployment, run the NLI model on GPU with batched inference. Latency per claim is typically 15-40ms on an A10G, making it feasible to check all claims before returning the response to the user. For cost-sensitive deployments, run NLI asynchronously and flag outputs retroactively.
Key Metrics and Alerting Rules
Define your alerting thresholds before deployment, not after an incident. These five metrics cover the operational and compliance dimensions unique to healthcare AI agents.
1. Accuracy: Human Correction Rate
Metric: corrections / total_reviewed_outputs over a rolling 24-hour window.
Threshold: WARNING at 10%, CRITICAL at 15%.
Action: WARNING triggers investigation by the clinical informatics team. CRITICAL pauses the agent and routes all queries to human responders until root cause is identified.
2. Latency: p50 and p99 Response Times
Metric: End-to-end agent response time measured from request receipt to response delivery.
Threshold: p50 above 3 seconds or p99 above 10 seconds sustained for 15 minutes.
Action: Alert the on-call SRE. Common causes: LLM provider degradation, FHIR server slow queries, or embedding model queue buildup.
3. Cost: Daily Spend Trending
Metric: Cumulative daily cost across all LLM calls, embedding computations, and tool invocations.
Threshold: WARNING when daily cost exceeds 120% of the daily budget. CRITICAL at 150%.
Action: WARNING notifies engineering leads. CRITICAL applies rate limiting to non-urgent agent interactions while maintaining emergency access.
4. Hallucination Rate
Metric: flagged_outputs / total_outputs over a rolling 1-hour window.
Threshold: WARNING at 3%, CRITICAL at 5%.
Action: CRITICAL automatically pauses agent-generated responses and routes to human review. This is a non-negotiable circuit breaker — if 1 in 20 outputs contains unsupported claims, the agent must stop serving responses autonomously.
5. PHI Exposure
Metric: Detection of unmasked PHI in agent output that was not in the approved output context.
Threshold: Any single occurrence is CRITICAL.
Action: Immediate alert to the compliance officer and the privacy officer. Log the full interaction for incident review. If the exposure is confirmed, initiate the organization's breach notification assessment process per 45 CFR 164.402.
The Compliance Dashboard
Your compliance officer does not need Grafana access. They need a daily summary that answers five questions: What did the agent do today? Whose data did it access? How accurate was it? Were there any incidents? What is pending human review?
Panel 1: Daily Summary
Active agents, total interactions processed, interactions that received human review, and the percentage of interactions that were auto-approved versus manually reviewed. This gives the compliance officer a volume baseline — if interactions suddenly spike 300%, they need to know.
Panel 2: PHI Access Report
The number of unique patients whose data was accessed, broken down by FHIR resource type. This maps directly to HIPAA's minimum necessary requirement. If the agent accessed AllergyIntolerance records for 400 patients but only 50 queries mentioned allergies, that discrepancy needs investigation.
Panel 3: Accuracy Trends
Human correction rate over the past 7, 14, and 30 days with trend lines. The compliance officer needs to see that accuracy is stable or improving, not degrading. Include the breakdown by output category — medication summaries might be 98% accurate while care plan suggestions are only 88%.
Panel 4: Incident Log
Every CRITICAL alert triggered in the past 24 hours with timestamps, descriptions, and resolution status. This is the section OCR investigators review first during a compliance audit.
Panel 5: Human Review Queue
Outputs currently flagged for human review, how long they have been pending, and who is assigned to review them. If flagged outputs are sitting unreviewed for more than 4 hours, that itself becomes a compliance concern.
Implementation: OpenTelemetry, Structured Logging, and Grafana
The implementation stack uses three components: OpenTelemetry for distributed tracing across agent tool calls, structured JSON logging to ELK or Splunk for the audit trail, and Prometheus plus Grafana for metrics and dashboards.
OpenTelemetry Tracing Configuration
Instrument the agent to create spans for each step in the processing pipeline. The trace below shows a single patient interaction broken into its component operations — this is what your SRE team uses to diagnose latency issues and your compliance team uses to understand the agent's decision chain.
from opentelemetry import trace
from opentelemetry.sdk.trace import TracerProvider
from opentelemetry.sdk.trace.export import BatchSpanProcessor
from opentelemetry.exporter.otlp.proto.grpc.trace_exporter import OTLPSpanExporter
from opentelemetry.sdk.resources import Resource
import json, time, hashlib

# Initialize tracer
resource = Resource.create({"service.name": "healthcare-ai-agent"})
provider = TracerProvider(resource=resource)
provider.add_span_processor(
    BatchSpanProcessor(OTLPSpanExporter(endpoint="http://otel-collector:4317"))
)
trace.set_tracer_provider(provider)
tracer = trace.get_tracer("healthcare.ai.agent")


class HealthcareAgentObservability:
    """Middleware wrapping LangChain agent execution with comprehensive logging."""

    def __init__(self, agent, logger, metrics):
        self.agent = agent
        self.logger = logger  # structlog or python-json-logger
        self.metrics = metrics  # prometheus_client metrics

    def invoke(self, query: str, patient_id: str, session_id: str):
        patient_hash = hashlib.sha256(patient_id.encode()).hexdigest()[:16]

        with tracer.start_as_current_span("patient_interaction") as root_span:
            root_span.set_attribute("patient_id_hash", patient_hash)
            root_span.set_attribute("session_id", session_id)
            start_time = time.time()

            # Track FHIR access
            original_fhir_read = self.agent.fhir_client.read
            fhir_access_log = []

            def instrumented_fhir_read(resource_type, resource_id):
                with tracer.start_as_current_span(f"fhir_read_{resource_type}") as span:
                    span.set_attribute("resource_type", resource_type)
                    span.set_attribute("patient_id_hash", patient_hash)
                    result = original_fhir_read(resource_type, resource_id)
                    fhir_access_log.append({
                        "event_type": "fhir_access",
                        "resource_type": resource_type,
                        "patient_id_hash": patient_hash,
                        "timestamp": time.time()
                    })
                    self.metrics.fhir_access_total.labels(
                        resource_type=resource_type
                    ).inc()
                    return result

            self.agent.fhir_client.read = instrumented_fhir_read

            # Execute agent with LLM call tracking
            with tracer.start_as_current_span("llm_reasoning") as llm_span:
                result = self.agent.run(query)
                llm_span.set_attribute("model", self.agent.model_name)
                llm_span.set_attribute("tokens_in", result.usage.prompt_tokens)
                llm_span.set_attribute("tokens_out", result.usage.completion_tokens)

                cost = self._calculate_cost(result.usage)
                self.metrics.llm_cost_total.inc(cost)
                self.metrics.llm_latency.observe(result.latency_ms / 1000)

            # Hallucination check
            with tracer.start_as_current_span("hallucination_check") as hal_span:
                hal_result = self._check_hallucination(
                    result.output, result.source_documents
                )
                hal_span.set_attribute("result", hal_result["decision"])
                self.metrics.hallucination_checks_total.labels(
                    result=hal_result["decision"]
                ).inc()

            # PHI output scan
            with tracer.start_as_current_span("phi_output_scan") as phi_span:
                phi_result = self._scan_phi_in_output(result.output)
                phi_span.set_attribute("phi_detected", phi_result["contains_phi"])
                if phi_result["contains_unmasked_phi"]:
                    self.metrics.phi_exposure_total.inc()
                    self.logger.critical("phi_exposure_detected",
                        session_id=session_id,
                        phi_types=phi_result["phi_types"]
                    )

            # Log the complete interaction
            total_latency = (time.time() - start_time) * 1000
            self.logger.info("agent_interaction_complete",
                trace_id=root_span.get_span_context().trace_id,
                session_id=session_id,
                patient_id_hash=patient_hash,
                fhir_resources_accessed=len(fhir_access_log),
                hallucination_check=hal_result["decision"],
                total_latency_ms=total_latency,
                cost_usd=cost,
                review_status="pending" if hal_result["decision"] != "pass"
                             else "auto_approved"
            )

            self.metrics.interaction_latency.observe(total_latency / 1000)
            self.metrics.interactions_total.labels(
                status=hal_result["decision"]
            ).inc()

            return result
Prometheus Metrics Definition
from prometheus_client import Counter, Histogram, Gauge

# Core agent metrics
interactions_total = Counter(
    "agent_interactions_total",
    "Total agent interactions",
    ["status"]  # pass, flag, block
)
interaction_latency = Histogram(
    "agent_interaction_latency_seconds",
    "End-to-end interaction latency",
    buckets=[0.5, 1, 2, 3, 5, 10, 15, 30]
)

# LLM metrics
llm_cost_total = Counter("agent_llm_cost_usd_total", "Total LLM cost in USD")
llm_latency = Histogram(
    "agent_llm_latency_seconds",
    "LLM call latency",
    buckets=[0.5, 1, 2, 3, 5, 10]
)

# Safety metrics
hallucination_checks_total = Counter(
    "agent_hallucination_checks_total",
    "Hallucination check results",
    ["result"]  # pass, flag, block
)
phi_exposure_total = Counter(
    "agent_phi_exposure_total",
    "Unmasked PHI detected in output"
)

# FHIR access metrics
fhir_access_total = Counter(
    "agent_fhir_access_total",
    "FHIR resource accesses by type",
    ["resource_type"]
)

# Human review metrics
human_corrections_total = Counter(
    "agent_human_corrections_total",
    "Human corrections applied to agent output"
)
pending_reviews = Gauge(
    "agent_pending_reviews",
    "Outputs awaiting human review"
)
Grafana Alerting Rules
Configure these alert rules in your Grafana instance or as Prometheus alerting rules:
# prometheus-alerts.yml
groups:
  - name: healthcare_ai_agent
    interval: 30s
    rules:
      - alert: AgentAccuracyDrop
        expr: |
          rate(agent_human_corrections_total[24h])
          / rate(agent_interactions_total{status="pass"}[24h])
          > 0.10
        for: 15m
        labels:
          severity: warning
          team: clinical-informatics
        annotations:
          summary: "Agent correction rate exceeds 10%"

      - alert: AgentHallucinationSpike
        expr: |
          rate(agent_hallucination_checks_total{result=~"flag|block"}[1h])
          / rate(agent_hallucination_checks_total[1h])
          > 0.05
        for: 5m
        labels:
          severity: critical
          team: sre
        annotations:
          summary: "Hallucination rate exceeds 5% -- agent auto-paused"
          runbook: "https://wiki.internal/runbooks/agent-hallucination"

      - alert: AgentPHIExposure
        expr: agent_phi_exposure_total > 0
        for: 0m
        labels:
          severity: critical
          team: compliance
        annotations:
          summary: "Unmasked PHI detected in agent output"

      - alert: AgentHighLatency
        expr: histogram_quantile(0.99, agent_interaction_latency_seconds) > 10
        for: 15m
        labels:
          severity: warning
          team: sre

      - alert: AgentCostOverrun
        expr: |
          increase(agent_llm_cost_usd_total[24h])
          > 1.2 * avg_over_time(increase(agent_llm_cost_usd_total[24h])[7d:1d])
        for: 30m
        labels:
          severity: warning
          team: engineering
Bringing It Together: The Pre-Go-Live Checklist
Before any healthcare AI agent goes live, verify that every item on this checklist is in place:
- Logging pipeline operational — All five log categories (FHIR access, LLM calls, tool calls, agent decisions, PHI handling) are flowing to your log store and are queryable.
- Hallucination detection active — Both semantic similarity and NLI entailment checks are running, with thresholds calibrated against at least 500 labeled examples from your clinical domain.
- Alert rules configured — All five alert rules (accuracy, latency, cost, hallucination, PHI exposure) are active with confirmed notification routing to the correct teams.
- Compliance dashboard accessible — Your compliance officer can view the daily summary without requesting engineering support. The dashboard refreshes automatically and is bookmarked in their browser.
- Human review workflow connected — Flagged outputs route to qualified reviewers, review decisions feed back into accuracy metrics, and pending review age is monitored.
- Incident response documented — Runbooks exist for each CRITICAL alert, including who to contact, what to investigate first, and how to pause or roll back the agent.
- Retention policies set — Agent interaction logs are retained for the period required by your organization's HIPAA retention policy (typically 6 years) and are immutable once written.
Healthcare AI agents have the potential to significantly improve clinical workflows, reduce administrative burden, and surface insights that improve patient outcomes. But that potential is only realized when the operational infrastructure matches the sophistication of the AI itself. The observability stack described in this guide is not overhead — it is the foundation that makes safe deployment possible.
At Nirmitee, we build healthcare software with compliance and observability designed in from day one — not bolted on after the fact. If you are planning a healthcare AI deployment and want to get the operational infrastructure right before go-live, reach out to our team.
From architecture to production, our Healthcare Software Product Development team builds healthcare platforms that perform at scale. We also offer specialized Agentic AI for Healthcare services. Talk to our team to get started.
Frequently Asked QuestionsHow much latency does hallucination detection add to agent responses?
Embedding-based semantic similarity adds 50-150ms depending on the number of source passages. NLI entailment checking adds 15-40ms per claim on GPU. For a typical agent response with 3-5 claims, total hallucination detection overhead is 200-500ms — acceptable for most clinical use cases where accuracy outweighs sub-second response requirements.
Can we use existing SIEM tools instead of building a custom compliance dashboard?
Partially. SIEM tools like Splunk and Elastic SIEM can ingest and query agent interaction logs. However, the compliance dashboard needs pre-built views tailored to HIPAA audit requirements, accuracy trending, and human review workflows. Most organizations build the compliance dashboard in Grafana or a custom internal tool that queries the same log store their SIEM uses.
What is a reasonable hallucination rate threshold for production healthcare AI agents?
Industry consensus is still forming, but organizations with production deployments typically target below 2% hallucination rate measured against human-labeled ground truth. The 5% CRITICAL threshold in our alerting configuration is a circuit breaker, not an acceptable operating range. Sustained operation above 3% should trigger model retraining or prompt engineering review.
How do we handle the cost of running embedding models and NLI models for every interaction?
For cost-sensitive deployments, implement a tiered approach: run lightweight checks (keyword matching, regex-based PHI detection) synchronously on every interaction, and run the full embedding plus NLI pipeline asynchronously on a sample (e.g., 20% of interactions) or only on interactions flagged by the lightweight checks. This reduces inference costs by 60-80% while maintaining detection coverage on the highest-risk outputs.