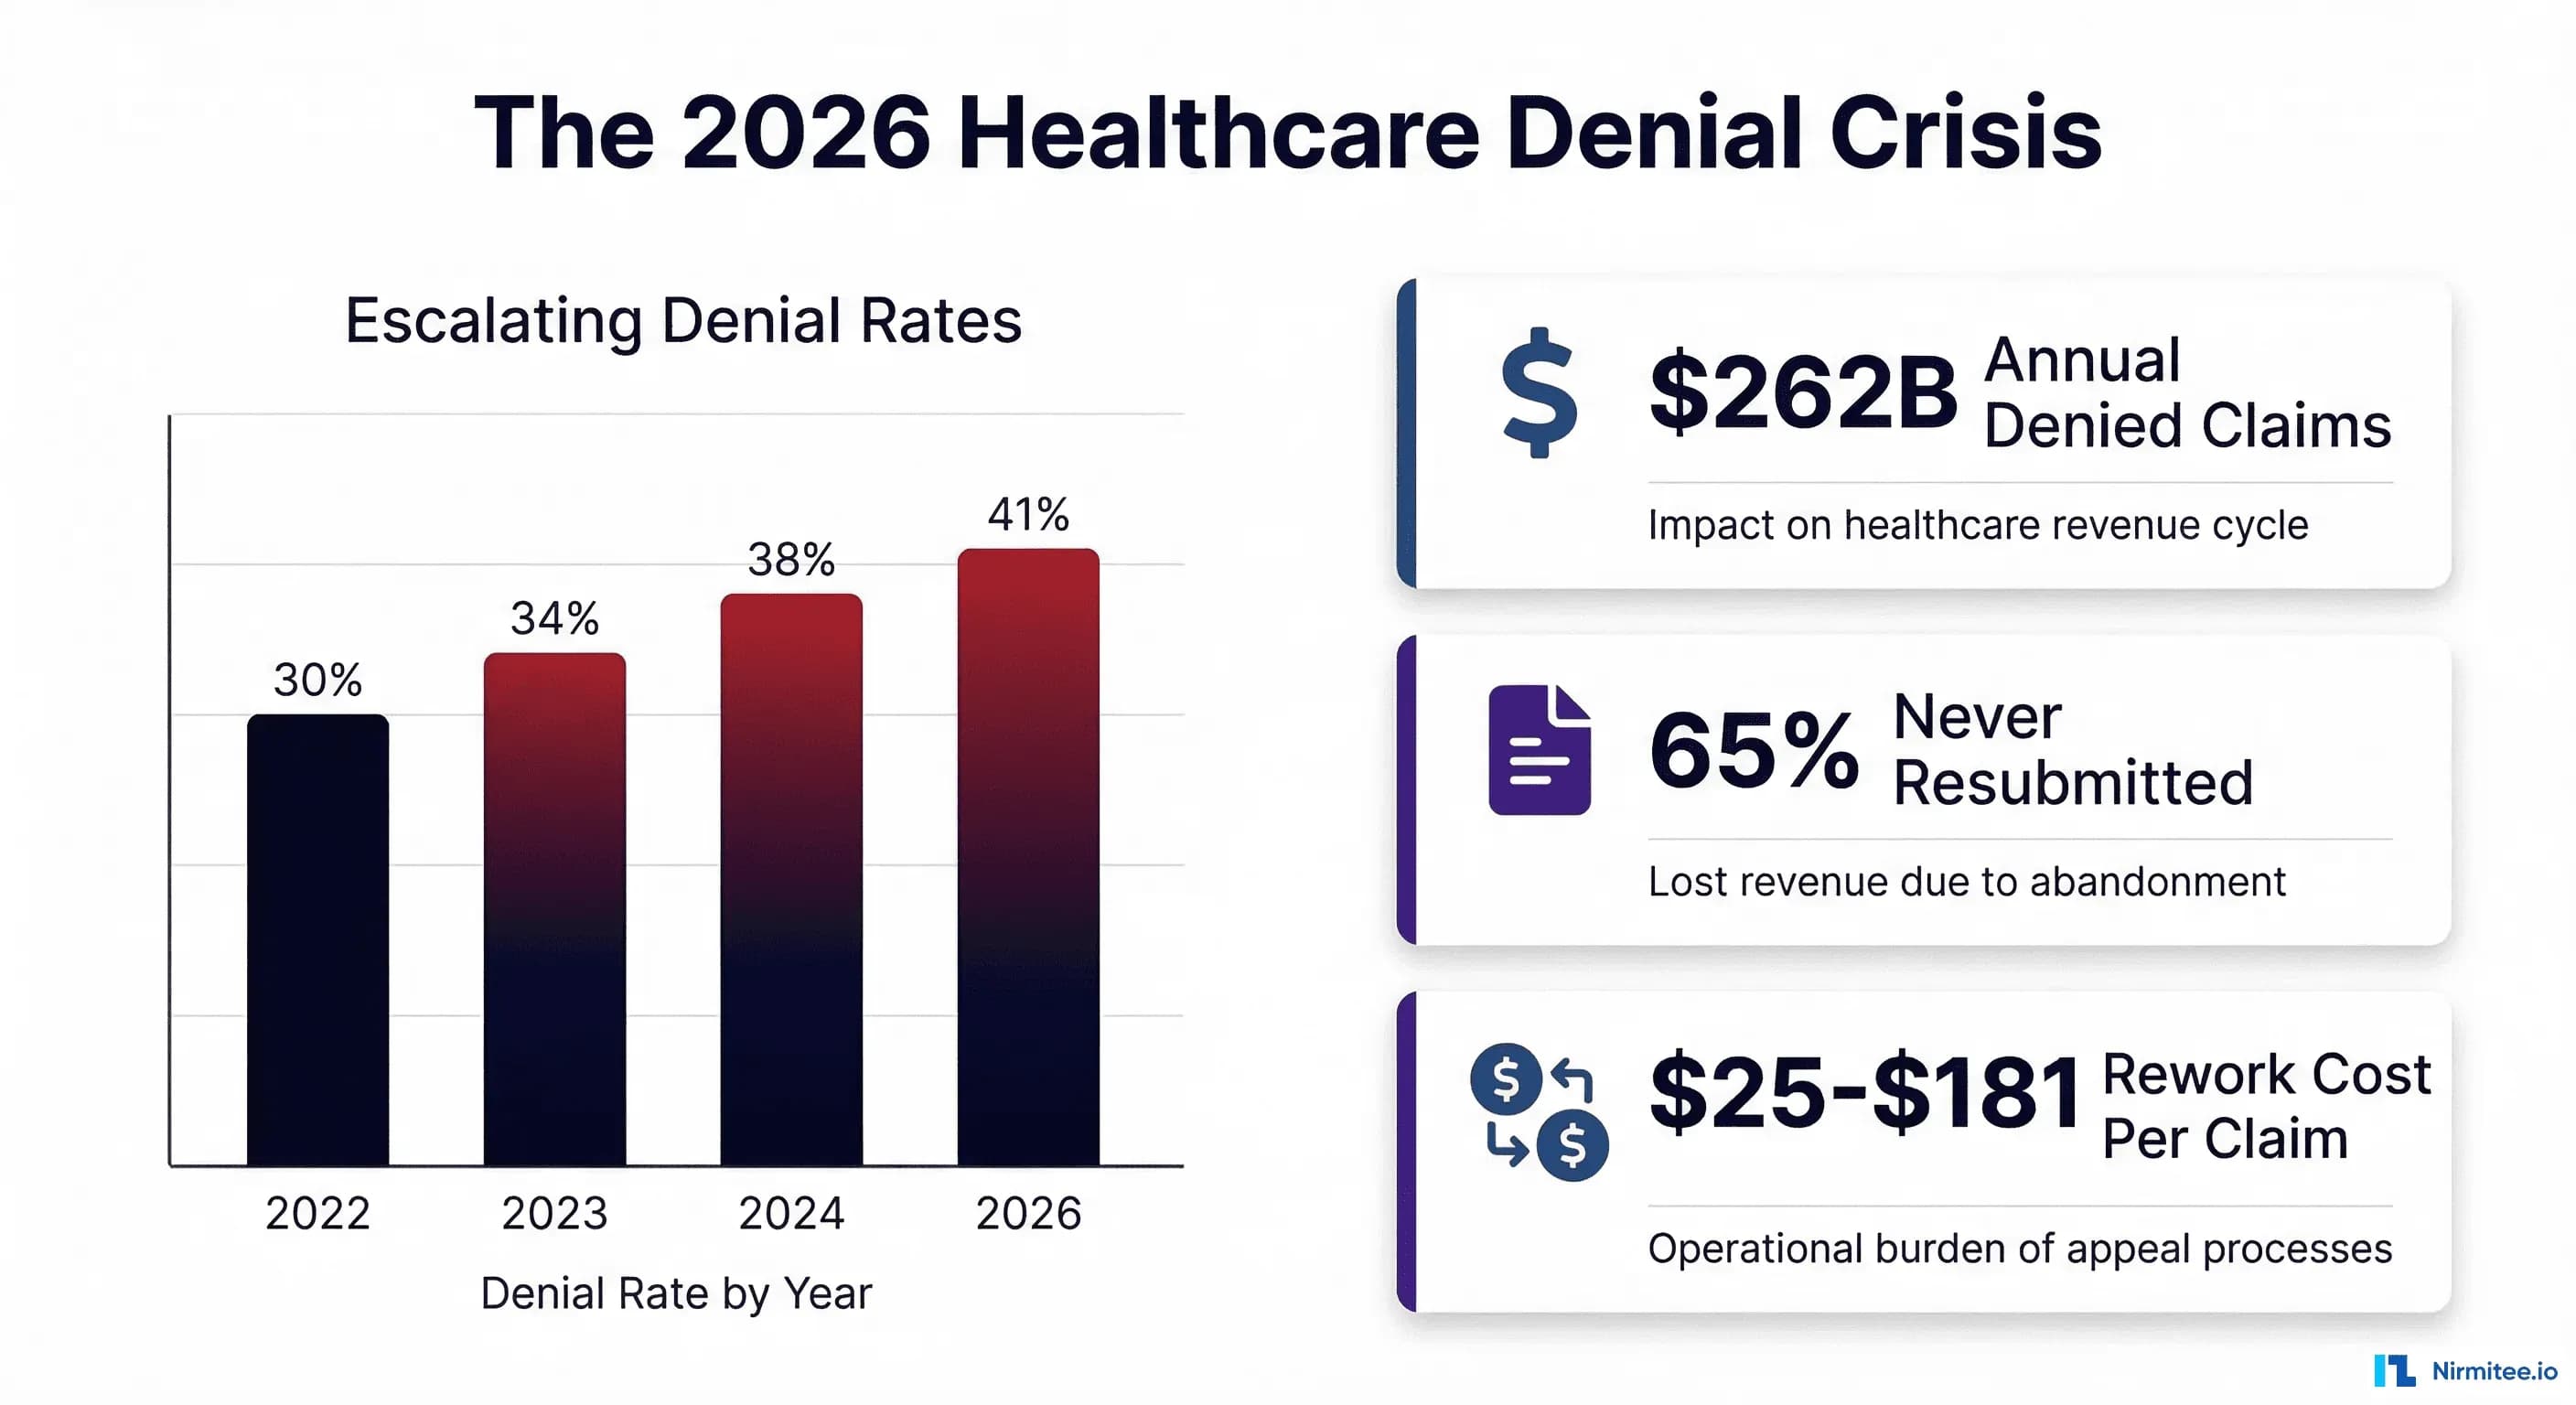
Healthcare claim denials have crossed a critical threshold. According to Experian Health's 2025 State of Claims Report, 41% of providers now report that more than 10% of their claims are denied — up from 30% in 2022 and 38% in 2024. Initial denial rates have climbed to 11.8%, and the financial hemorrhage is staggering: $262 billion in medical claims are initially denied every year, with 65% of those denials never resubmitted. That is not a billing inconvenience. That is a structural threat to health system financial viability.
For CFOs navigating 2026, the denial landscape demands more than incremental process improvement. Payer behavior is shifting, regulatory requirements are tightening under the CMS Interoperability and Prior Authorization Final Rule (CMS-0057-F), and the cost of manual denial management has become unsustainable. This guide provides the data, root cause analysis, and AI implementation playbook that CFOs need to transform denial management from a reactive cost center into a proactive revenue protection system.
If you have read our analysis of the $262 billion denial crisis and AI denial management architecture, this article extends that foundation with 2026-specific data, payer-by-payer analysis, and the CFO-level action plan for deploying AI denial prevention at scale.
The 2026 Denial Landscape: Numbers That Should Alarm Every CFO
The denial crisis is not stabilizing — it is accelerating. Three years of Experian Health's State of Claims surveys document a clear trajectory:
- 2022: 30% of providers reported denial rates exceeding 10% of submitted claims
- 2023: 34% reported denial rates above 10%
- 2024: 38% reported denial rates above 10%
- 2026: 41% report denial rates above 10%, with initial denial rates reaching 11.8%
These are not marginal shifts. A health system processing 2 million claims annually at an 11.8% denial rate generates 236,000 denied claims per year. At an average rework cost of $25 to $181 per denial (according to OS Inc. analysis), the rework expense alone ranges from $5.9 million to $42.7 million — before accounting for the revenue permanently lost on the 65% of denials that are never resubmitted.
What Is Driving the Acceleration
The Experian 2025 report identifies four primary accelerants:
- Missing or inaccurate claim data: 50% of respondents cite this as the top factor, up 4 percentage points from 2024
- Authorization complexity: Payers are expanding prior authorization requirements to new service categories, creating more opportunities for authorization-related denials
- Incomplete or incorrect patient registration data: Insurance churn from marketplace plan renewals and employer plan changes creates persistent eligibility gaps
- Code inaccuracy: Annual CPT and ICD-10 updates, combined with increasing payer-specific coding requirements, generate coding-related denials at scale
Critically, the AJMC analysis notes that while 67% of providers believe AI can improve the claims process, only 14% have implemented AI tools. The gap between awareness and action is where the opportunity lies for organizations willing to move now.
Top 10 Denial Reasons with CARC Codes: The Root Cause Taxonomy
Effective denial management begins with understanding exactly why claims are denied, using the standardized Claim Adjustment Reason Codes (CARCs) defined under the ANSI X12 835 standard. Every denied claim carries a CARC that classifies the reason for adjustment. The following 10 codes account for the majority of denials across all specialties and payer types. For a deeper dive into decision-tree-based root cause analysis using CARC and RARC code mapping, see our guide on healthcare denial root cause analysis with AI pattern detection.
1. CO-4 — Procedure Code Inconsistent with Modifier or Missing Modifier
CO-4 denials occur when the procedure code submitted does not align with the modifier used, or when a required modifier is absent. This is one of the most common coding-related denials and frequently affects surgical procedures, evaluation and management (E/M) services billed on the same day as procedures (modifier -25), and distinct procedural services (modifier -59). The root fix is pre-submission claim scrubbing that validates modifier requirements against the National Correct Coding Initiative (NCCI) edit tables.
2. CO-16 — Claim Lacks Information or Has Submission/Billing Errors
CO-16 is a catch-all code that indicates the claim is missing required information or contains errors that prevent adjudication. It can signal documentation gaps, missing referring provider information, incomplete diagnosis codes, or medical necessity deficiencies. Because CO-16 is ambiguous, the paired RARC code is essential for identifying the specific root cause. CO-16 paired with RARC MA-130 means medical records are needed; paired with N-386, it means authorization information is missing; paired with M-76, it indicates a missing modifier.
3. CO-18 — Duplicate Claim or Service
Duplicate denials occur when the payer determines that an identical claim has already been submitted and processed. This happens due to system integration failures, batch resubmission errors, or manual re-entry when staff are uncertain whether a claim was transmitted. Payers flag duplicates by matching patient ID, date of service, procedure code, and rendering provider NPI. Prevention requires automated duplicate detection logic in the claim scrubbing layer that checks against previously submitted claims before release.
4. CO-45 — Charge Exceeds Fee Schedule or Maximum Allowable Amount
CO-45 indicates the billed amount exceeds the contractual fee schedule or legislative maximum. While this is technically an adjustment rather than a denial of service, it directly impacts revenue when the charge-to-allowable ratio is not properly managed. This code is particularly common with out-of-network claims, non-par provider submissions, and in states with balance billing restrictions under the No Surprises Act.
5. CO-97 — Benefit Included in Payment for Another Service (Bundling)
CO-97 bundling denials occur when two or more procedure codes are billed separately but the payer determines they should be bundled under NCCI edits. This is especially prevalent with E/M codes billed alongside procedures, laboratory panels billed as individual components, and surgical procedures with included post-operative care. AI-powered claim scrubbing that runs real-time NCCI edit validation catches the majority of these before submission.
6. CO-197 — Precertification/Authorization/Notification Absent
CO-197 is the authorization denial code, applied when the payer requires prior authorization for a service and none was obtained. This is one of the highest-impact denial codes because it disproportionately affects high-cost procedures — imaging studies, specialty medications, surgical procedures, and inpatient admissions. According to the American Medical Association, physicians report growing concern that payers are using AI to expand prior authorization denials. The counter-strategy is building an authorization tracking system that links every authorization to the patient encounter and verifies status before claim submission.
7. PR-1 — Deductible Amount
PR-1 indicates the claim amount applied to the patient's deductible. While this is a patient responsibility adjustment rather than a payer denial, it represents a significant collection challenge. With high-deductible health plans now covering over 55% of employer-sponsored workers, the portion of revenue shifted to patient responsibility continues to grow. Pre-service financial counseling and real-time eligibility verification that surfaces remaining deductible amounts before the encounter are essential for managing this category.
8. PR-2 — Coinsurance Amount
PR-2 represents the patient's coinsurance obligation after the deductible has been met. Like PR-1, this is a patient responsibility code, but it requires accurate benefit verification to ensure the correct coinsurance percentage is applied. Errors in benefit configuration — such as applying in-network coinsurance to an out-of-network claim or using the wrong plan year benefit structure — create collection problems that surface months after service delivery.
9. PR-3 — Copay Amount
PR-3 denotes the patient's copayment amount. Copay collection at the point of service is a revenue cycle fundamental, yet many organizations still fail to collect consistently. The median copay collection rate at time of service hovers around 60% for many practices, meaning 40% of copay amounts enter the more expensive patient billing and collection cycle. Real-time eligibility checks that surface exact copay amounts at scheduling and check-in, combined with automated payment collection tools, significantly improve front-end collection rates.
10. OA-23 — Coordination of Benefits (Impact of Prior Payer Adjudication)
OA-23 indicates the claim adjustment is based on coordination of benefits with another payer. This code appears when a secondary payer reduces payment based on the primary payer's adjudication, or when the claim was submitted to the wrong payer in the COB sequence. COB issues are particularly prevalent with Medicare/Medicaid dual-eligible populations, working-aged Medicare beneficiaries with employer coverage, and patients with multiple commercial plans. Automated 270/271 eligibility transactions that verify both primary and secondary coverage order at scheduling prevent the majority of COB denials.
Payer-Specific Denial Patterns: UHC vs Anthem vs Aetna vs Cigna
Not all payers deny claims at the same rate or for the same reasons. Understanding payer-specific denial behavior is essential for building targeted prevention strategies. The most transparent publicly available data comes from KFF analysis of ACA Marketplace Transparency in Coverage filings and Muni Health's 2026 insurer ranking.
UnitedHealthcare (UHG)
UnitedHealthcare, the nation's largest insurer, reported an overall denial rate of approximately 19.1% across 6.4 million claims in the most recent transparency data — a significant drop from 33-34% in prior years. However, UHC's denial patterns are distinctive:
- Authorization-heavy: UHC applies prior authorization requirements to a broader set of services than most competitors, making CO-197 denials disproportionately common
- Medical necessity scrutiny: UHC uses proprietary clinical algorithms (including AI-assisted review) for medical necessity determinations, generating CO-16 denials paired with medical necessity RARCs
- Aggressive downcoding: Providers report higher rates of E/M downcoding and payment reductions under UHC plans compared to other national payers
- Appeal overturn rate: UHC's internal appeal overturn rate is lower than the industry average, making first-pass accuracy critical
CFO strategy for UHC: Invest in authorization tracking systems that auto-verify UHC-specific auth requirements. Pre-submission medical necessity validation against UHC's clinical policies reduces CO-16/CO-197 denials by 30-40%.
Anthem/Elevance Health
Anthem/Elevance reported denial rates around 23% — above the national average. Anthem's denial profile skews toward coding and authorization issues:
- Coding-intensive denials: Anthem applies strict NCCI bundling edits and has payer-specific coding requirements that go beyond standard CMS guidelines, generating above-average CO-4 and CO-97 denials
- State-by-state variation: Because Anthem operates as independent Blue Cross Blue Shield plans in 14 states, denial patterns vary significantly by state. A denial prevention rule that works for Anthem-California may not apply to Anthem-Georgia
- Clinical policy updates: Anthem updates its clinical coverage policies quarterly, and new restrictions often take effect with minimal provider notification
CFO strategy for Anthem: Build state-specific denial rule sets. Monitor Anthem's clinical policy bulletin updates monthly and translate changes into pre-submission validation rules within 30 days of publication.
Aetna (CVS Health)
Aetna's denial rate of approximately 22% reflects its position as a heavy user of prior authorization requirements, particularly since the CVS Health integration:
- Prior authorization dominance: Aetna leads in authorization-related denials (CO-197), applying prior auth requirements to a growing list of outpatient procedures, imaging studies, and specialty referrals
- Pharmacy integration effects: Since the CVS integration, Aetna has tightened step therapy and formulary requirements, driving denials for medical benefit drug administrations that require pharmacy benefit prior authorization
- Timely filing enforcement: Aetna enforces shorter filing windows than many competitors (90-120 days for many plan types), generating preventable CO-29 timely filing denials
CFO strategy for Aetna: Deploy automated authorization initiation at the point of scheduling. Build a timely filing dashboard with 30/60/90-day alerts specific to Aetna's shorter windows. Cross-reference medical benefit drugs against Aetna's pharmacy benefit requirements.
Cigna
Cigna's denial rates vary widely — from 17% to 30% depending on the plan type and region — but its denial patterns have distinct characteristics:
- Coding-dominant denials: Cigna generates above-average coding-related denials (CO-4, CO-97), particularly for specialist and surgical services
- Credentialing strictness: Cigna is aggressive about denying claims when the rendering provider is not properly credentialed or enrolled, generating provider-level denials that other payers would process
- Retrospective review: Cigna conducts post-payment audits at higher rates than industry average, meaning initial payment does not guarantee revenue retention
CFO strategy for Cigna: Maintain real-time provider enrollment verification for all Cigna-contracted providers. Implement automated NCCI edit validation with Cigna-specific modifier rules. Build post-payment audit defense documentation into the billing workflow.
Denial Cost Economics: The $262 Billion Revenue Drain
The true financial impact of denials extends far beyond the denied claim amount. Understanding the full cost structure is essential for building the business case for AI denial management investment.
Direct Costs Per Denial
| Cost Component | Provider/Physician Office | Hospital/Health System |
|---|---|---|
| Staff time for review and rework | $25 | $118 - $181 |
| Technology and system costs | $3 - $5 | $8 - $15 |
| Appeal preparation and submission | $15 - $30 | $45 - $90 |
| Total cost per denial (rework) | $43 - $60 | $171 - $286 |
The Abandonment Problem
The most devastating economic fact about denials is the abandonment rate. According to multiple industry analyses including Advisement Health and Etactics research, up to 65% of denied claims are never resubmitted. The reasons are structural:
- Staff capacity constraints: Revenue cycle teams are already working at capacity processing new claims. Denied claims compete for the same resources, and organizations triage toward higher-value rework
- Timely filing expiration: By the time denials are identified, reviewed, and queued for rework, many have exceeded the payer's timely filing window
- Cost-benefit calculus: For denials under $50 to $100, the cost of rework exceeds the potential recovery, making write-off the rational economic decision
- Missing information: Denials requiring clinical documentation that was never completed, or authorizations that were never obtained, have no viable rework path
Annual Industry Impact
The math is straightforward and alarming:
- $262 billion in claims denied annually across the US healthcare industry
- 65% never resubmitted = approximately $170 billion in permanently lost revenue
- 35% reworked at an average cost of $118 per denial = $10.8 billion in annual rework expense
- 63% appeal overturn rate on reworked claims = approximately $57.7 billion recovered
- Net permanent loss: approximately $112 billion annually across the industry
For a single health system with $1 billion in net patient revenue and an 11.8% denial rate, the annual exposure is $118 million in denied claims, of which approximately $76.7 million will never be resubmitted and $4.8 million will be spent on rework.
The AI Denial Prevention Stack: Pre-Submission Validation
The highest-ROI investment in denial management is preventing denials before claims are submitted. AI-powered pre-submission validation catches errors at the point of lowest cost — before the claim enters the payer's adjudication system. For a comprehensive view of how AI agents are transforming the entire revenue cycle beyond denial management, see our guide on agentic AI for revenue cycle management.
Real-Time Eligibility Verification (270/271)
The first layer of prevention addresses the 24% of denials attributable to registration and eligibility errors. Automated 270/271 eligibility transactions verify patient coverage at three critical touchpoints:
- At scheduling: Confirms active coverage and identifies primary/secondary payer ordering
- 48 hours before appointment: Catches coverage changes that occurred after scheduling, including plan terminations, employer changes, and COB updates
- At check-in: Final verification that surfaces any last-minute coverage changes and confirms the exact benefit structure including deductible remaining, copay amounts, and coinsurance percentages
Organizations that implement three-touch automated eligibility verification typically reduce eligibility-related denials by 60-70%, which translates to a 14-17% reduction in overall denial volume given that eligibility issues represent 24% of total denials.
Coding Audit Engine with CCI/LCD Rules
AI-powered coding validation goes beyond basic claim scrubbing. Machine learning models trained on millions of claim outcomes learn the nuanced coding rules that drive denials:
- NCCI edit validation: Real-time check against the current CCI edit matrix for every CPT code pair, with automatic modifier suggestion when a modifier would resolve a bundling conflict
- LCD/NCD medical necessity: Cross-references the diagnosis-procedure combination against applicable Local and National Coverage Determinations to verify medical necessity before submission
- Payer-specific coding rules: Applies learned payer-specific coding requirements that go beyond standard CMS guidelines — for example, Anthem's stricter modifier requirements or Cigna's specialty coding nuances
- Modifier optimization: Recommends the correct modifier (-25, -59, -76, -77, -XE, -XS, -XP, -XU) based on the claim context, with confidence scores for each recommendation
Authorization Tracking and Auto-Initiation
Authorization-related denials (CO-197) are among the highest-dollar denials because they disproportionately affect high-cost services. An AI-powered authorization management system addresses this through:
- Auto-detection of auth requirements: When a procedure is scheduled, the system checks the patient's specific plan against the payer's authorization matrix and initiates the auth request automatically
- Expiration monitoring: Tracks authorization validity periods and alerts scheduling staff when an existing auth will expire before the planned service date
- Unit tracking: For therapy services and other visit-limited authorizations, monitors remaining authorized units and initiates extension requests before exhaustion
- Retrospective auth automation: When services are delivered without prior auth (emergencies, intraoperative scope changes), automatically initiates retrospective authorization within the payer's required window
Pre-Submission Risk Scoring
The capstone of the prevention layer is a machine learning model that assigns a denial probability score to every claim before submission. The model considers:
- Historical denial patterns for the specific payer, procedure, provider, and diagnosis combination
- Claim completeness against payer-specific field requirements
- Authorization status and match to billed services
- Patient eligibility confidence based on last verification date
- Temporal factors (day of week, month, proximity to payer policy change dates)
Claims scoring above a configurable threshold (typically 60-70% denial probability) are held for human review before submission. This targeted review catches the highest-risk claims without creating a bottleneck for the 85-90% of claims that pass all validation rules.
AI Denial Detection: Pattern Recognition and Early Warning
When denials do occur despite pre-submission validation, AI-powered detection systems identify patterns and systemic issues faster than manual analysis.
Machine Learning Clustering
K-Means and DBSCAN clustering algorithms group denied claims by similarity across multiple dimensions simultaneously — payer, CARC code, procedure family, provider specialty, time period, and dollar amount. Instead of analyzing one variable at a time, clustering reveals multi-dimensional patterns. For example, a cluster might show that UnitedHealthcare denials for outpatient radiology (CPT 70000-79999) have a 3x higher CO-197 rate on claims submitted on Mondays and Tuesdays. This pattern, invisible to manual review, could indicate a systematic authorization verification gap in the Monday scheduling workflow.
Time-Series Anomaly Detection
When a payer changes a coverage policy, updates authorization requirements, or modifies claim processing rules, the impact appears as a step-change in the denial time series. Automated anomaly detection using Isolation Forest or Prophet models flags these changes within days rather than the weeks or months required for manual pattern recognition. This early warning enables proactive rule updates that prevent hundreds or thousands of preventable denials from accumulating.
Payer Behavioral Drift Monitoring
Payer denial patterns are not static — they evolve as payers update clinical policies, deploy new adjudication algorithms, and shift enforcement priorities. ML models trained on payer-segmented data detect behavioral drift by monitoring:
- Denial rate trends by CARC code per payer per month
- New CARC code emergence: When a payer begins using a previously rare denial code, it signals a policy or system change
- Overturn rate changes: When appeal success rates drop for a specific denial type, the payer has likely tightened its adjudication criteria
- Seasonal patterns: Denial rate spikes in January (coverage changes), October (annual code updates), and Q4 (fiscal year cost containment)
AI Denial Recovery: Automated Appeals and Payer-Specific Templates
For the denials that reach the recovery stage, AI dramatically improves appeal speed, quality, and success rates.
Automated Appeal Generation
AI appeal systems generate payer-specific appeal letters by combining:
- Denial analysis: Parsing the CARC/RARC codes, remittance advice remarks, and claim adjustment details to identify the specific denial reason
- Clinical evidence assembly: Automatically extracting relevant clinical documentation from the EHR that addresses the denial reason — operative notes for procedure denials, clinical assessments for medical necessity denials, authorization confirmations for auth denials
- Payer-specific language: Using appeal templates trained on historically successful appeals for each payer, including the regulatory citations, plan provision references, and clinical evidence formats that each payer's appeal reviewers respond to
- Regulatory compliance: Incorporating applicable federal and state appeal rights, including No Surprises Act provisions, state surprise billing protections, and CMS appeal timelines
Priority Routing by Dollar Impact
AI recovery systems prioritize appeal workflows by financial impact, ensuring that limited human resources focus on the highest-value recoveries. A $50,000 surgical denial with high overturn probability receives immediate human attention, while a $75 lab denial with standard appeal language can be processed through fully automated channels.
Appeal Outcome Prediction
ML models predict appeal success probability based on the denial type, payer, clinical evidence strength, and historical appeal outcomes for similar cases. This prediction enables informed triage — denials with low appeal probability may be more efficiently addressed through corrective resubmission (if the root cause is fixable) rather than formal appeal. Organizations using AI-powered appeal prediction report overturn rates 15-25% higher than manual appeal processes.
2026 Regulatory Changes Impacting Denial Management
The regulatory landscape in 2026 introduces both new requirements and new tools for denial management.
CMS Interoperability and Prior Authorization Final Rule (CMS-0057-F)
The CMS-0057-F rule introduces transformative requirements that directly impact denial management, with key provisions taking effect January 1, 2026:
- Specific denial reasons required: Impacted payers must provide a specific reason for denied prior authorization decisions, including the plan provision on which the denial is based, citation to coverage criteria, or a narrative explanation. This eliminates generic denial language and gives providers actionable appeal information
- Response time mandates: Payers must respond to expedited prior authorization requests within 72 hours and standard requests within 7 calendar days. Violations create regulatory leverage for providers challenging delayed authorization denials
- Public reporting of denial metrics: Beginning March 31, 2026, impacted payers must publicly report approval rates, denial rates, appeal overturn rates, and average decision times. This transparency enables benchmarking and identifies outlier payers for targeted advocacy
- Prior Authorization API requirements: Payers must implement electronic prior authorization APIs that allow providers to check authorization requirements and submit requests programmatically — creating the technical foundation for automated authorization management
No Surprises Act: Ongoing Implications
The No Surprises Act continues to reshape denial patterns in 2026, particularly for emergency services, out-of-network providers at in-network facilities, and air ambulance services. Key implications for denial management:
- Independent Dispute Resolution (IDR): The federal IDR process provides an alternative recovery path for qualifying balance billing disputes, with recent CMS guidance updating the qualifying payment amount (QPA) calculation methodology
- Patient cost-sharing protections: Providers cannot balance-bill patients for covered emergency services or certain out-of-network services at in-network facilities, shifting the financial risk to the provider-payer negotiation
- Good faith estimates: Uninsured and self-pay patients must receive good faith cost estimates, creating documentation requirements that intersect with the denial management workflow
State-Level Regulatory Developments
Multiple states have enacted or are implementing denial management regulations that exceed federal requirements, including:
- California (SB 1364): Requires health plans to maintain a 95% accuracy rate in claims processing and imposes financial penalties for systematic denial errors
- New York (Concurrent Utilization Review): Restricts retrospective denial of inpatient services that were approved during concurrent review
- Texas (Prompt Pay Act): Requires clean claims to be paid within 30 days (electronic) or 45 days (paper), with penalty interest for late payment
The CFO Denial Management Action Plan for 2026
Transforming denial management from a reactive cost center to a proactive revenue protection system requires a structured quarterly approach. The following action plan provides the roadmap for health system CFOs deploying AI-powered denial management in 2026.
Q1: Baseline Assessment and Root Cause Mapping
Objective: Establish the organization's denial profile and quantify the financial opportunity.
- Denial rate audit by root cause: Classify 12 months of historical denials into the 5 root cause categories (eligibility, authorization, coding, billing, documentation) using CARC code mapping
- Payer-specific pattern analysis: Calculate denial rates per payer, identify the top 3 payers by denial dollar impact, and map each payer's denial signature to specific CARC codes
- Cost per denial calculation: Measure actual FTE time and cost for denial rework, appeal preparation, and resubmission across the organization
- Abandonment rate measurement: Determine what percentage of denials are currently written off without rework, segmented by denial dollar amount and root cause
- Deliverable: Board-ready denial impact report showing total annual denial dollars, rework costs, permanent write-offs, and the recoverable revenue opportunity
Q2: AI Stack Deployment — Prevention Layer
Objective: Deploy the pre-submission validation engine targeting the highest-impact denial categories.
- Real-time eligibility verification: Implement automated 270/271 transactions at scheduling, 48 hours pre-service, and check-in. Target: 60-70% reduction in eligibility-related denials
- Coding validation engine: Deploy AI-powered claim scrubbing with NCCI edit validation, LCD/NCD medical necessity checks, and modifier optimization. Target: 40-55% reduction in coding-related denials
- Authorization tracking system: Implement auto-detection of auth requirements at scheduling, expiration monitoring, and unit tracking. Target: 50-65% reduction in authorization-related denials
- ML model training: Train pre-submission denial risk scoring model on 12-24 months of historical claim and denial data
- Deliverable: Operational prevention engine processing 100% of claims with real-time risk scores and automated hold/release logic
Q3: Optimization and Recovery Automation
Objective: Optimize prevention rules based on performance data and deploy automated recovery workflows.
- Prevention rule tuning: Analyze Q2 performance data to refine validation rules, reduce false positive hold rates, and add payer-specific rules learned from continued denial patterns
- Automated appeal deployment: Launch AI-generated appeal letters with payer-specific templates for the top 10 denial types by dollar impact
- Pattern detection activation: Deploy ML clustering and time-series anomaly detection to identify emerging denial trends and payer behavioral changes
- Provider scorecard deployment: Launch per-provider denial rate dashboards showing denial rates by root cause category relative to specialty benchmarks
- Deliverable: Operational detection and recovery engines with automated appeal processing for high-volume, standardized denial types
Q4: ROI Measurement and Board Reporting
Objective: Quantify the financial impact of the AI denial management program and present results to the board.
- Denial rate reduction measurement: Compare current denial rates to Q1 baseline across all 5 root cause categories and all major payers. Target: 40-60% overall reduction in preventable denials
- Revenue recovery quantification: Calculate additional revenue recovered through prevented denials, faster rework, and higher appeal success rates
- Cost reduction measurement: Quantify FTE time freed from manual denial management and reallocated to higher-value revenue cycle activities
- 2027 roadmap presentation: Present year-one results and the expansion plan for year two, including additional payer-specific optimizations, expanded AI model coverage, and integration with clinical documentation improvement programs
- Deliverable: Board presentation showing 3-5x ROI on denial management investment, with year-two projections
Vendor Evaluation Framework
CFOs evaluating AI denial management vendors should assess capabilities across five dimensions:
| Evaluation Dimension | Key Questions | Minimum Requirement |
|---|---|---|
| Prevention Capabilities | Does the system perform real-time pre-submission validation? Which payer-specific rules are supported? | 270/271 eligibility, NCCI edits, LCD/NCD validation |
| Detection and Analytics | Does the system provide ML-powered pattern detection? What is the false positive rate? | Payer-specific trending, anomaly detection, root cause classification |
| Recovery Automation | Does the system generate automated appeals? What is the appeal success rate improvement? | Payer-specific appeal templates, clinical evidence auto-assembly |
| Integration Depth | How does the system integrate with your EHR, PMS, and clearinghouse? | HL7v2/FHIR integration, real-time bidirectional data flow |
| Measurable Outcomes | What denial rate reduction and ROI do reference customers report? | Documented 30%+ denial reduction with named references |
Frequently Asked Questions
What is the average healthcare claim denial rate in 2026?
According to Experian Health's 2025 State of Claims Report, 41% of healthcare providers now report that more than 10% of their claims are denied — up from 30% in 2022. Initial denial rates have reached 11.8%, up from 10.2% in prior years. For ACA marketplace plans specifically, the national average in-network denial rate was 19.1% in Plan Year 2024 data. The actual denial rate for any given health system depends on payer mix, specialty focus, and the maturity of denial prevention processes in place.
Which health insurance payer denies the most claims?
Based on publicly reported ACA marketplace transparency data, Anthem/Elevance Health has among the highest denial rates of major national payers at approximately 23%, followed by Aetna/CVS Health at 22%. UnitedHealthcare reported 19.1% across 6.4 million claims, a significant drop from prior years. Cigna's rates vary widely (17-30%) depending on plan type and region. However, denial rates vary significantly by plan type, state, and service category, so payer-specific analysis using your organization's own claims data is essential for targeting prevention efforts.
How much does it cost to rework a denied healthcare claim?
The average cost to rework a denied claim ranges from $25 for physician practices to $118-$181 for hospitals and health systems. When including appeal preparation, clinical documentation assembly, and resubmission processing, the total per-denial cost can reach $286 for complex hospital denials. Critically, 65% of denied claims are never resubmitted at all, meaning the full claim amount is permanently lost. For a health system with $1 billion in net patient revenue, the combined rework cost and abandoned denial loss typically exceeds $80 million annually.
What are the most common CARC denial codes in healthcare?
The top 10 CARC codes by frequency and financial impact are: CO-4 (procedure/modifier mismatch), CO-16 (missing information/billing errors), CO-18 (duplicate claim), CO-45 (charge exceeds fee schedule), CO-97 (bundling/CCI violation), CO-197 (missing precertification), PR-1 (deductible), PR-2 (coinsurance), PR-3 (copay), and OA-23 (coordination of benefits). The CO-prefix codes represent payer-actionable denials that can be prevented through pre-submission validation, while PR-prefix codes represent patient responsibility adjustments that require front-end collection strategies.
How can AI reduce healthcare claim denials?
AI reduces denials through a three-layer approach: prevention (pre-submission validation using real-time eligibility verification, coding audit engines with NCCI/LCD rules, and authorization tracking), detection (ML-powered pattern recognition that identifies payer behavioral changes and emerging denial trends within days rather than months), and recovery (automated appeal generation with payer-specific templates and clinical evidence auto-assembly). Organizations deploying comprehensive AI denial management stacks report 40-60% reduction in preventable denials within 6 months of full deployment, with 3-5x ROI on implementation investment. The CMS-0057-F rule taking effect in 2026 further enables AI-driven authorization management through mandatory electronic prior authorization APIs.