When a hospital's EHR goes dark, the cost isn't measured in lost revenue alone. At $7,900 per minute, healthcare system downtime ranks among the most expensive across any industry. A 2025 Ponemon Institute study found that the average healthcare outage lasts 95 minutes, translating to $750,500 per incident. But the financial toll tells only half the story. Delayed lab results, missed clinical alerts, and inaccessible patient records create patient safety risks that no dollar figure can capture.
This guide covers the complete incident management lifecycle for healthcare IT teams, from severity classification to runbook templates, escalation policies, and tool selection. Whether you're running a single-facility EHR or managing integrations across a multi-hospital system, these frameworks will help you detect faster, respond smarter, and prevent recurrence.
Why Healthcare Incident Management Is Different
Standard incident management frameworks (think Google's SRE handbook or PagerDuty's incident response guide) provide a solid foundation, but healthcare adds layers of complexity that most tech companies never face:
- Patient safety is the primary SLA. When an e-commerce site goes down, customers buy elsewhere. When an EHR goes down, clinicians make decisions without complete information. The "blast radius" isn't lost shopping carts; it's degraded care.
- Regulatory obligations kick in immediately. HIPAA breach notification timelines start ticking the moment PHI exposure is suspected. You have 60 days to notify affected individuals, but your internal assessment must begin immediately.
- Clinical workflows have no fallback. A 93% patient expectation for 24/7 digital services (per Accenture's 2025 Digital Health Consumer Survey) means downtime during any hour impacts care delivery.
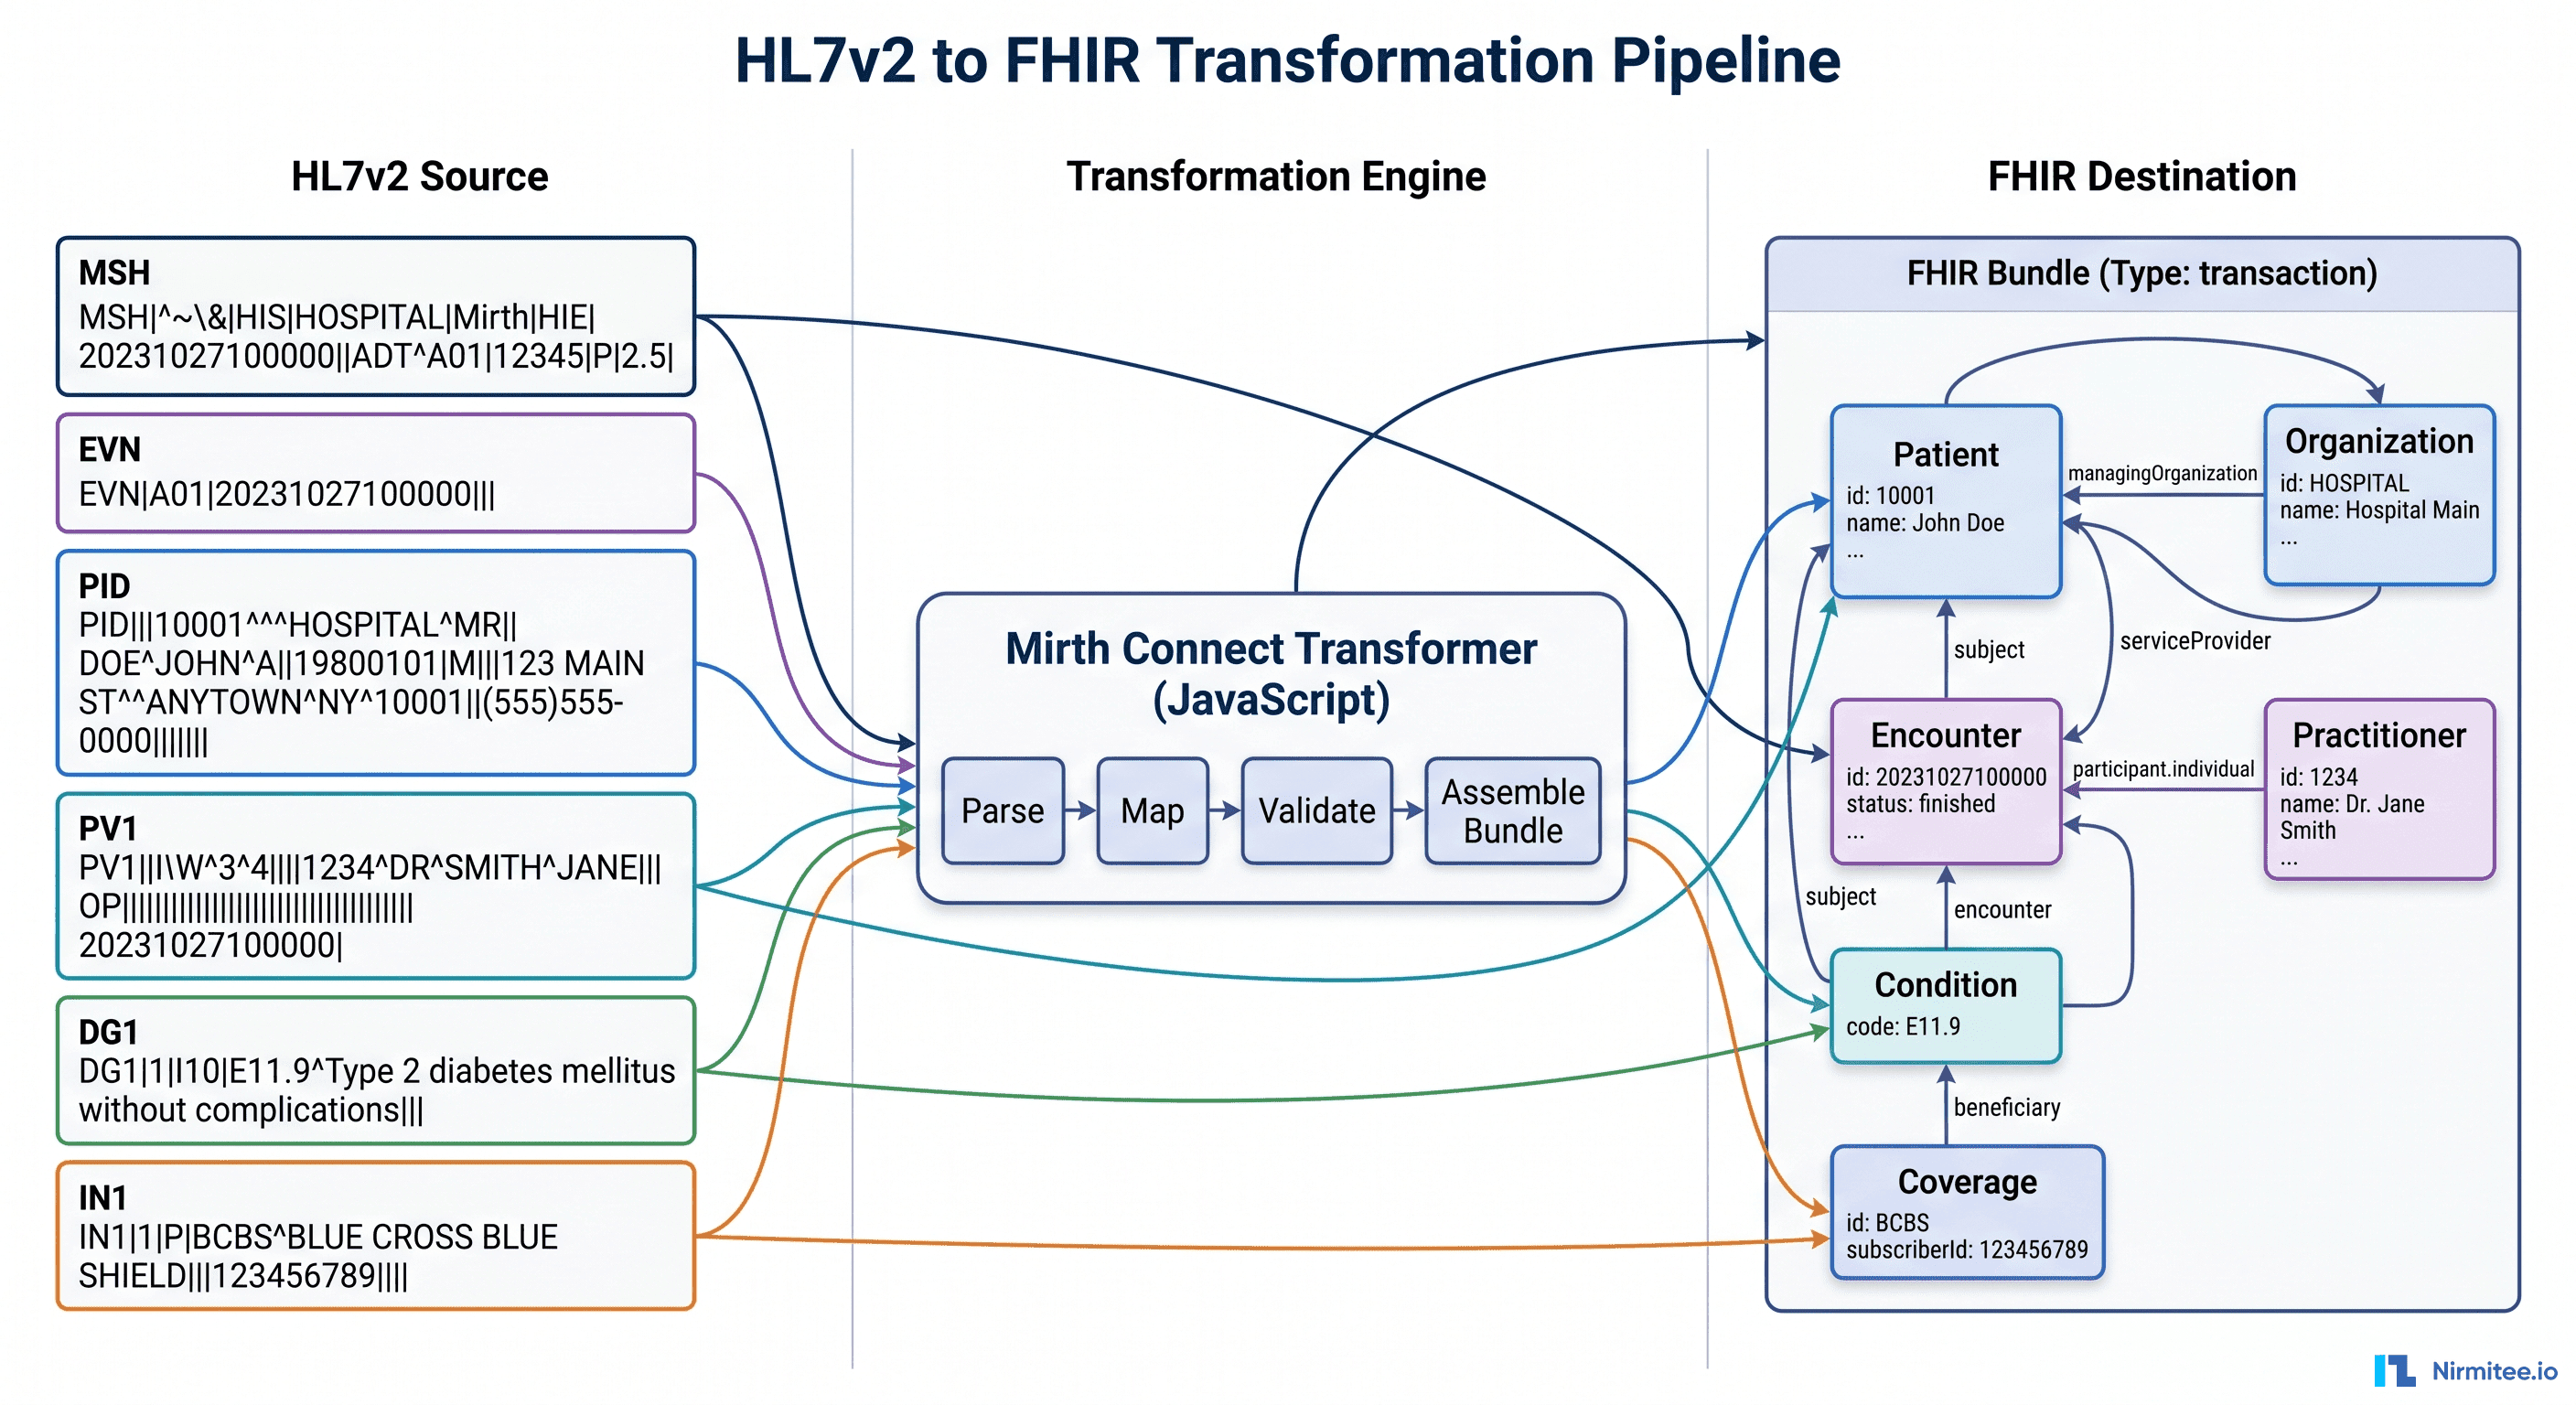
- Integration complexity multiplies failure modes. A typical hospital runs 50+ integration interfaces through engines like Mirth Connect, connecting EHR, lab, pharmacy, radiology, and billing systems. A single failed channel can cascade.
Incident Severity Classification for Healthcare
Standard P1-P4 severity levels need healthcare-specific definitions. The critical distinction is whether the incident impacts patient care, clinical workflows, or operational convenience.
| Severity | Definition | Healthcare Examples | Response Time | Escalation |
|---|---|---|---|---|
| P1 — Critical | Patient safety impact; core clinical systems down | EHR completely down; clinical alerts not delivering; medication dispensing system offline; PACS unavailable during active procedures | Immediate (< 5 min) | Incident Commander + Clinical IT Lead + Nursing Informatics + CIO within 15 min |
| P2 — High | Clinical workflow disruption; workaround available but degraded | Scheduling system down; lab results delayed > 30 min; Mirth interface stopped for non-critical feeds; patient portal inaccessible | < 15 min | On-call engineer + team lead within 30 min |
| P3 — Medium | Degraded performance; no direct patient impact | Slow FHIR API responses (> 2s p95); high latency on reporting queries; background sync jobs failing; non-critical integration delays | < 1 hour | On-call engineer; team lead if unresolved in 2 hours |
| P4 — Low | Cosmetic or minor; no workflow impact | UI rendering issues; non-critical report formatting; dev environment problems; documentation site down | Next business day | Ticket queue; standard sprint prioritization |
The key question for triage: "Is a clinician unable to access information they need for a patient care decision right now?" If yes, it's P1. If they have a workaround, it's P2. If performance is degraded but functional, it's P3.
The Incident Lifecycle: Six Phases
Every healthcare incident passes through six phases. Skipping any phase, especially the review, guarantees you'll fight the same fire again.
Phase 1: Detect
Detection should never come from a clinician calling the help desk. Proactive monitoring means you know about the problem before users do. Key detection sources:
- Infrastructure monitoring: Prometheus/Grafana for CPU, memory, disk, network. Alert on PostgreSQL connection pool saturation, Kubernetes pod restarts, and disk space on database volumes.
- Application monitoring: FHIR API response time percentiles (p50, p95, p99), error rate spikes, Mirth Connect channel statistics (queued messages, error count, throughput drop).
- Synthetic monitoring: Automated FHIR queries every 60 seconds testing Patient read, Observation search, and token endpoint availability.
- Log aggregation: ELK or Datadog for pattern detection — a sudden spike in 5xx errors, authentication failures, or database timeout errors.
# Prometheus alert rule for FHIR server error rate
groups:
  - name: fhir-server-alerts
    rules:
      - alert: FHIRServerHighErrorRate
        expr: |
          sum(rate(http_requests_total{service="fhir-server",status=~"5.."}[5m]))
          /
          sum(rate(http_requests_total{service="fhir-server"}[5m]))
          > 0.05
        for: 2m
        labels:
          severity: P1
          team: integration
        annotations:
          summary: "FHIR server error rate above 5% for 2 minutes"
          runbook: "https://runbooks.internal/fhir-server-errors"
          clinical_impact: "FHIR queries failing — clinical apps may not load patient data"
Phase 2: Triage
Triage answers three questions in under two minutes: What's the severity? Who owns it? What's the clinical impact?
# PagerDuty event routing rule (Terraform)
resource "pagerduty_event_orchestration_router" "healthcare" {
  set {
    id = pagerduty_event_orchestration.healthcare.id
  }

  catch_all {
    actions {
      route_to = pagerduty_service.infrastructure.id
    }
  }

  rule {
    label = "FHIR Server Critical"
    condition {
      expression = "event.custom_details.service matches 'fhir-server' and event.severity matches 'critical'"
    }
    actions {
      route_to = pagerduty_service.clinical_integration.id
      severity  = "critical"
    }
  }

  rule {
    label = "Mirth Channel Down"
    condition {
      expression = "event.custom_details.service matches 'mirth-connect'"
    }
    actions {
      route_to = pagerduty_service.interface_team.id
    }
  }
}
Phase 3: Communicate
Healthcare incident communication must reach both technical and clinical stakeholders. Your communication plan needs two tracks:
| Stakeholder | P1 Notification | P2 Notification | Channel |
|---|---|---|---|
| Incident Commander | Immediate page | Slack + page if no ACK in 15 min | PagerDuty |
| Clinical IT Lead | Immediate page | Slack notification | PagerDuty + Slack |
| Nursing Informatics | Immediate call | Email within 30 min | Phone / Email |
| Department Heads | Email within 15 min | Email within 1 hour | Email template |
| CIO / CISO | Immediate call if PHI risk | Daily summary | Phone / Slack |
| Help Desk | Immediate script update | Immediate script update | Internal KB |
Communication templates save critical minutes during P1 incidents. Here's a template for the initial notification:
# P1 Incident Notification Template

## INCIDENT: [Short Description]
**Severity:** P1 — Patient Safety Impact
**Time Detected:** [HH:MM timezone]
**Incident Commander:** [Name]

### What's Happening
[2-3 sentences describing the issue in non-technical terms]

### Clinical Impact
- Affected systems: [EHR, Lab, Pharmacy, etc.]
- Affected workflows: [Which clinical workflows are disrupted?]
- Patient population impacted: [All patients / specific unit / ED only]
- Workaround available: [Yes/No — if yes, describe]

### Current Status
- Engineering team engaged: [Yes/No]
- Estimated time to resolution: [If known, or "Investigating"]

### Next Update
- Update will be provided at [HH:MM] or sooner if status changes

### Escalation Contact
- [Incident Commander name and phone]
Phase 4: Investigate
Investigation follows the data. Start with the most recent change, then broaden. A structured approach:
- Check recent deployments — Did anything ship in the last 4 hours? Git log, deployment pipeline history, Kubernetes rollout status.
- Check infrastructure metrics — CPU, memory, disk, network. Is PostgreSQL connection pool exhausted? Are Kubernetes nodes unhealthy?
- Check application logs — Filter by error level, look for stack traces, timeout patterns, or authentication failures.
- Check integration points — Mirth Connect channel statistics, downstream EHR availability, certificate expiration dates.
- Check external dependencies — Is the identity provider responding? Are third-party APIs (lab vendor, pharmacy network) reachable?
Phase 5: Resolve
Resolution prioritizes restoring service over finding root cause. Common resolution patterns for healthcare:
- Rollback deployment: If a recent deploy correlates with the incident, roll back first, investigate later.
- Restart service: Kubernetes pod restart, Mirth Connect channel restart, application server restart.
- Failover: Promote PostgreSQL replica, switch to standby FHIR server, redirect traffic via load balancer.
- Scale: Add Kubernetes replicas, increase connection pool size, provision additional compute.
- Isolate: Disable a failing integration channel to restore the core system while the channel is fixed separately.
Phase 6: Review
The post-incident review (PIR) is where you prevent recurrence. Healthcare PIRs must include clinical impact assessment.
Runbook Templates for Common Healthcare Incidents
Runbooks transform tribal knowledge into repeatable procedures. Every on-call engineer should be able to follow a runbook without prior context on the system.
Runbook: EHR System Down
# Runbook: EHR System Down
# Severity: P1
# Owner: Clinical Platform Team
# Last Updated: 2026-03-15
## Detection
- Synthetic monitors report EHR login page unreachable
- OR: Clinical staff report inability to access patient records
## Immediate Actions (first 5 minutes)
1. Confirm outage scope:
curl -s -o /dev/null -w "%{http_code}" https://ehr.internal/health
kubectl get pods -n ehr-production -l app=ehr-server
kubectl top pods -n ehr-production
2. Check recent deployments:
kubectl rollout history deployment/ehr-server -n ehr-production
3. If recent deployment found, rollback:
kubectl rollout undo deployment/ehr-server -n ehr-production
4. Check database connectivity:
psql -h db-primary.internal -U ehr_app -c "SELECT 1;"
psql -h db-primary.internal -U ehr_app -c "SELECT count(*) FROM pg_stat_activity;"
5. Check connection pool:
curl -s http://ehr-server:8080/metrics | grep db_pool
## Escalation
- If not resolved in 15 minutes: page Database Team
- If PHI exposure suspected: page CISO immediately
- Notify Clinical IT Lead and Nursing Informatics regardless
## Communication
- Send P1 notification template to stakeholder list
- Update help desk script: "We are aware of EHR access issues..."
- Post to #incident-active Slack channel
## Resolution Verification
- Confirm EHR login page returns 200
- Confirm patient search returns results
- Confirm lab results are flowing (check Mirth channel stats)
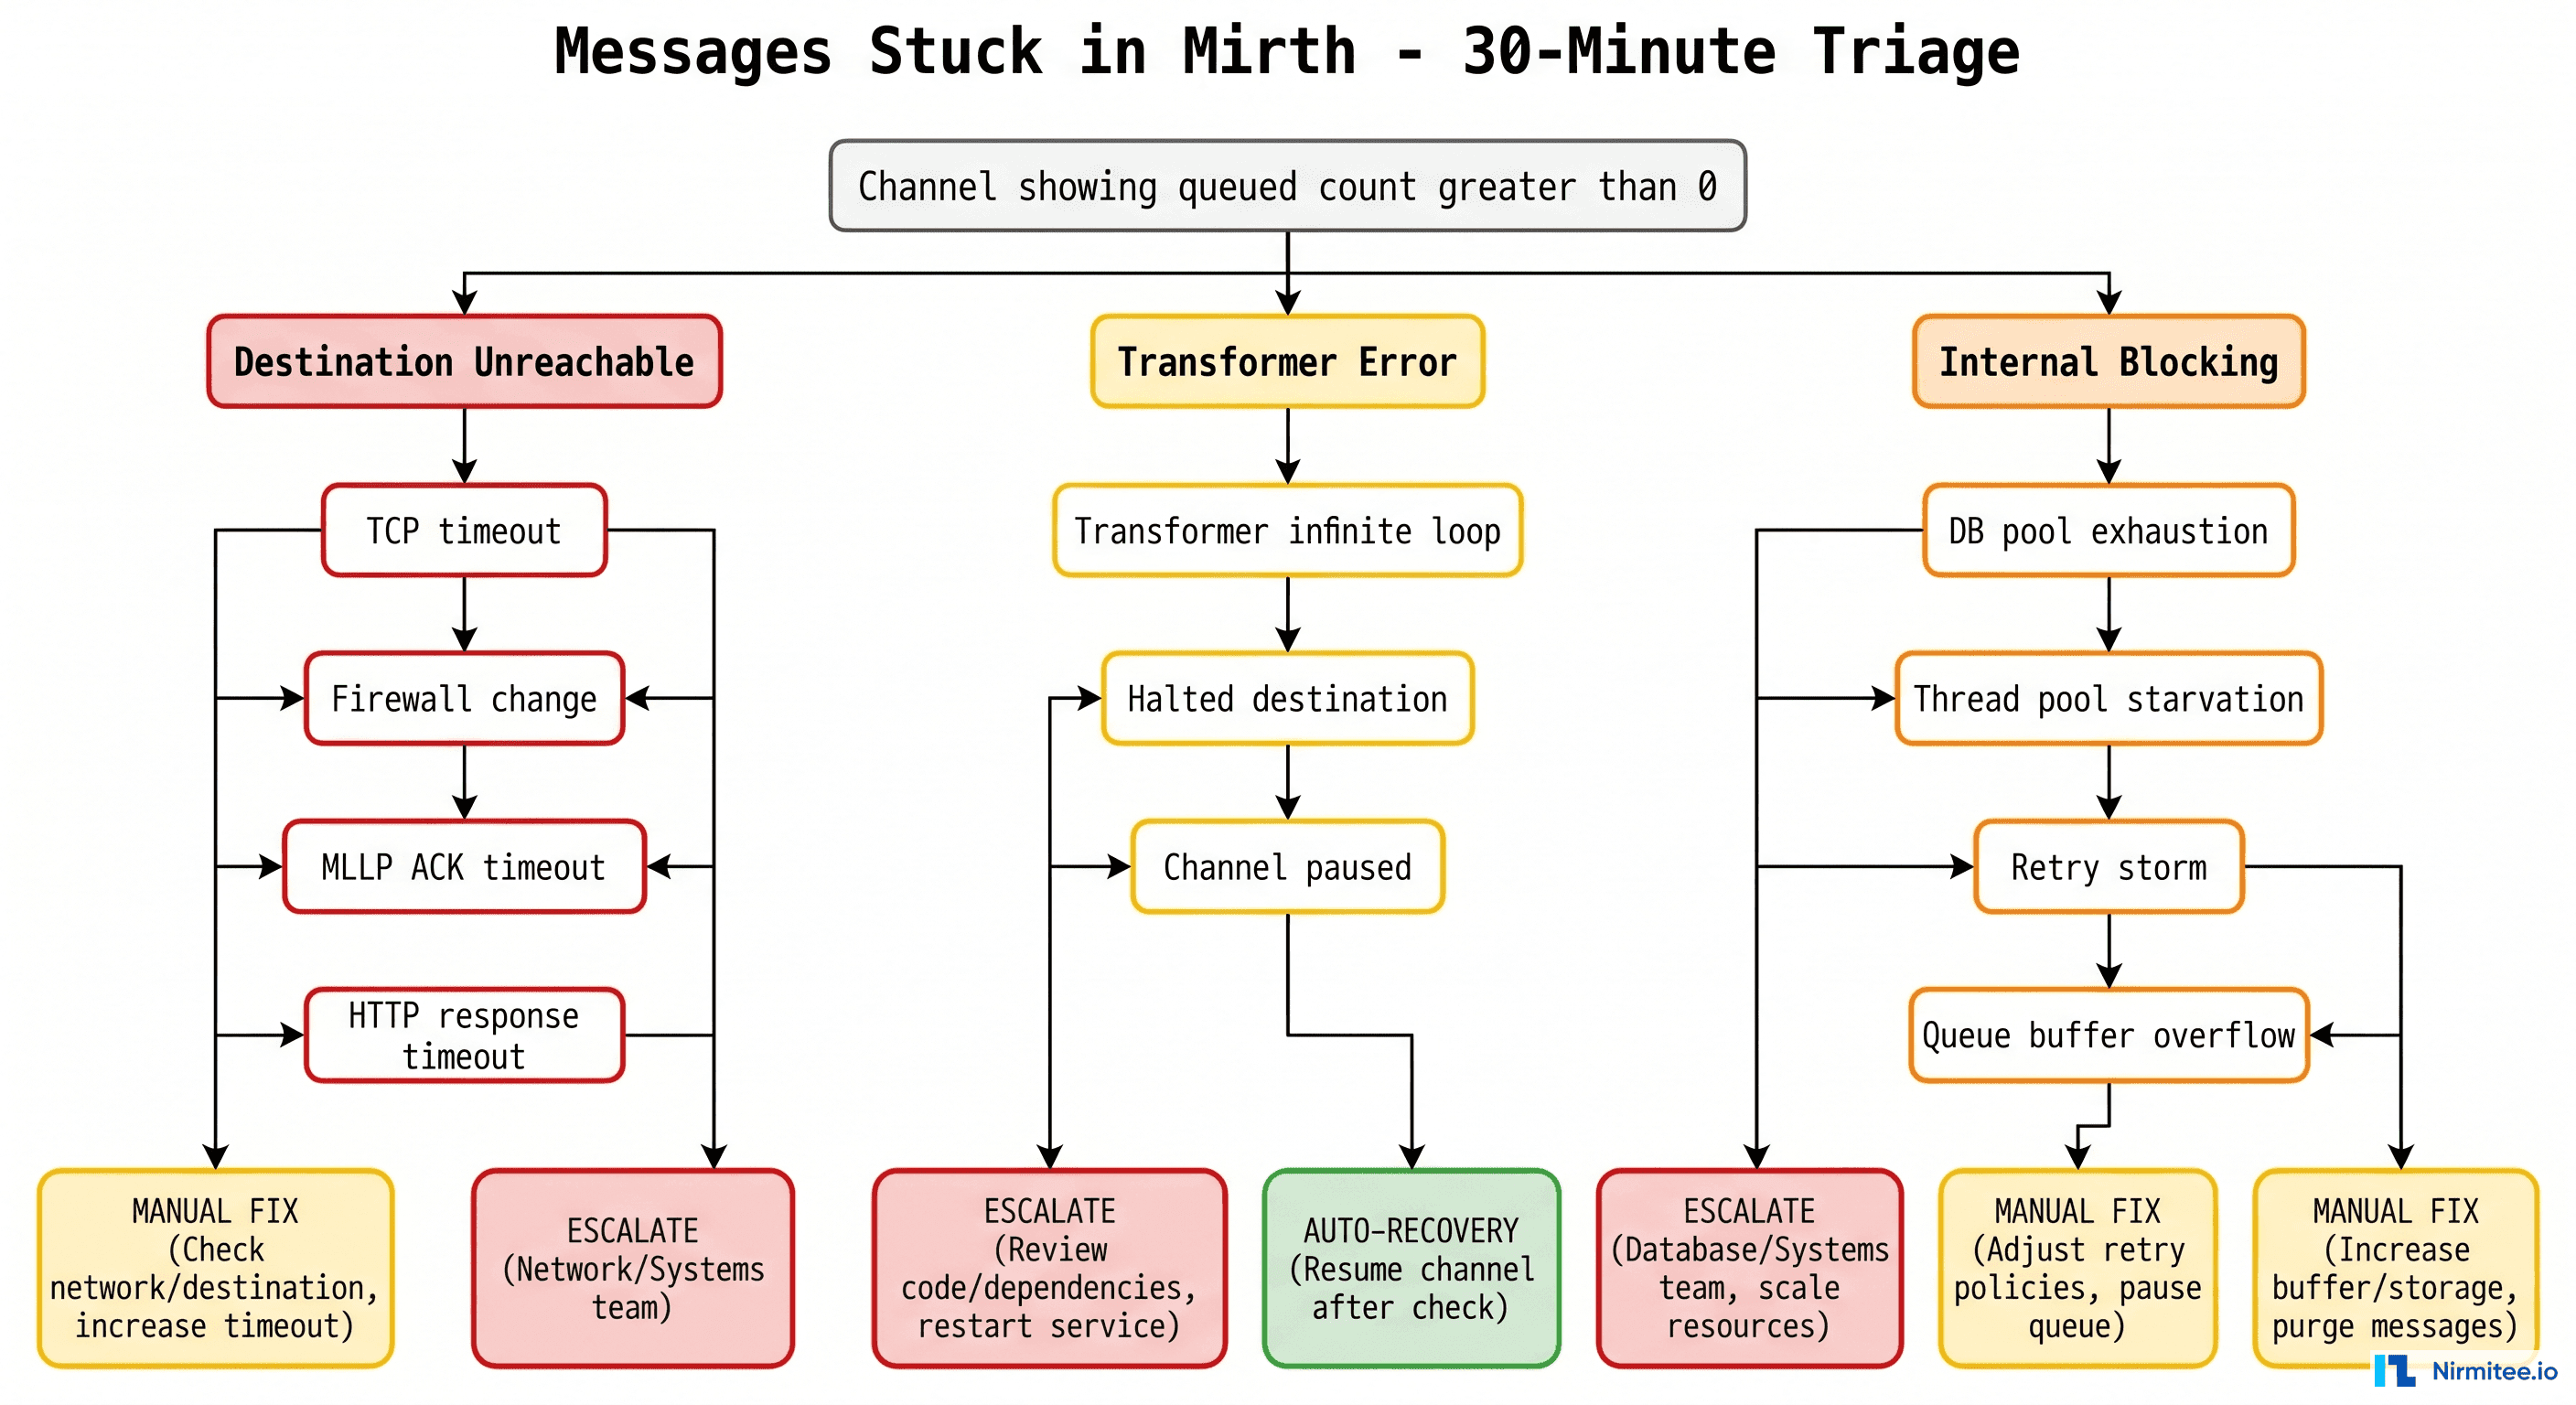
- Ask nursing unit to confirm access restoredRunbook: Mirth Connect Channel Stopped
# Runbook: Mirth Channel Stopped
# Severity: P2 (P1 if ADT or critical lab feed)
# Owner: Integration Team

## Detection
- Mirth dashboard shows channel STOPPED status
- OR: Downstream system reports missing messages

## Immediate Actions
1. Identify which channel is stopped:
   # Mirth CLI or REST API
   curl -s -k https://mirth:8443/api/channels/statuses \
     -H "X-Requested-With: XMLHttpRequest" \
     -u admin:admin | python3 -c "
     import json,sys
     for ch in json.load(sys.stdin)['list']['dashboardStatus']:
       if ch['state'] != 'STARTED':
         print(f\"STOPPED: {ch['name']} (id: {ch['channelId']})\")
   "

2. Check channel error log:
   # Via Mirth REST API
   curl -s -k https://mirth:8443/api/channels/{channelId}/messages?status=ERROR

3. Common fixes:
   - Destination unreachable: Check downstream system health
   - Queue overflow: Clear errored messages, restart channel
   - Certificate expired: Check TLS cert expiry dates
   - Out of memory: Restart Mirth service, increase heap

4. Restart channel:
   curl -X POST -k https://mirth:8443/api/channels/{channelId}/_start

## Verify
- Channel status returns to STARTED
- Message throughput resumes (check sent count)
- No new errors in channel log for 5 minutes
Runbook: FHIR Server 5xx Errors
# Runbook: FHIR Server 5xx Errors
# Severity: P2 (P1 if error rate > 50%)
# Owner: Platform Team

## Immediate Actions
1. Check error rate and pattern:
   # Prometheus query
   sum(rate(http_requests_total{service="fhir-server",status=~"5.."}[5m]))
   / sum(rate(http_requests_total{service="fhir-server"}[5m]))

2. Check which endpoints are failing:
   kubectl logs -n fhir deployment/fhir-server --tail=100 | grep "5[0-9][0-9]"

3. Common causes:
   - Database connection pool exhaustion
   - Out of memory (check pod memory usage)
   - Slow queries blocking connection pool
   - Upstream service timeout (terminology server, auth server)

4. Quick fixes:
   # Restart pods (rolling)
   kubectl rollout restart deployment/fhir-server -n fhir

   # Scale up if load-related
   kubectl scale deployment/fhir-server -n fhir --replicas=5

   # Kill long-running queries
   psql -c "SELECT pg_terminate_backend(pid) FROM pg_stat_activity
            WHERE state = 'active' AND query_start < now() - interval '5 minutes';"
Incident Management Tools Compared for Healthcare
| Feature | PagerDuty | Rootly | incident.io |
|---|---|---|---|
| Alerting & On-Call | Industry leader; advanced scheduling, escalation policies, intelligent grouping | Basic alerting; relies on PagerDuty/OpsGenie integration for paging | Built-in on-call with Slack-native experience; growing fast |
| Incident Workflow | Good with Incident Response add-on; status pages, stakeholder notifications | Excellent — automated Slack channels, role assignment, timeline tracking | Excellent — Slack-first workflow, automated status pages, custom fields |
| Post-Incident Review | Basic postmortem templates; integrates with Jira for action items | Strong — auto-generated timelines, action item tracking, metrics | Strong — follow-up tracking, insights dashboard, learning culture features |
| HIPAA/Compliance | BAA available; SOC 2 Type II; used by major health systems | SOC 2 Type II; growing healthcare presence; no BAA published yet | SOC 2 Type II; BAA available on Enterprise plan |
| Healthcare Adoption | High — used by Intermountain, Mayo Clinic, many health systems | Growing — popular with health tech companies and digital health startups | Growing — strong in tech-forward healthcare orgs |
| Pricing | $21-49/user/month | Custom pricing; free tier available | $17-25/user/month; free tier for small teams |
| Best For | Large health systems needing enterprise-grade alerting with BAA | Teams wanting automated incident workflows with existing PagerDuty | Slack-first teams wanting modern incident management with compliance |
For most healthcare organizations, the recommendation is: PagerDuty for alerting + Rootly or incident.io for incident workflow. PagerDuty's alerting engine and BAA support make it the safest choice for paging. Rootly and incident.io add the workflow automation that PagerDuty's native incident response lacks.
The Intermountain Healthcare Model: 99.99% Uptime with SRE
Intermountain Healthcare's digital platform team achieved 99.99% uptime (less than 53 minutes of downtime per year) by adopting Site Reliability Engineering (SRE) principles adapted for healthcare:
- Error budgets tied to clinical impact. Instead of abstract SLOs, their error budget is defined as "maximum acceptable minutes where a clinician cannot access patient data per quarter." This makes SLO conversations concrete for clinical leadership.
- Toil reduction as a first-class priority. They measured that on-call engineers spent 40% of time on repetitive manual tasks (restarting channels, clearing queues, rotating certificates). Automating these tasks reduced pages by 60%.
- Game days for clinical scenarios. Quarterly exercises simulate realistic failures: "EHR is down during a mass casualty event" or "Lab results interface goes dark during overnight shift." Clinical staff participate alongside IT.
- Incident commander rotation includes clinical liaisons. Every P1 incident has a clinical liaison in the war room who translates technical status into clinical impact and coordinates workaround communication with nursing units.
The key takeaway: healthcare SRE isn't about uptime percentages; it's about patient safety minutes. When you frame reliability in terms of clinical impact, you get executive support for the infrastructure investments that matter.
Building Your Incident Management Practice: A 90-Day Roadmap
Days 1-30: Foundation
- Define severity levels with healthcare-specific criteria (use the matrix above).
- Set up PagerDuty with on-call rotations for your team.
- Create three runbooks for your most common incidents.
- Establish the #incident-active Slack channel and notification templates.
- Identify your clinical liaison for P1 incidents.
Days 31-60: Automation
- Implement Prometheus alerting with healthcare-specific rules (FHIR response time, Mirth channel health, database connections).
- Set up automated Slack channel creation for incidents (Rootly or incident.io).
- Create synthetic monitoring for critical clinical paths.
- Automate the P1 notification workflow: page triggers Slack channel + clinical liaison notification + help desk script update.
Days 61-90: Maturity
- Conduct your first game day exercise with clinical staff participation.
- Implement SLOs tied to clinical impact metrics.
- Run monthly alert review sessions (delete alerts nobody acts on).
- Start tracking MTTR, MTTA, and pages-per-rotation trends.
Looking to build a robust healthcare platform? Our Healthcare Software Product Development team turns complex requirements into production-ready systems. Talk to our team to get started.
Frequently Asked Questions
How does healthcare incident management differ from standard IT incident management?
Healthcare incident management adds three dimensions that standard ITIL or SRE frameworks don't address: patient safety impact assessment, HIPAA compliance evaluation (including breach notification timelines), and clinical workflow continuity. Every incident must answer "Was patient care degraded?" — a question that never arises when managing an e-commerce platform.
What's the difference between MTTR and MTTA, and which matters more for healthcare?
MTTA (Mean Time to Acknowledge) measures how quickly your team responds to an alert. MTTR (Mean Time to Resolve) measures total outage duration. For healthcare, MTTA is arguably more critical because the gap between alert and acknowledgment is when incidents escalate from P3 to P1. A team that acknowledges in 2 minutes and resolves in 60 is safer than one that acknowledges in 30 minutes and resolves in 45.
Should we build incident management in-house or use a platform like PagerDuty?
Use a platform. Building in-house means maintaining paging infrastructure, on-call scheduling, escalation logic, and mobile apps. PagerDuty, OpsGenie, or incident.io give you all of this with BAA support for HIPAA compliance. The cost ($20-50/user/month) is trivial compared to the engineering time to build and maintain it. Spend your engineering effort on healthcare-specific runbooks and clinical integration, not paging infrastructure.
How do we handle incidents that span multiple vendor systems (Epic, lab vendor, pharmacy network)?
Establish pre-negotiated escalation paths with each vendor. Know your Epic Technical Services support tier and SLA. Know your lab vendor's after-hours contact. During a P1 incident, your incident commander should be able to open a vendor case within 5 minutes, not scramble for a phone number. Maintain a vendor contact sheet in your runbook repository and test it quarterly.
What metrics should we track to measure incident management maturity?
Start with five: MTTA (target under 5 min for P1), MTTR (target under 60 min for P1), incident count by severity (trend should decrease), pages per on-call rotation (target under 5 per night), and action item completion rate from post-incident reviews (target 90% completed within 30 days). Track these monthly and share with clinical IT leadership to maintain visibility and support.
Conclusion
Healthcare incident management is not a technology problem; it's a patient safety discipline that uses technology. The $7,900/minute figure captures attention, but the real motivation is simpler: when systems fail, clinicians lose access to the information they need to care for patients. Every minute of downtime is a minute where clinical decisions are made with incomplete data.
Build your incident management practice on three pillars: classify ruthlessly (use healthcare-specific severity levels), communicate proactively (clinical stakeholders need different information than engineers), and learn relentlessly (every incident is a gift of information about your system's weaknesses). Start with the 90-day roadmap above, and you'll be measurably more resilient within a quarter.
For teams building the monitoring foundation that feeds into incident management, our Streaming Healthcare Data with Kafka and FHIR guide covers real-time alerting pipelines, and our Event-Driven EHR Architecture guide shows how to move from polling to real-time event detection.