It is 7:15 AM. Your interface team logs into their morning standup and the first question is always the same: "Did anything break overnight?" Without a dedicated integration dashboard, answering this question requires checking Mirth Connect's channel status, querying the database for error counts, scanning email inboxes for downstream system alerts, and hoping someone set up a log query correctly.
This reactive approach works until it does not. A lab results channel silently drops 200 ORU messages at 2 AM because the downstream LIS was offline for maintenance. No one notices until a nurse calls at 9 AM asking why a patient's blood work is missing. By then, the damage is compounded: the queue has backed up, messages are out of order, and the clinical team has lost trust in the integration layer.
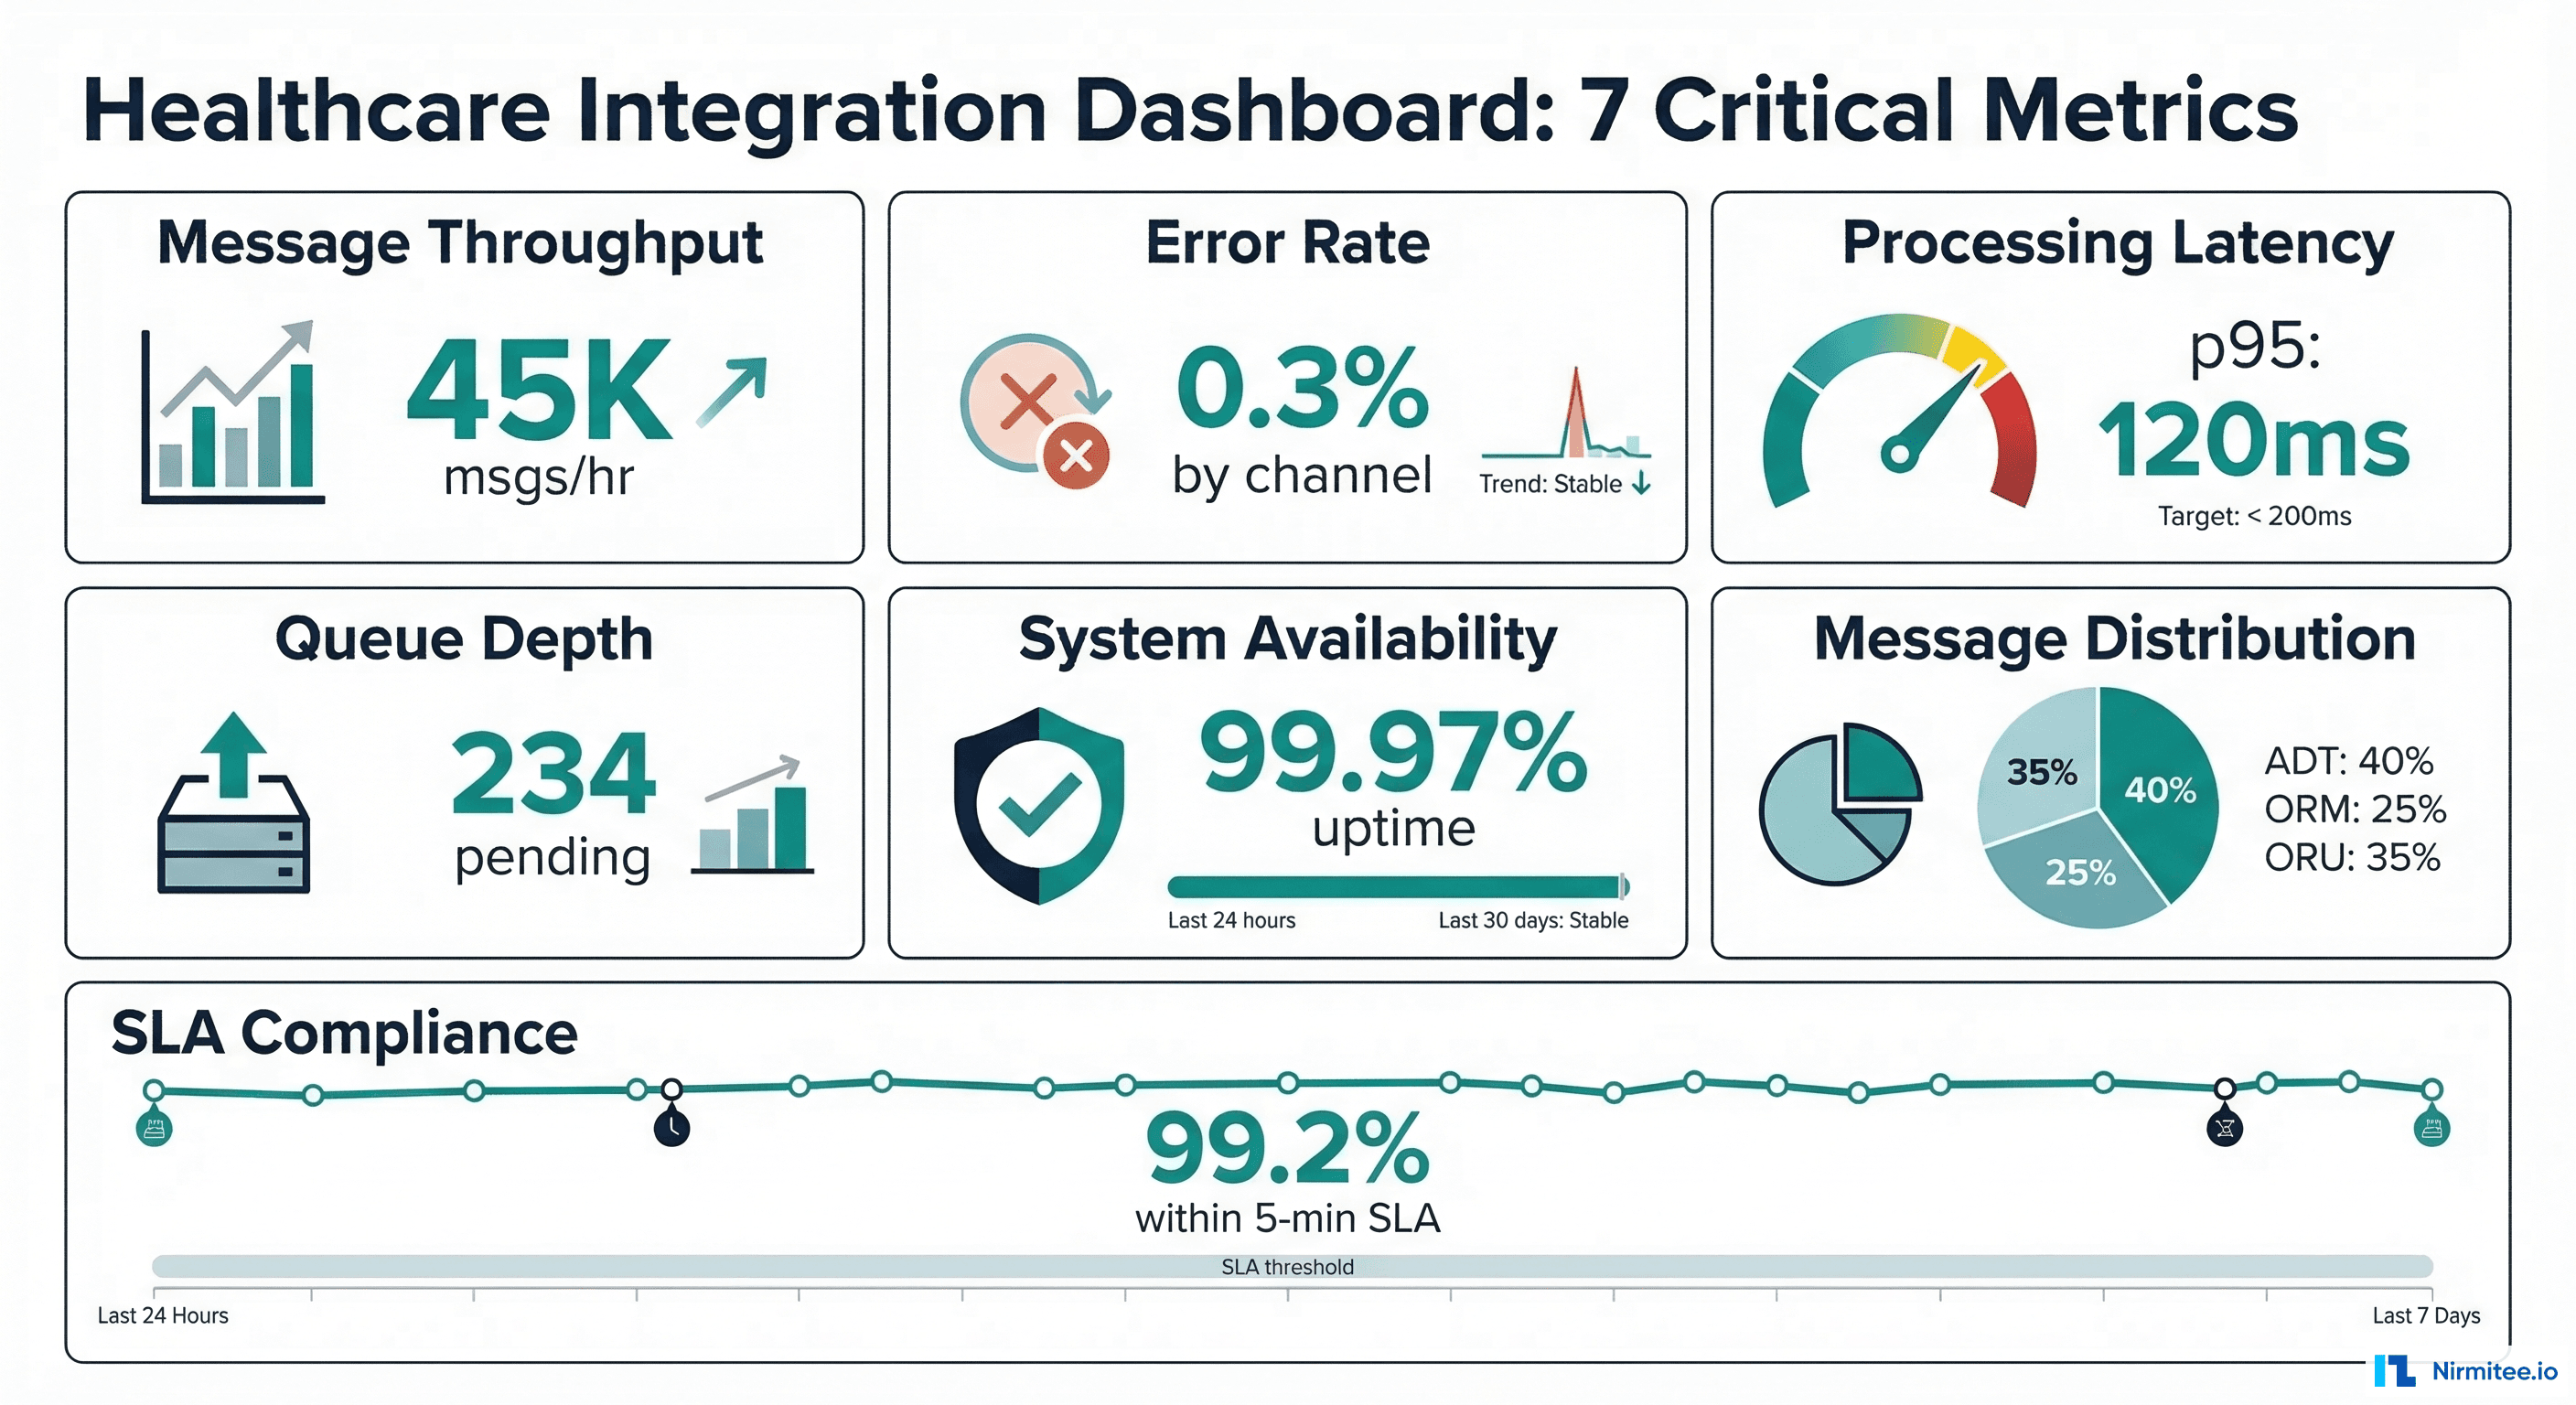
We have built and operated healthcare integration dashboards for health systems processing 50,000+ messages daily across dozens of channels. The seven metrics in this guide are the ones that actually prevent incidents -- not vanity metrics that look good in a slide deck but never trigger an actionable response.
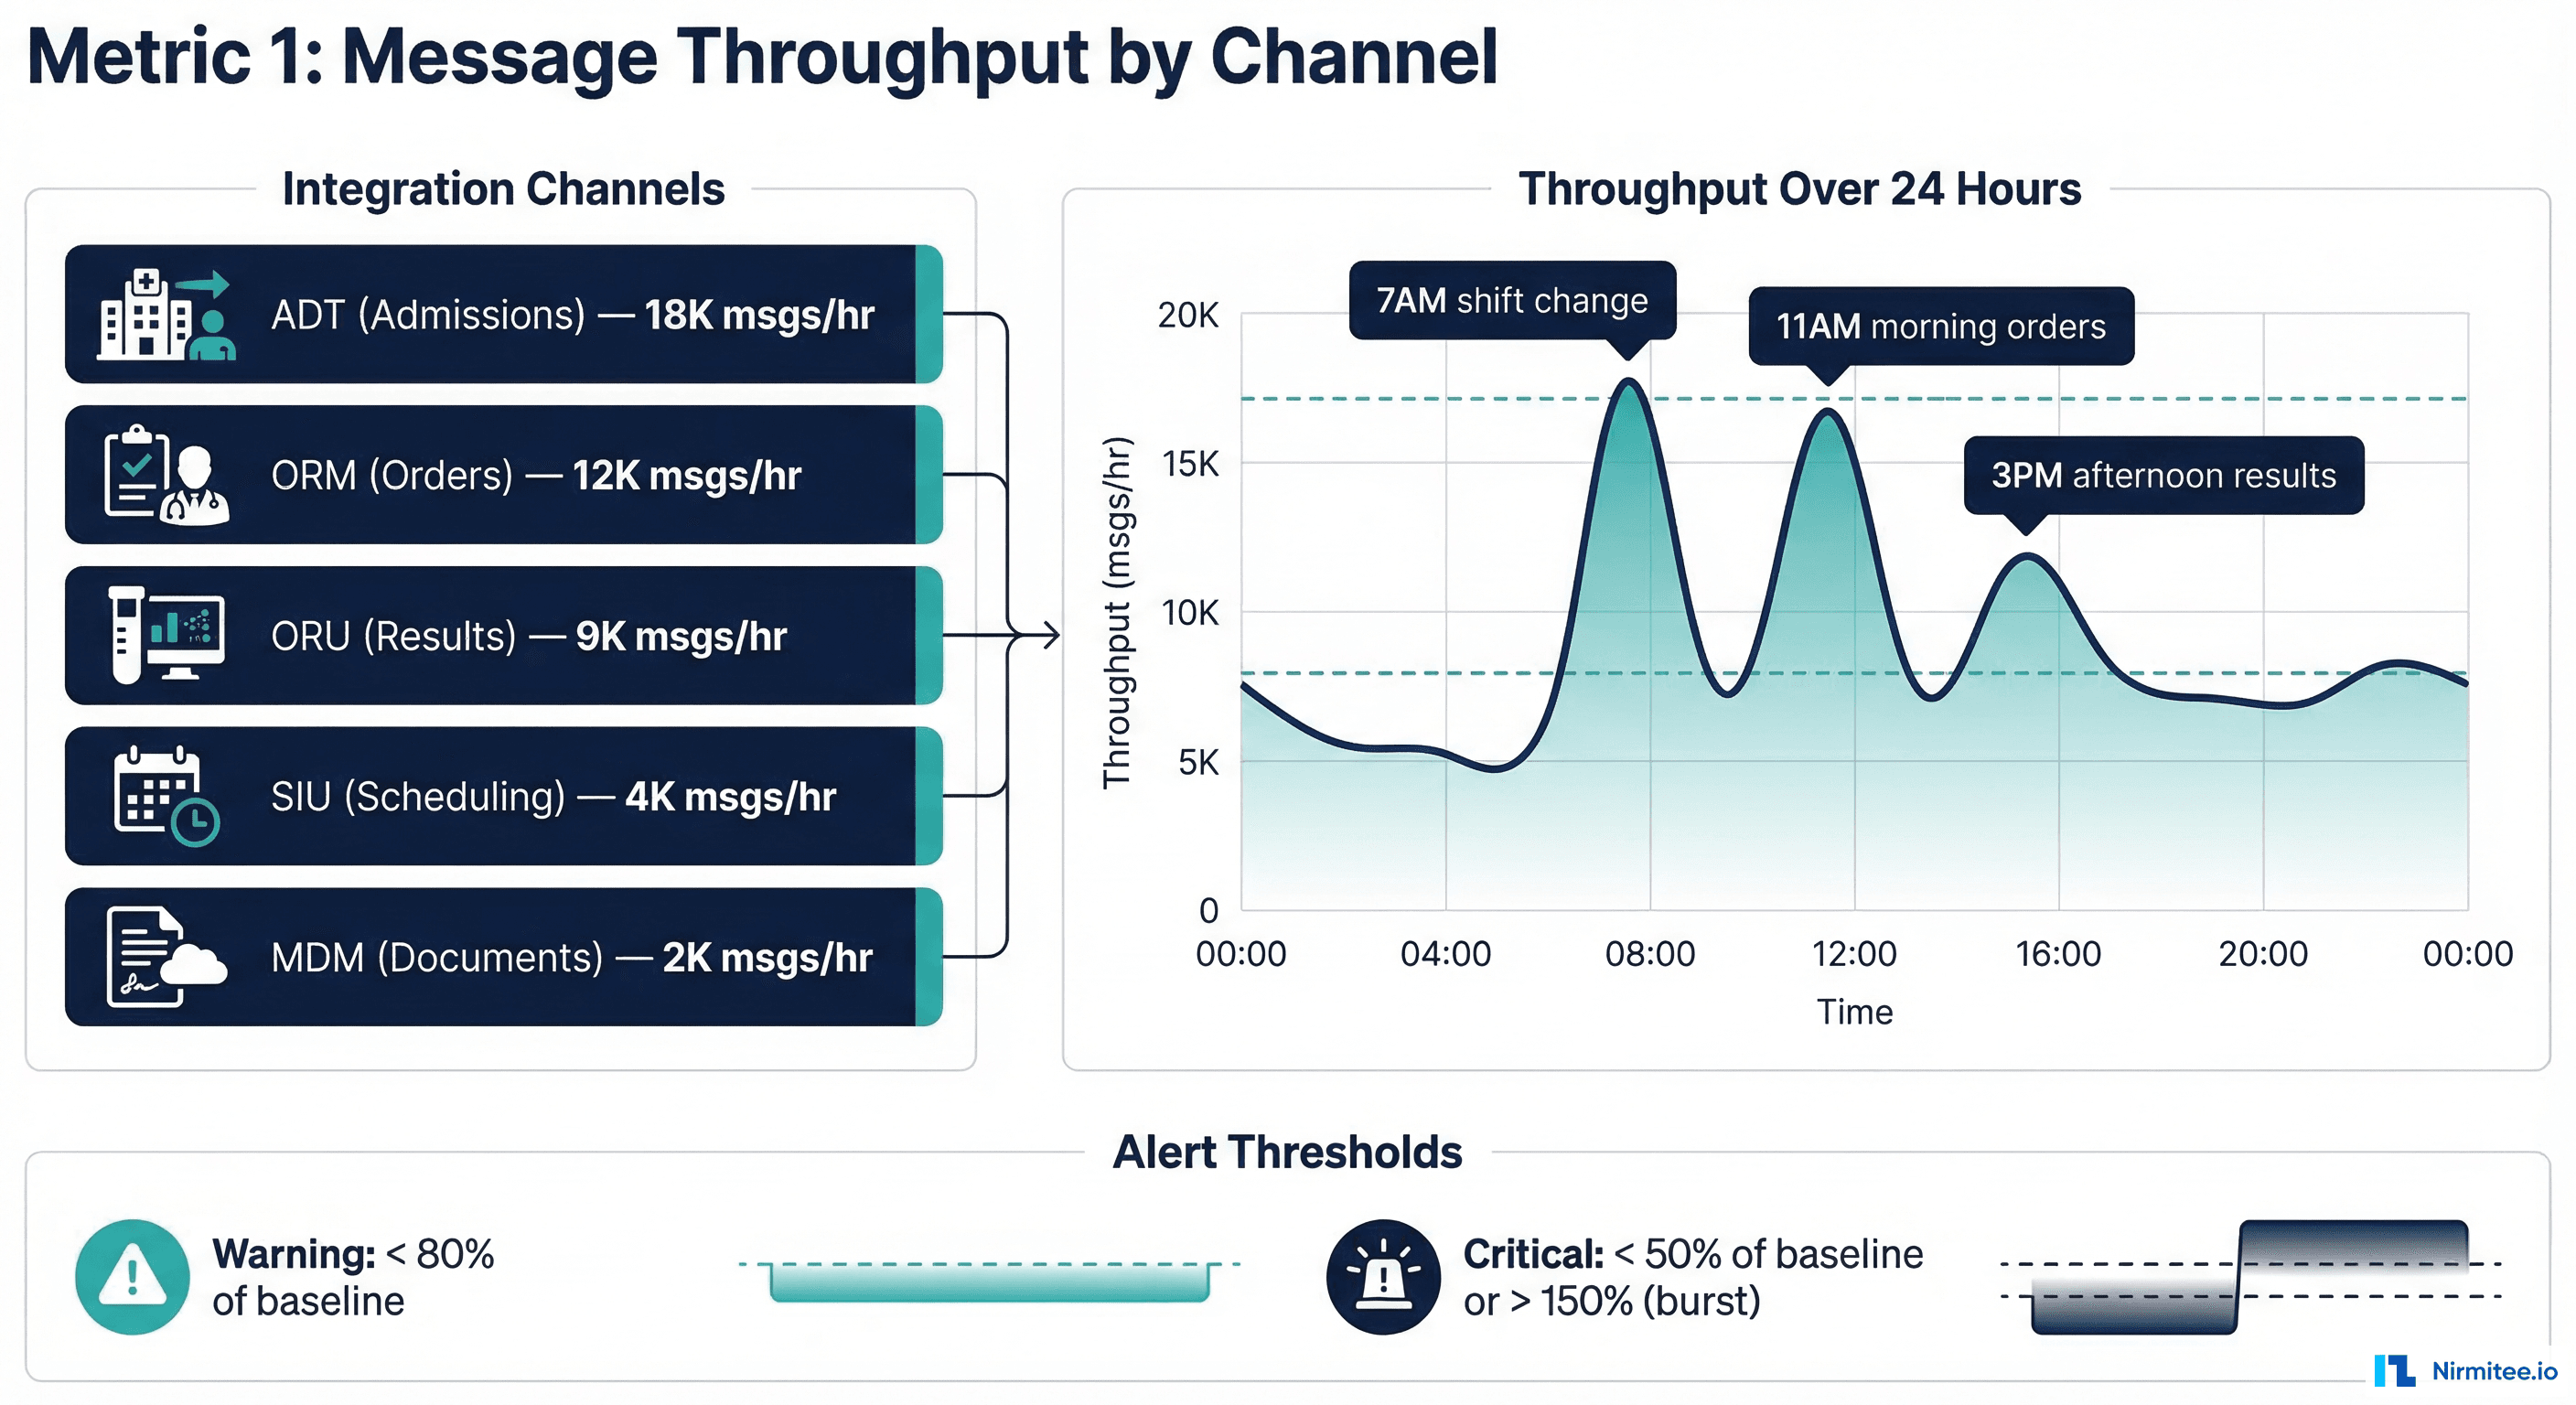
Metric 1 — Message Throughput by Channel
Message throughput is the heartbeat of your integration engine. It tells you whether messages are flowing at expected volumes -- and more importantly, when they stop flowing.
What to Track
- Messages per hour by channel -- not aggregate, not daily. Hourly granularity catches drops within a shift.
- Baseline comparison -- compare current throughput against the same hour last week, same day last month. Healthcare message volumes follow predictable circadian patterns (peak during morning rounds, trough at 3 AM).
- Zero-message detection -- the most dangerous failure mode is a channel that stops receiving messages entirely. A throughput of zero for 15+ minutes during business hours is almost always an upstream system failure.
Why It Matters
A 2023 CHIME survey found that 67% of healthcare integration incidents are detected by end users (clinicians, billing staff) rather than IT monitoring. By tracking throughput, your team catches the "silent failure" -- a channel that appears healthy (no errors, process running) but has stopped receiving messages because the upstream system is down or misconfigured.
Grafana Panel Configuration
{
  "title": "Message Throughput by Channel",
  "type": "timeseries",
  "datasource": "Prometheus",
  "targets": [
    {
      "expr": "sum(rate(mirth_messages_received_total[5m])) by (channel_name) * 3600",
      "legendFormat": "{{channel_name}}"
    }
  ],
  "fieldConfig": {
    "defaults": {
      "unit": "msgs/hr",
      "thresholds": {
        "mode": "absolute",
        "steps": [
          { "color": "red", "value": 0 },
          { "color": "yellow", "value": 100 },
          { "color": "green", "value": 500 }
        ]
      }
    }
  },
  "alert": {
    "name": "Zero Throughput Alert",
    "conditions": [
      {
        "evaluator": { "type": "lt", "params": [1] },
        "query": { "params": ["A", "15m", "now"] },
        "reducer": { "type": "sum" }
      }
    ],
    "frequency": "5m",
    "for": "15m"
  }
}
Alert Thresholds
| Severity | Condition | Response |
|---|---|---|
| Critical | Zero messages for 15+ min (business hours) | Page on-call engineer immediately |
| Warning | Throughput < 50% of baseline for 30+ min | Slack notification to interface team |
| Info | Throughput > 200% of baseline for 15+ min | Log for capacity planning review |
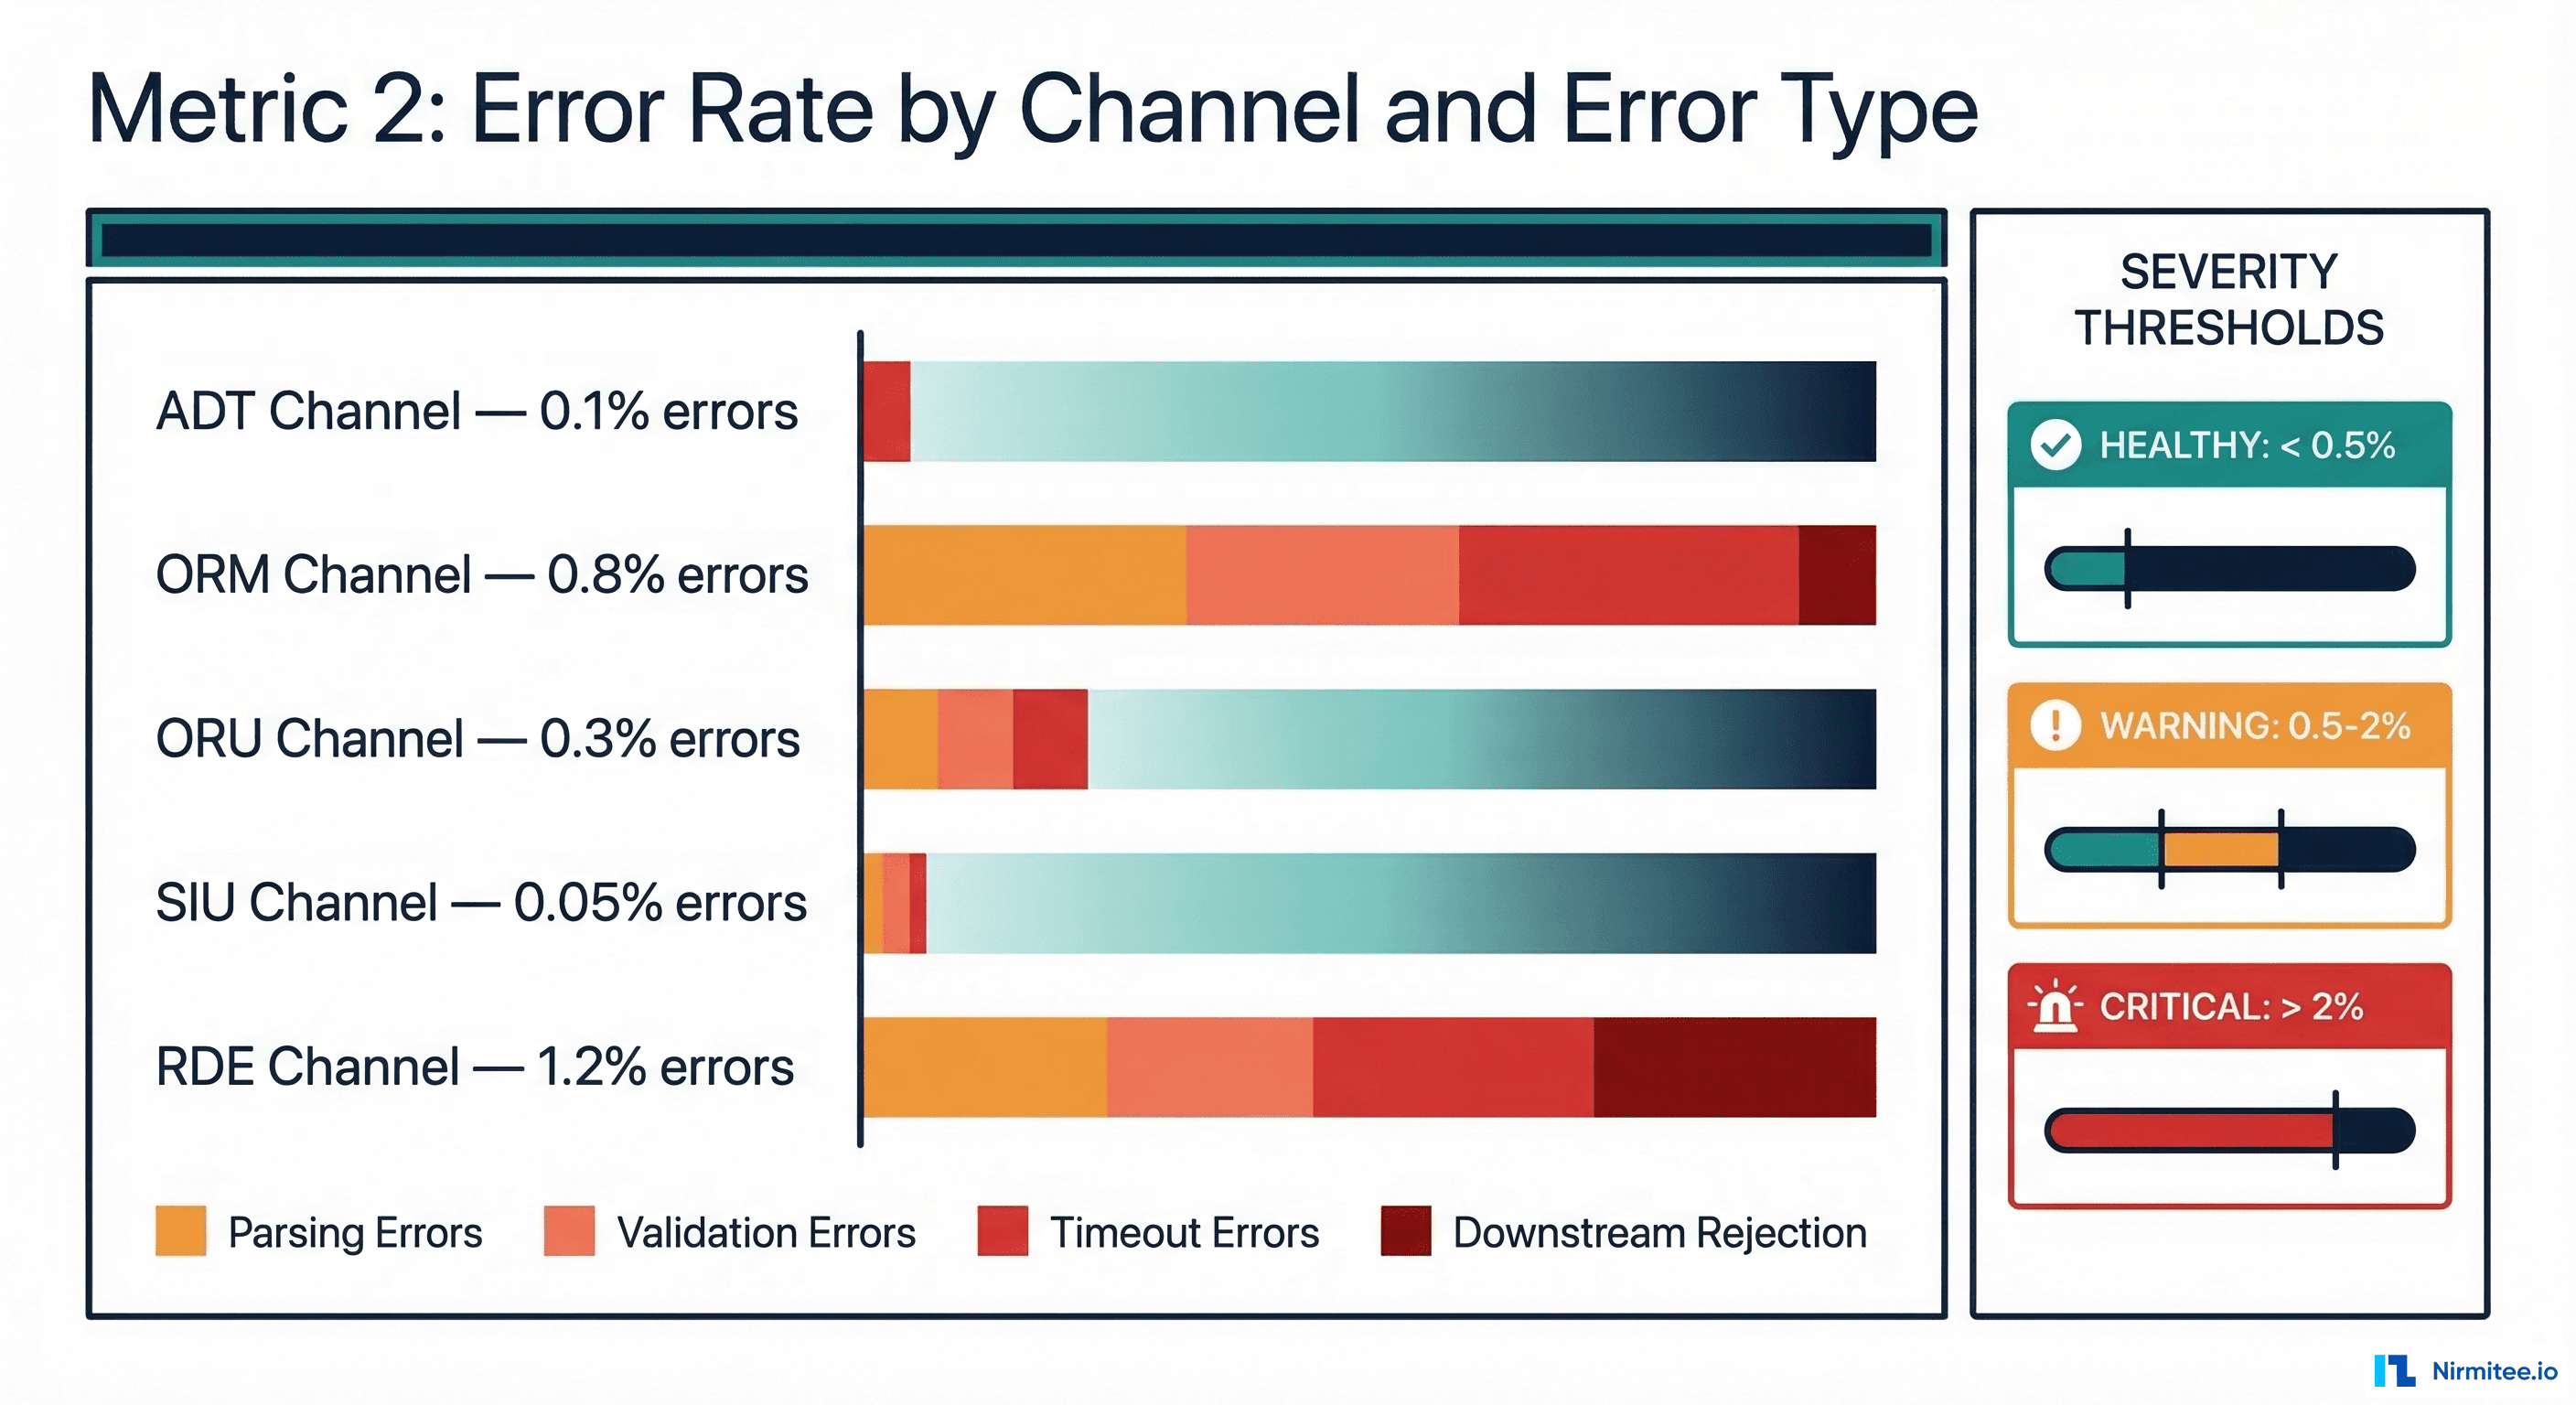
Metric 2 — Error Rate by Channel
Error rate is the most obvious metric, yet most teams measure it incorrectly. The mistake is tracking a single aggregate error percentage across all channels. A 0.5% overall error rate sounds acceptable -- until you realize the ORM (orders) channel has a 3% error rate that is masked by the high-volume, low-error ADT channel.
What to Track
- Error rate per channel -- each channel has different acceptable error rates based on message complexity and downstream system reliability.
- Error rate by type -- parsing errors (malformed HL7), validation errors (missing required fields), timeout errors (downstream unresponsive), and rejection errors (downstream actively refused the message).
- Error trend -- a channel with a steady 0.2% error rate is healthy. A channel whose error rate jumped from 0.2% to 0.8% in the last hour has a developing problem.
Error Classification Framework
-- Prometheus recording rules for error classification

groups:
  - name: integration_errors
    interval: 1m
    rules:
      # Error rate by channel
      - record: integration:error_rate:by_channel
        expr: |
          sum(rate(mirth_messages_errored_total[5m])) by (channel_name) /
          sum(rate(mirth_messages_received_total[5m])) by (channel_name) * 100

      # Error rate by type
      - record: integration:error_rate:by_type
        expr: |
          sum(rate(mirth_messages_errored_total[5m])) by (error_type) /
          sum(rate(mirth_messages_received_total[5m])) * 100

      # Error rate trend (current vs 1 hour ago)
      - record: integration:error_rate_increase
        expr: |
          integration:error_rate:by_channel -
          integration:error_rate:by_channel offset 1h
Severity Mapping for Healthcare
Not all errors have equal clinical impact. A failed scheduling message is inconvenient. A failed lab result message can delay diagnosis. Your error severity mapping should reflect clinical impact:
| Channel Type | Warning Threshold | Critical Threshold | Clinical Impact |
|---|---|---|---|
| ORU (Lab Results) | 0.5% | 1% | Delayed diagnosis, missed critical values |
| ORM (Orders) | 0.5% | 1% | Delayed treatment, duplicate orders |
| ADT (Admissions) | 1% | 2% | Patient identity issues, wrong-patient errors |
| RDE (Pharmacy) | 0.3% | 0.5% | Medication errors, dispensing delays |
| SIU (Scheduling) | 2% | 5% | Missed appointments, scheduling conflicts |
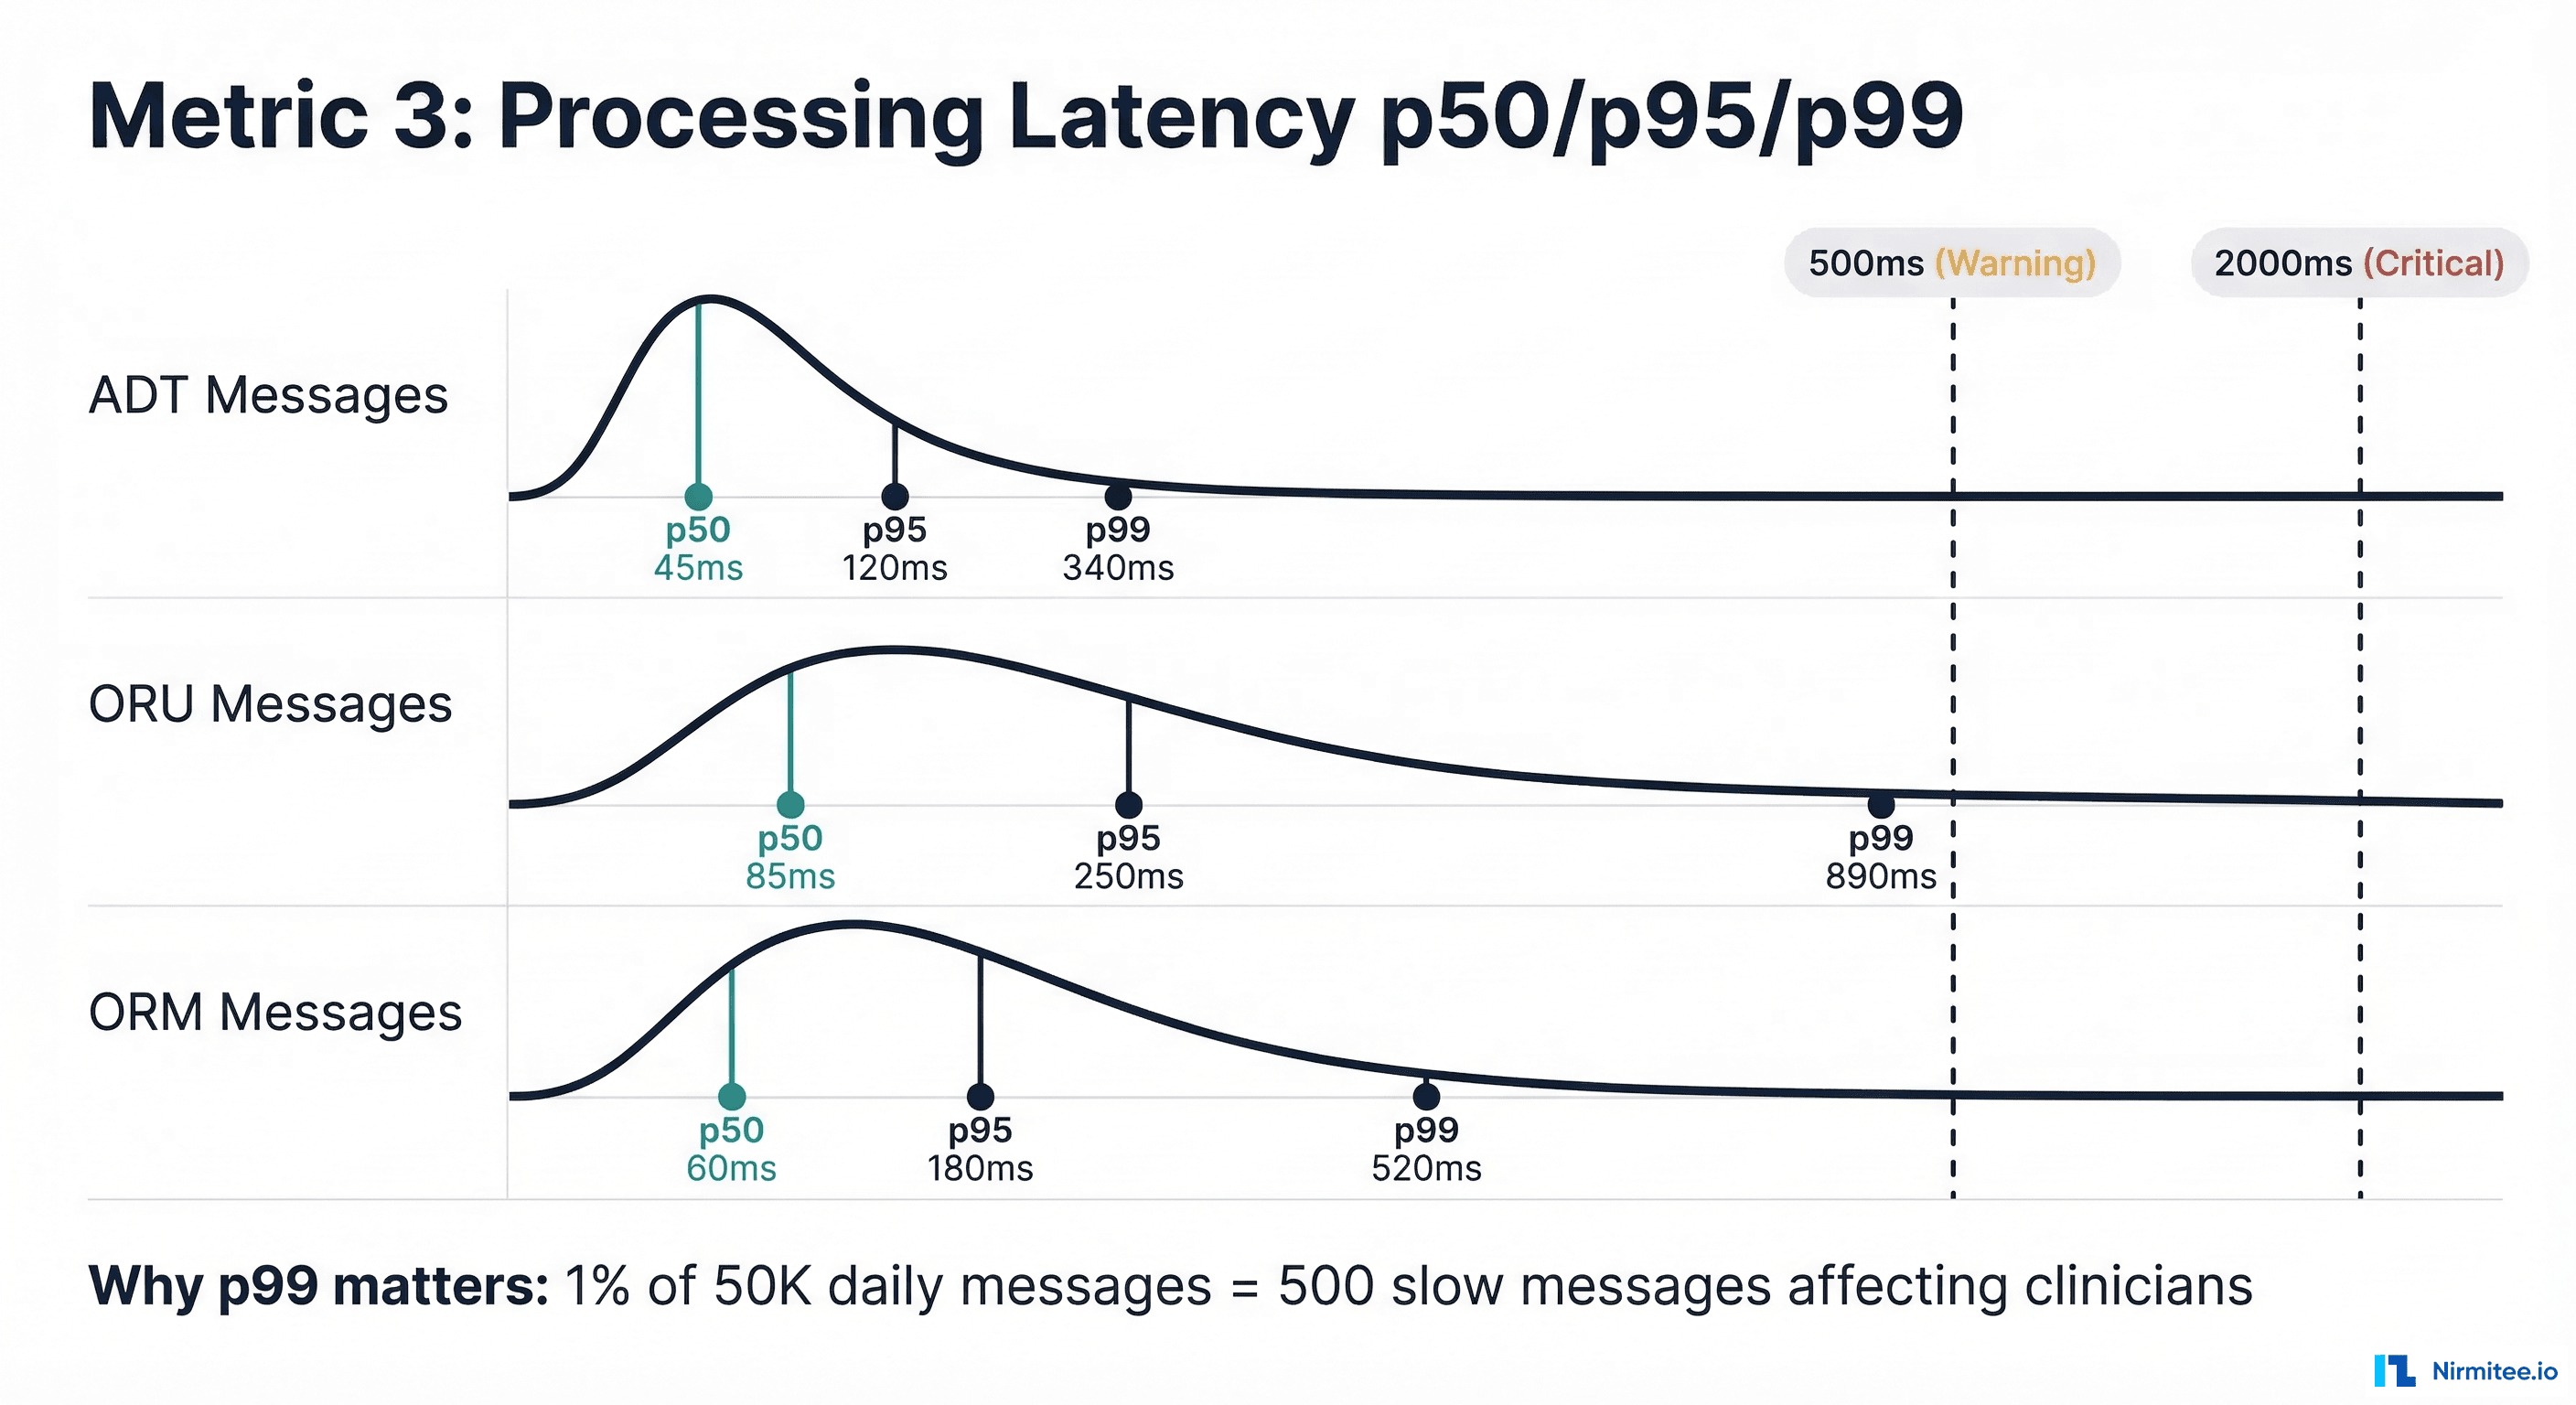
Metric 3 — Processing Latency p50/p95/p99
Average latency is a lie in healthcare integration. An average of 100ms sounds fast, but if the p99 is 5 seconds, then 1% of your messages -- potentially hundreds per hour -- are taking 50x longer than expected. In healthcare, those slow messages often correspond to complex clinical events (multi-segment ORU with 20+ OBX segments, ADT messages with extensive insurance data) that are disproportionately important.
Why Percentiles Matter
Consider a lab results channel processing 50,000 messages daily:
- p50 = 85ms: Half of messages process in under 85ms. Looks good.
- p95 = 250ms: 95% process in under 250ms. Still acceptable.
- p99 = 890ms: 99% process in under 890ms. This means 500 messages per day take nearly a second.
- p99.9 = 4,200ms: 50 messages per day take over 4 seconds. These are likely the complex critical-value results that need the fastest delivery.
Latency Measurement Points
Measure latency at three points to identify bottlenecks:
- Ingest latency: Time from message receipt to parsing completion. High ingest latency indicates parsing complexity or resource contention.
- Transform latency: Time for message transformation (HL7v2 to FHIR, data enrichment, routing logic). High transform latency points to complex mapping rules or external service calls.
- Delivery latency: Time from transformation completion to downstream acknowledgment. High delivery latency indicates downstream system performance issues.
{
"title": "Processing Latency Percentiles",
"type": "timeseries",
"datasource": "Prometheus",
"targets": [
{
"expr": "histogram_quantile(0.50, rate(mirth_message_processing_seconds_bucket[5m]))",
"legendFormat": "p50"
},
{
"expr": "histogram_quantile(0.95, rate(mirth_message_processing_seconds_bucket[5m]))",
"legendFormat": "p95"
},
{
"expr": "histogram_quantile(0.99, rate(mirth_message_processing_seconds_bucket[5m]))",
"legendFormat": "p99"
}
],
"fieldConfig": {
"defaults": {
"unit": "ms",
"thresholds": {
"steps": [
{ "color": "green", "value": 0 },
{ "color": "yellow", "value": 500 },
{ "color": "red", "value": 2000 }
]
}
}
}
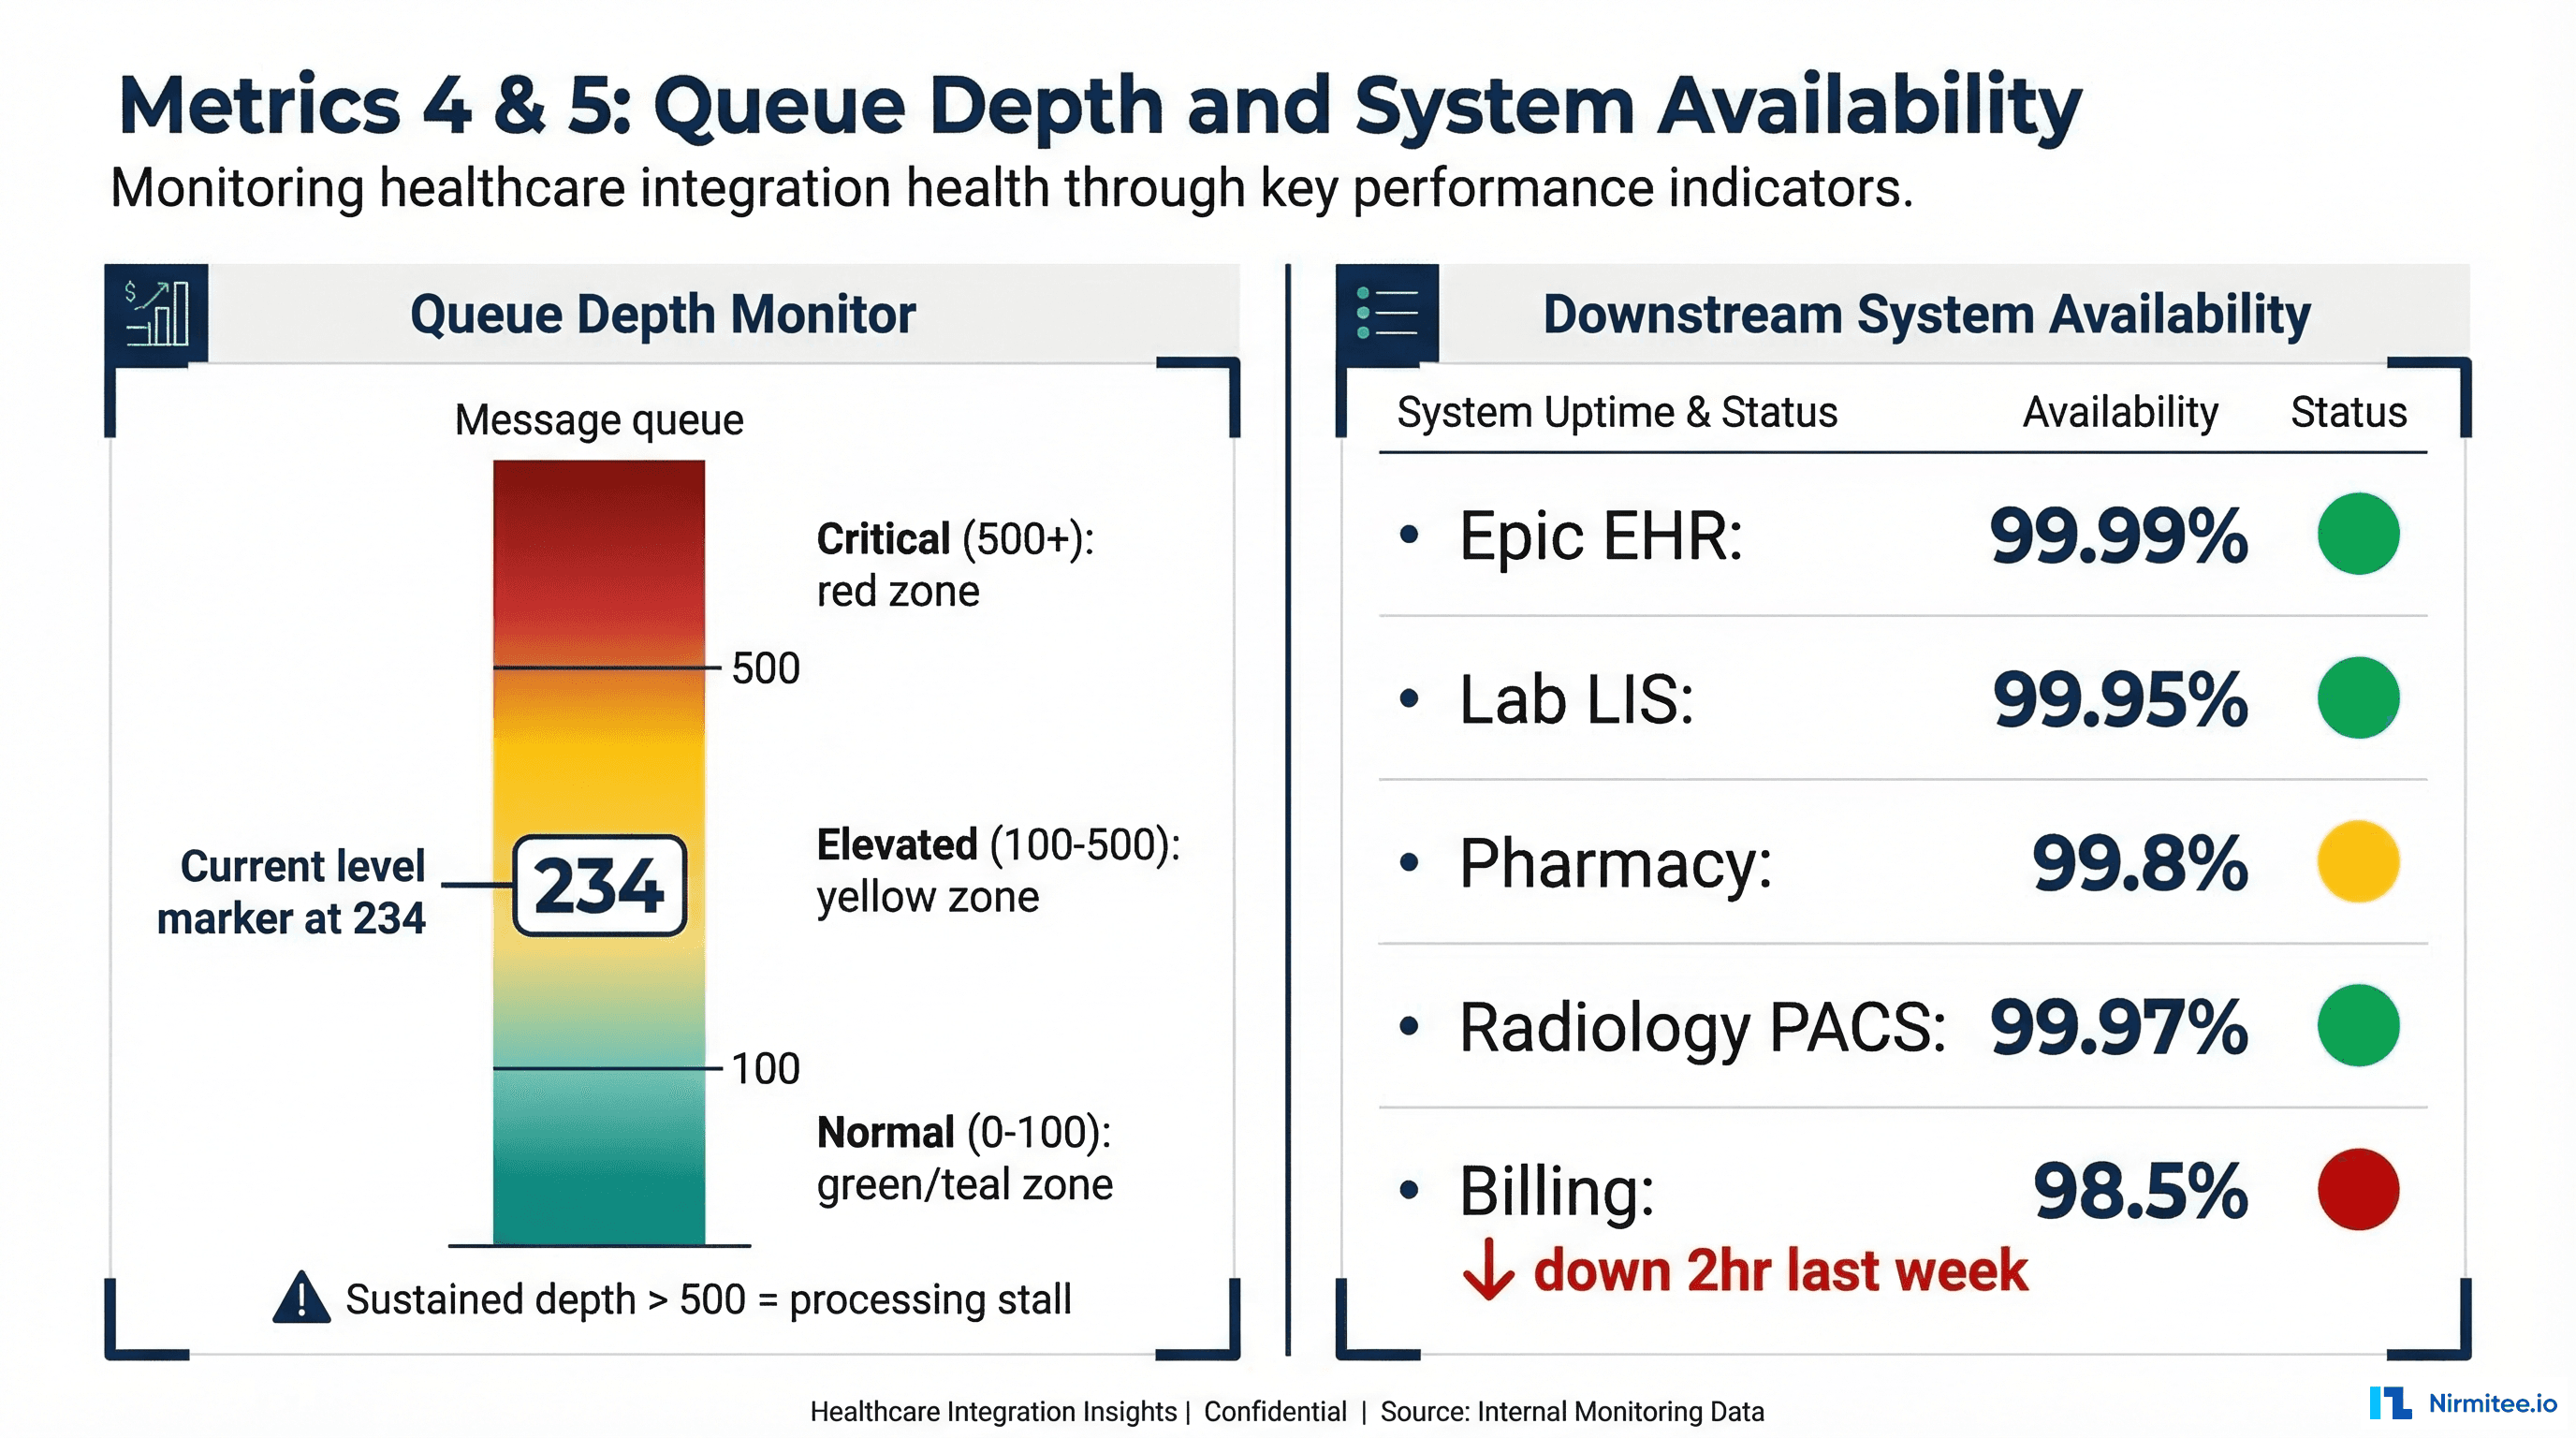
}Metric 4 — Queue Depth
Queue depth is the leading indicator that something is about to go wrong. While error rates and latency are lagging indicators (they tell you something that has already happened), queue depth tells you something is happening right now and will get worse if unaddressed.
What Queue Depth Tells You
- Growing queue (rate > 0): Messages are arriving faster than they are being processed. Either the processing rate has dropped (downstream issue), or the arrival rate has spiked (upstream event, such as an end-of-day batch).
- Stable non-zero queue: Normal during peak hours if the queue drains during off-peak. Concerning whether it never drains -- indicates chronic under-capacity.
- Queue at zero: Healthy during normal operations. Suspicious if the channel should be receiving messages -- it might mean nothing is being queued because nothing is arriving.
Queue Depth Alert Logic
# PagerDuty alert rules for queue depth

groups:
  - name: queue_depth_alerts
    rules:
      # Absolute depth threshold
      - alert: QueueDepthCritical
        expr: mirth_channel_queue_depth > 500
        for: 10m
        labels:
          severity: critical
          team: interface
        annotations:
          summary: "Queue depth > 500 on {{ $labels.channel_name }}"
          runbook: "https://wiki.internal/runbooks/queue-depth-critical"

      # Rate of growth (queue growing faster than draining)
      - alert: QueueGrowthRate
        expr: deriv(mirth_channel_queue_depth[15m]) > 10
        for: 15m
        labels:
          severity: warning
        annotations:
          summary: "Queue growing at {{ $value }} msgs/min on {{ $labels.channel_name }}"
Metric 5 — Downstream System Availability
Your integration engine is only as reliable as its downstream systems. A perfectly functioning Mirth Connect instance is useless if the Epic EHR it connects to is returning 503 errors. Yet most interface teams have no visibility into downstream system health until messages start failing.
Active Health Checks
Implement active health checks that run independently of message processing:
// Downstream health check configuration

const healthChecks = {
  "epic-ehr": {
    type: "tcp",
    host: "epic.hospital.internal",
    port: 6661,
    interval: "30s",
    timeout: "5s",
    unhealthyThreshold: 3,
    healthyThreshold: 2
  },
  "lab-lis": {
    type: "hl7-mllp",
    host: "lis.lab.internal",
    port: 2575,
    interval: "60s",
    testMessage: "MSH|^~\&|MONITOR|HIS|LIS|LAB|20260316||QRY^Q01|PING|P|2.5",
    expectedAck: "MSA|AA"
  },
  "fhir-server": {
    type: "http",
    url: "https://fhir.hospital.internal/fhir/metadata",
    method: "GET",
    interval: "30s",
    expectedStatus: 200,
    timeout: "10s"
  },
  "pharmacy": {
    type: "tcp",
    host: "rx.pharmacy.internal",
    port: 9100,
    interval: "30s",
    timeout: "5s"
  }
};
Availability Calculation
Track availability over rolling windows:
| Window | Target | Allowed Downtime | Use Case |
|---|---|---|---|
| 1 hour | 99.9% | 3.6 seconds | Real-time alerting |
| 24 hours | 99.95% | 43 seconds | Daily standup metric |
| 30 days | 99.9% | 43 minutes | SLA reporting |
| Quarter | 99.9% | 2.2 hours | Executive reporting |
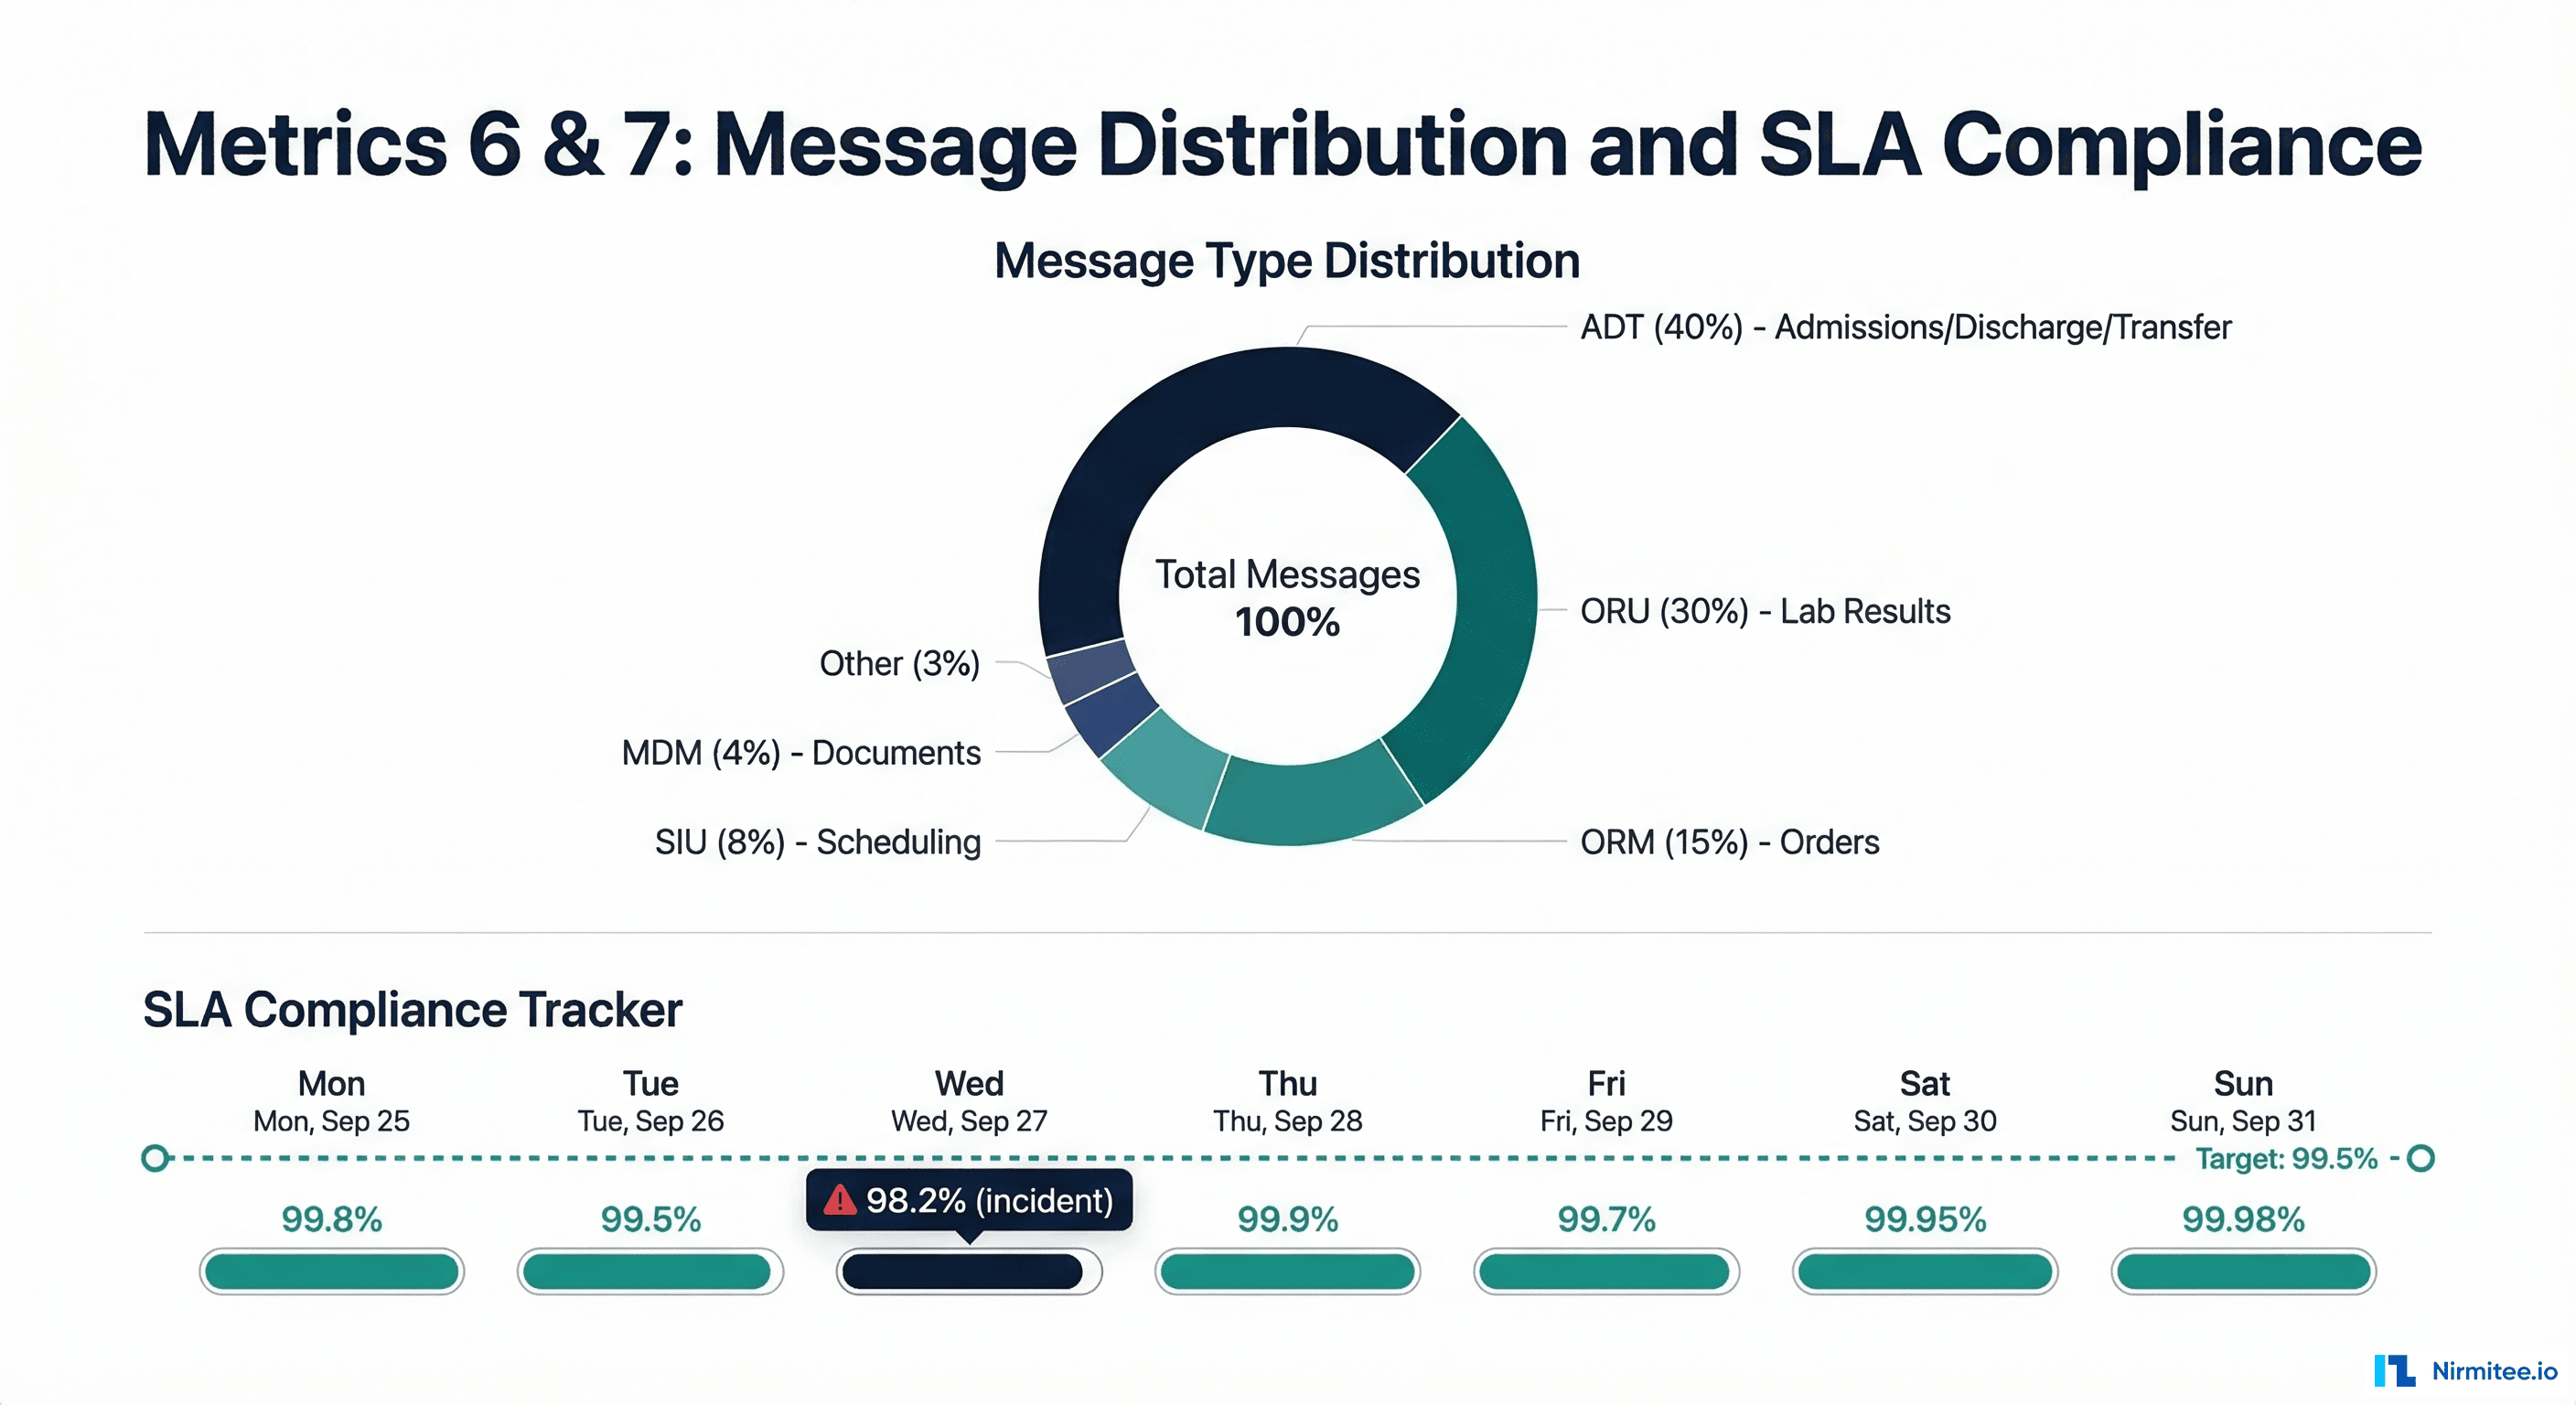
Metric 6 — Message Type Distribution
Message type distribution is your early warning system for upstream changes. When a trading partner upgrades their EHR, deploys a new module, or changes their message configuration, the first sign is often a shift in message type distribution -- not an error.
Notably, what
- Percentage by HL7 message type -- ADT, ORM, ORU, SIU, MDM, RDE. Compare against baseline weekly distribution.
- New message types or trigger events -- a sudden appearance of ADT^A60 (merge patient) messages when you have never received them before indicates an upstream workflow change.
- Segment count distribution -- a lab results channel that normally sends ORU messages with 5-10 OBX segments, suddenly sending messages with 50+ OBX segments suggests a new test panel or reporting change.
Anomaly Detection Query
# Detect distribution shifts using Z-score

groups:
  - name: distribution_anomalies
    rules:
      - alert: MessageTypeDistributionShift
        expr: |
          abs(
            (sum(rate(mirth_messages_received_total[1h])) by (message_type) /
             sum(rate(mirth_messages_received_total[1h])))
            -
            (sum(rate(mirth_messages_received_total[1h] offset 7d)) by (message_type) /
             sum(rate(mirth_messages_received_total[1h] offset 7d)))
          ) > 0.1
        for: 30m
        labels:
          severity: info
        annotations:
          summary: "Message type {{ $labels.message_type }} distribution shifted by > 10%"
Metric 7 — SLA Compliance
SLA compliance is the metric your business stakeholders care about. It translates all the technical metrics above into a single question: "Are we delivering messages within the agreed timeframes?"
Defining Healthcare Integration SLAs
Typical SLA targets vary by message clinical urgency:
| Message Category | SLA Target | Example | Consequence of Breach |
|---|---|---|---|
| Critical Results | 1 minute | Abnormal lab values (ORU with OBX-8 = "AA") | Delayed clinical intervention |
| Standard Results | 5 minutes | Normal lab results, radiology reports | Clinician workflow disruption |
| Orders | 2 minutes | Medication orders, lab orders | Treatment delay |
| Administrative | 15 minutes | ADT, scheduling, insurance updates | Administrative backlog |
| Batch/Non-urgent | 4 hours | Charge captures, claims, reports | Revenue cycle delay |
SLA Compliance Calculation
# SLA compliance Prometheus recording rule

groups:
  - name: sla_compliance
    rules:
      # Percentage of messages delivered within SLA
      - record: integration:sla_compliance:by_priority
        expr: |
          sum(rate(mirth_messages_delivered_within_sla_total[1h])) by (priority) /
          sum(rate(mirth_messages_delivered_total[1h])) by (priority) * 100

      # Overall SLA compliance (weighted by priority)
      - record: integration:sla_compliance:overall
        expr: |
          (
            sum(rate(mirth_messages_delivered_within_sla_total{priority="critical"}[1h])) * 3 +
            sum(rate(mirth_messages_delivered_within_sla_total{priority="standard"}[1h])) * 2 +
            sum(rate(mirth_messages_delivered_within_sla_total{priority="admin"}[1h])) * 1
          ) / (
            sum(rate(mirth_messages_delivered_total{priority="critical"}[1h])) * 3 +
            sum(rate(mirth_messages_delivered_total{priority="standard"}[1h])) * 2 +
            sum(rate(mirth_messages_delivered_total{priority="admin"}[1h])) * 1
          ) * 100
Building the Complete Dashboard — Grafana JSON
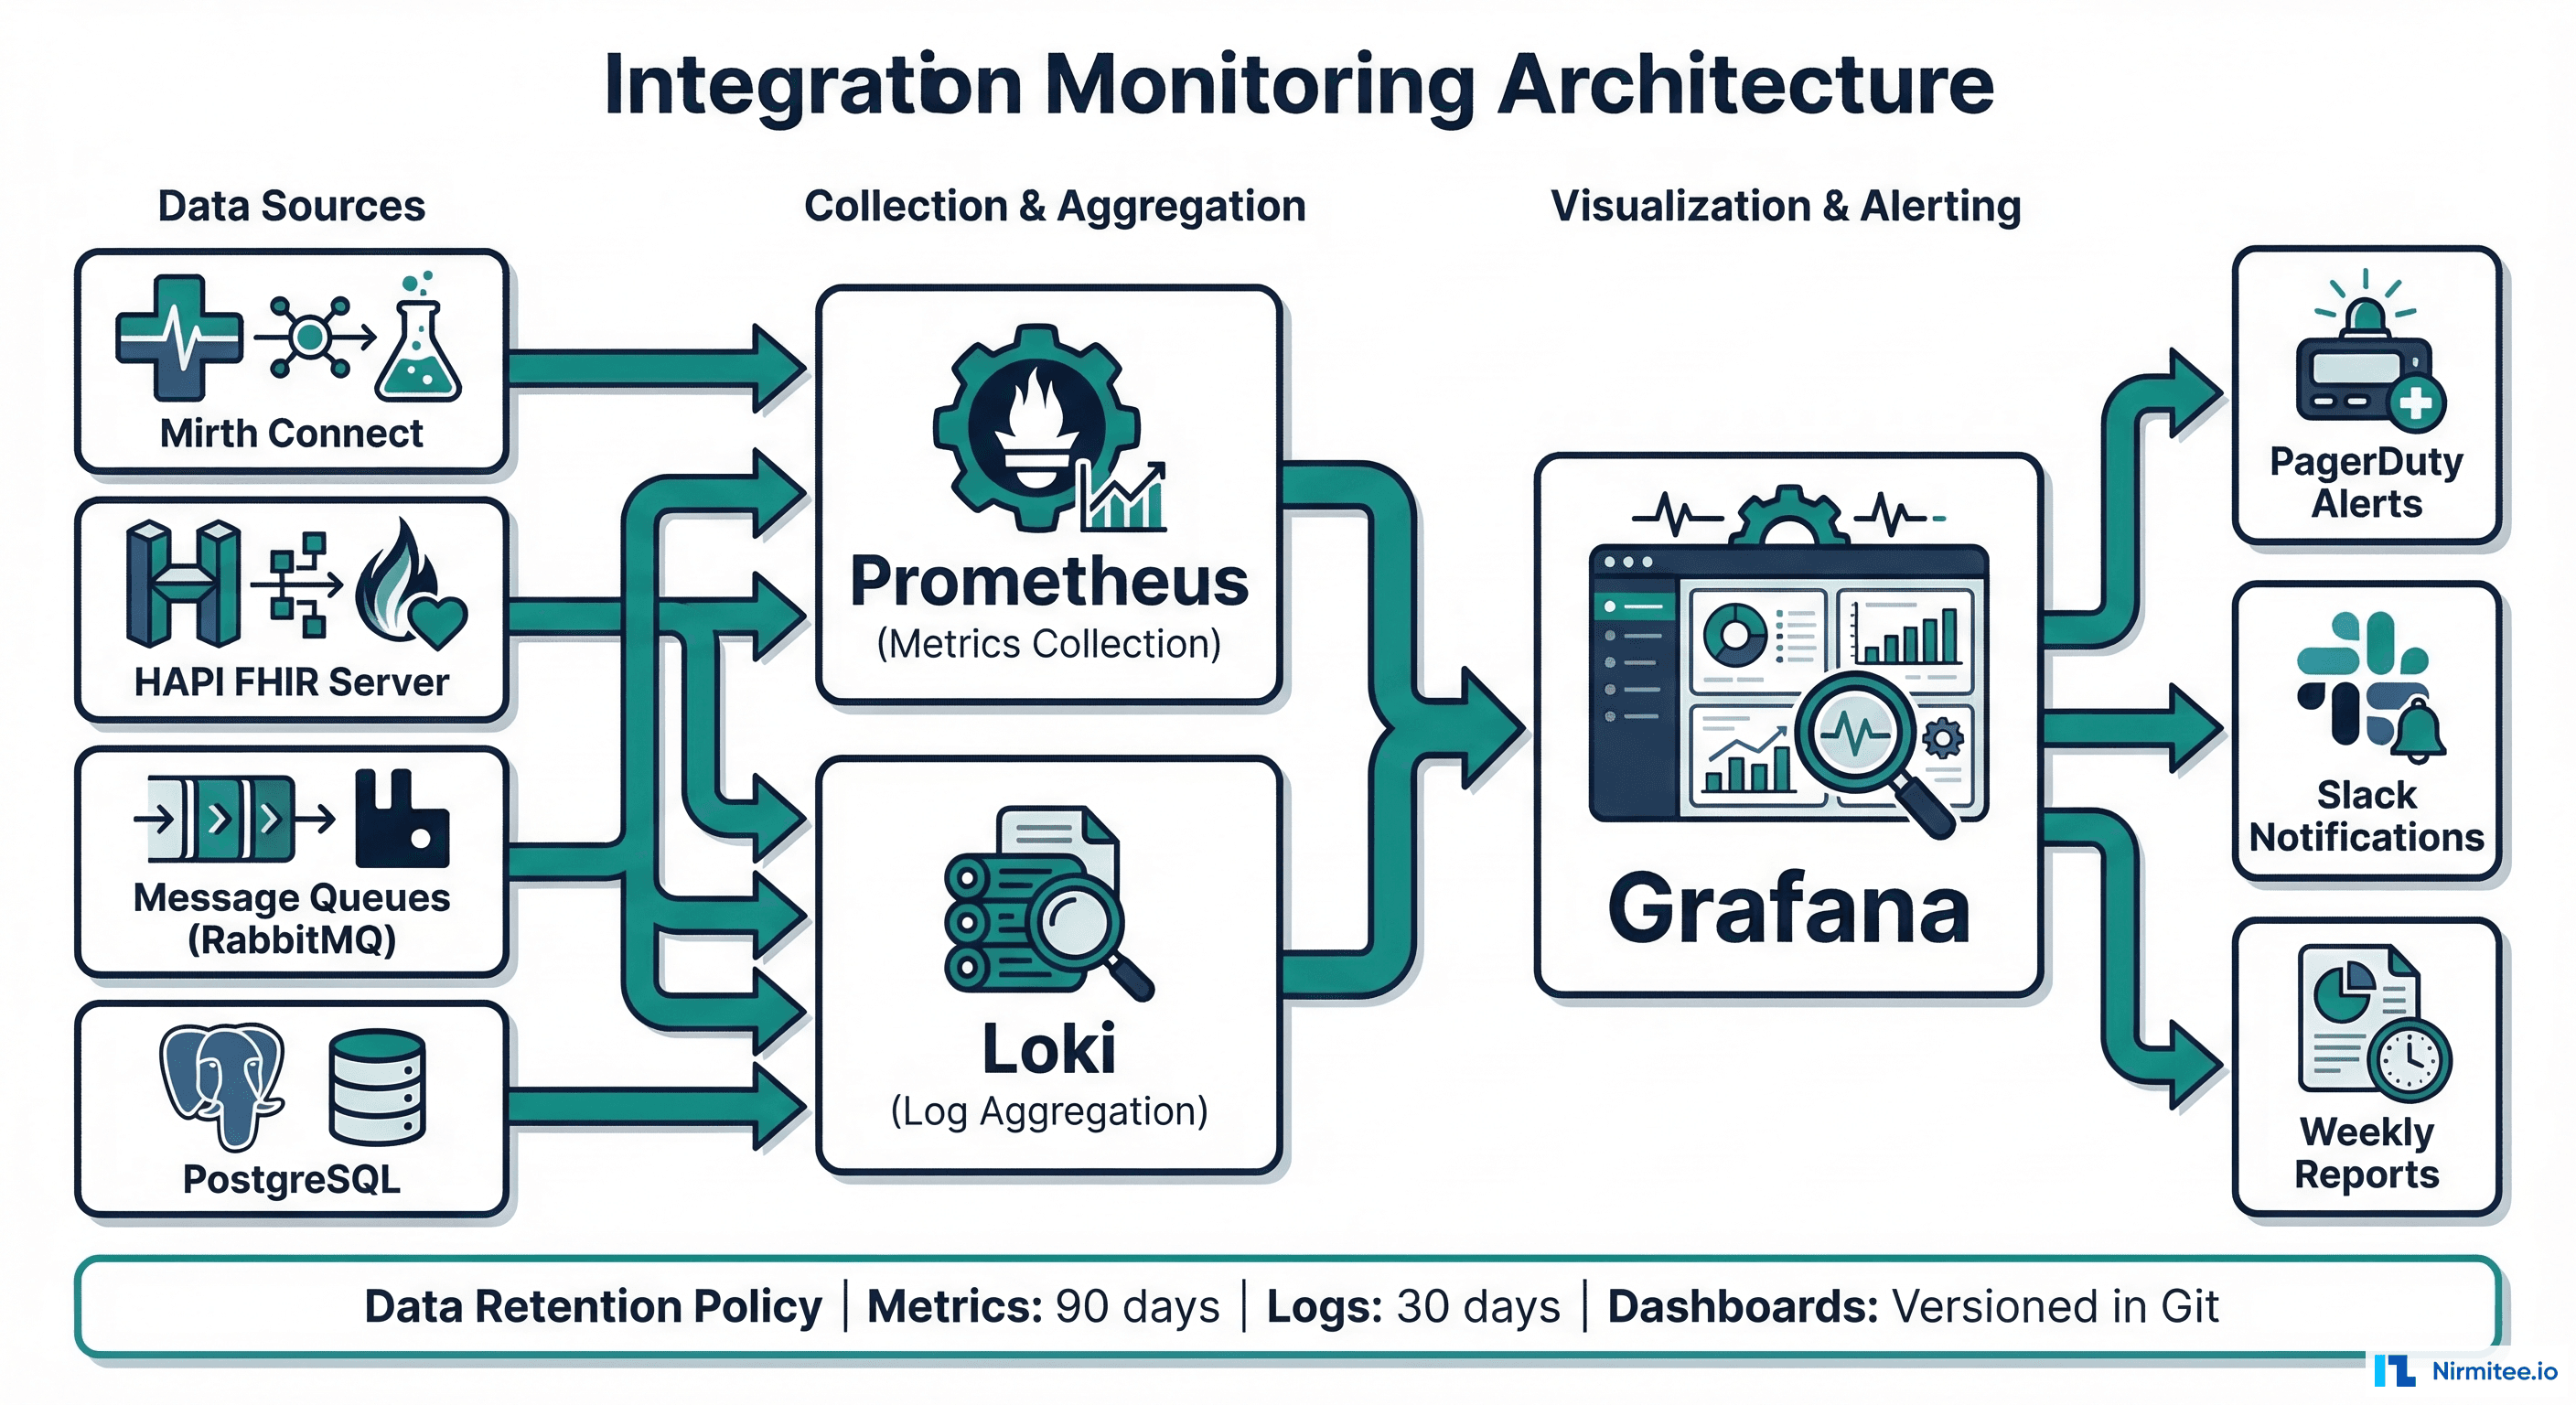
Here is a complete Grafana dashboard JSON provisioning configuration that implements all seven metrics. Import this into your Grafana instance and update the data source references to match your environment:
{
  "dashboard": {
    "title": "Healthcare Integration Operations",
    "tags": ["healthcare", "integration", "hl7", "fhir"],
    "timezone": "browser",
    "refresh": "30s",
    "panels": [
      {
        "title": "Message Throughput (msgs/hr)",
        "type": "timeseries",
        "gridPos": { "h": 8, "w": 12, "x": 0, "y": 0 },
        "targets": [{
          "expr": "sum(rate(mirth_messages_received_total[5m])) by (channel_name) * 3600"
        }]
      },
      {
        "title": "Error Rate by Channel (%)",
        "type": "bargauge",
        "gridPos": { "h": 8, "w": 12, "x": 12, "y": 0 },
        "targets": [{
          "expr": "integration:error_rate:by_channel"
        }],
        "fieldConfig": {
          "defaults": {
            "max": 5,
            "thresholds": {
              "steps": [
                { "color": "green", "value": 0 },
                { "color": "yellow", "value": 0.5 },
                { "color": "red", "value": 2 }
              ]
            }
          }
        }
      },
      {
        "title": "Processing Latency Percentiles",
        "type": "timeseries",
        "gridPos": { "h": 8, "w": 12, "x": 0, "y": 8 },
        "targets": [
          { "expr": "histogram_quantile(0.50, rate(mirth_message_processing_seconds_bucket[5m]))", "legendFormat": "p50" },
          { "expr": "histogram_quantile(0.95, rate(mirth_message_processing_seconds_bucket[5m]))", "legendFormat": "p95" },
          { "expr": "histogram_quantile(0.99, rate(mirth_message_processing_seconds_bucket[5m]))", "legendFormat": "p99" }
        ]
      },
      {
        "title": "Queue Depth by Channel",
        "type": "stat",
        "gridPos": { "h": 8, "w": 12, "x": 12, "y": 8 },
        "targets": [{
          "expr": "mirth_channel_queue_depth"
        }],
        "fieldConfig": {
          "defaults": {
            "thresholds": {
              "steps": [
                { "color": "green", "value": 0 },
                { "color": "yellow", "value": 100 },
                { "color": "red", "value": 500 }
              ]
            }
          }
        }
      },
      {
        "title": "Downstream System Availability",
        "type": "statusmap",
        "gridPos": { "h": 6, "w": 24, "x": 0, "y": 16 },
        "targets": [{
          "expr": "probe_success"
        }]
      },
      {
        "title": "Message Type Distribution",
        "type": "piechart",
        "gridPos": { "h": 8, "w": 12, "x": 0, "y": 22 },
        "targets": [{
          "expr": "sum(rate(mirth_messages_received_total[1h])) by (message_type)"
        }]
      },
      {
        "title": "SLA Compliance (%)",
        "type": "gauge",
        "gridPos": { "h": 8, "w": 12, "x": 12, "y": 22 },
        "targets": [{
          "expr": "integration:sla_compliance:overall"
        }],
        "fieldConfig": {
          "defaults": {
            "min": 90,
            "max": 100,
            "thresholds": {
              "steps": [
                { "color": "red", "value": 90 },
                { "color": "yellow", "value": 99 },
                { "color": "green", "value": 99.5 }
              ]
            }
          }
        }
      }
    ]
  }
}
Implementation Roadmap
Getting from zero monitoring to a production-grade integration dashboard takes approximately two weeks of focused effort:
- Week 1, Days 1-2: Deploy Prometheus and Grafana. Configure Mirth Connect JMX or Prometheus exporter. Stand up Metrics 1 (throughput) and 2 (error rate) with basic alerting.
- Week 1, Days 3-5: Implement histogram-based latency tracking (Metric 3). Configure queue depth monitoring (Metric 4). Set up active health checks for downstream systems (Metric 5).
- Week 2, Days 1-3: Build message type distribution tracking (Metric 6). Define and implement SLA compliance calculation (Metric 7). Configure PagerDuty or OpsGenie alert routing.
- Week 2, Days 4-5: Create the unified dashboard. Set up weekly reporting. Train the interface team on dashboard interpretation and alert response procedures.
The investment pays for itself within the first month. A single prevented overnight incident -- where messages queue up for hours and require manual intervention -- saves more engineering time than the entire dashboard implementation.
FAQ
What monitoring tools work best for Mirth Connect?
Prometheus with a Mirth Connect JMX exporter is the most flexible option. Mirth provides JMX MBeans for channel statistics, queue depths, and message counts. For teams already using Datadog or New Relic, both support JMX integration. The key is getting channel-level metrics (not just JVM-level) into your monitoring system. The Mirth Connect monitoring ecosystem has matured significantly in recent years.
How do I convince leadership to invest in integration monitoring?
Calculate the cost of your last integration incident: hours of engineering time, clinical workflow disruption, potential patient safety events, and any downstream revenue impact (delayed charges, missed billing windows). A single ADT channel outage that goes undetected for 4 hours typically costs $15,000-50,000 in engineering recovery time and workflow impact. The dashboard costs $5,000-10,000 in engineering effort to build.
Should I alert on every metric or just the most critical ones?
Start with three alerts: zero throughput (Metric 1), error rate spike (Metric 2), and queue depth critical (Metric 4). These three catch 90% of integration incidents. Add latency and SLA alerts after the team has built response procedures for the initial three. Alert fatigue from too many alerts is worse than no alerts -- it trains engineers to ignore pages.
How do I handle alert fatigue from noisy channels?
Implement alert suppression windows for known maintenance periods, set per-channel thresholds based on historical behavior (not global defaults), and use alert grouping to bundle related alerts into a single notification. A channel that legitimately has a 1.5% error rate should not alert at 1% -- adjust the threshold to match the channel's normal behavior and alert on deviations from that baseline.