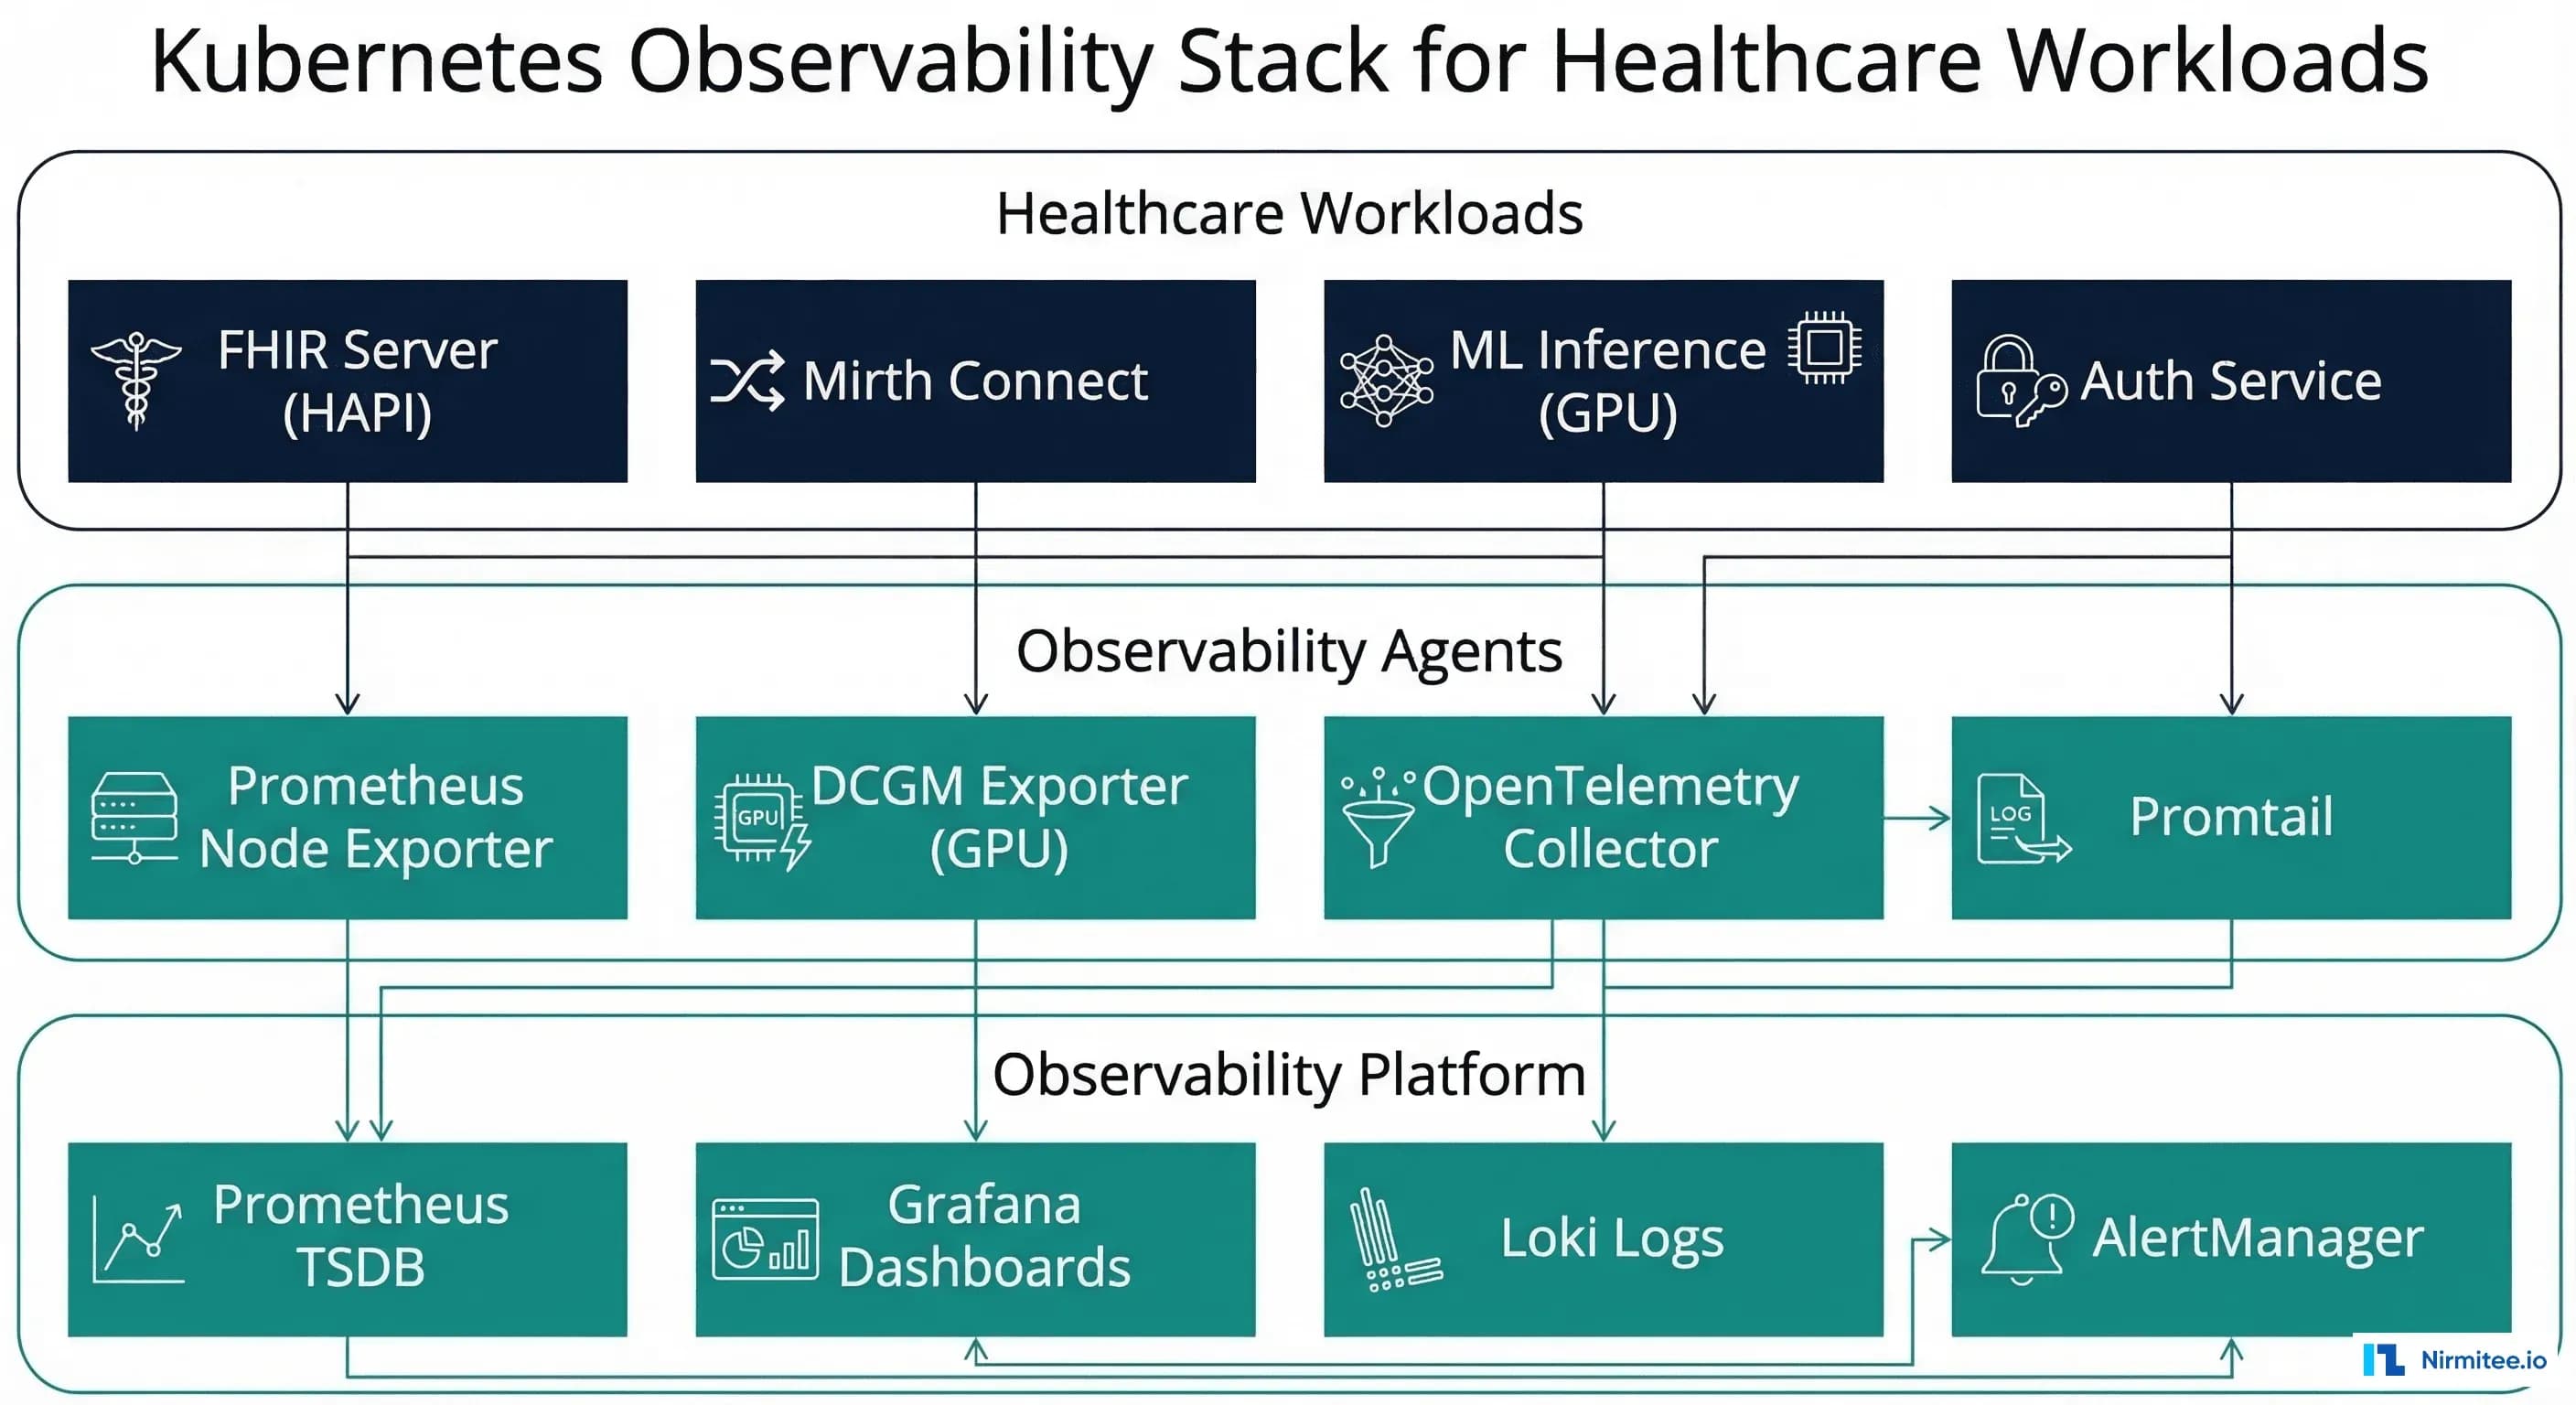
Why Healthcare Kubernetes Needs Different Observability
Kubernetes observability for a SaaS startup and Kubernetes observability for a healthcare platform are fundamentally different problems. When your pods are running FHIR servers that clinicians depend on for patient data, Mirth Connect channels processing lab orders, and GPU-accelerated ML models generating clinical decision support -- the stakes of missing a monitoring signal are clinical, not just commercial. A pod restart that goes unnoticed could mean lost HL7 messages. A GPU memory leak could cause an AI diagnostic model to return garbage predictions. A network policy misconfiguration could expose PHI across namespace boundaries.
This guide covers healthcare-specific Kubernetes monitoring patterns with production configurations for Prometheus, Grafana, DCGM, and OpenTelemetry. We focus on the three workload categories that define healthcare K8s deployments: FHIR servers, integration engines, and ML inference pods -- plus the infrastructure-level concerns (GPU monitoring, PHI namespace isolation, cross-service tracing) that are unique to healthcare.
FHIR Server Pod Monitoring
FHIR servers like HAPI FHIR are JVM-based applications with specific performance characteristics. Monitoring a FHIR server pod requires tracking both HTTP-level metrics (request latency, error rates, throughput) and JVM-level metrics (heap usage, garbage collection pauses, thread pool exhaustion). Here are the critical metrics and their clinical significance:
| Metric | Warning Threshold | Critical Threshold | Clinical Impact |
|---|---|---|---|
| Request latency (p99) | > 2 seconds | > 5 seconds | Clinician workflow delays, timeout errors in EHR |
| Error rate (5xx) | > 1% | > 5% | Failed patient lookups, broken clinical workflows |
| JVM heap usage | > 80% | > 90% | Imminent OOM kill, pod restart, request failures |
| GC pause duration | > 500ms | > 2 seconds | Request timeouts during stop-the-world GC |
| Connection pool usage | > 75% | > 90% | Database connection exhaustion, cascading failures |
| Pod restarts (1hr window) | > 2 | > 5 | Recurring crashes, potential data loss in flight |
Prometheus ServiceMonitor for HAPI FHIR
# servicemonitor-hapi-fhir.yaml
apiVersion: monitoring.coreos.com/v1
kind: ServiceMonitor
metadata:
  name: hapi-fhir-monitor
  namespace: phi-workloads
  labels:
    app: hapi-fhir
    team: platform
spec:
  selector:
    matchLabels:
      app: hapi-fhir
  endpoints:
    - port: metrics
      path: /actuator/prometheus
      interval: 15s
      scrapeTimeout: 10s
      metricRelabelings:
        # Keep only essential metrics to control cardinality
        - sourceLabels: [__name__]
          regex: "(http_server_requests_seconds.*|jvm_memory_used_bytes|jvm_gc_pause_seconds.*|hikaricp_connections.*|process_cpu_usage|jvm_threads_current)"
          action: keep
  namespaceSelector:
    matchNames:
      - phi-workloads
FHIR-Specific Prometheus Recording Rules
# prometheus-rules-fhir.yaml
apiVersion: monitoring.coreos.com/v1
kind: PrometheusRule
metadata:
  name: fhir-server-rules
  namespace: monitoring
spec:
  groups:
    - name: fhir-server-performance
      interval: 30s
      rules:
        # FHIR request latency by resource type
        - record: fhir:request_duration:p99
          expr: |
            histogram_quantile(0.99,
              sum(rate(http_server_requests_seconds_bucket{
                namespace="phi-workloads",
                uri=~"/fhir/.*"
              }[5m])) by (le, uri)
            )

        # FHIR error rate by resource type
        - record: fhir:error_rate:5m
          expr: |
            sum(rate(http_server_requests_seconds_count{
              namespace="phi-workloads",
              status=~"5.."
            }[5m])) by (uri)
            /
            sum(rate(http_server_requests_seconds_count{
              namespace="phi-workloads"
            }[5m])) by (uri)

        # Connection pool saturation
        - record: fhir:db_pool_utilization
          expr: |
            hikaricp_connections_active{
              namespace="phi-workloads"
            }
            /
            hikaricp_connections_max{
              namespace="phi-workloads"
            }

    - name: fhir-server-alerts
      rules:
        - alert: FHIRServerHighLatency
          expr: fhir:request_duration:p99 > 2
          for: 5m
          labels:
            severity: warning
            team: platform
          annotations:
            summary: "FHIR server p99 latency > 2s"
            description: "{{ $labels.uri }} p99 latency is {{ $value }}s"

        - alert: FHIRServerHighErrorRate
          expr: fhir:error_rate:5m > 0.05
          for: 2m
          labels:
            severity: critical
            team: platform
          annotations:
            summary: "FHIR server error rate > 5%"

        - alert: FHIRServerOOMRisk
          expr: |
            jvm_memory_used_bytes{area="heap", namespace="phi-workloads"}
            / jvm_memory_max_bytes{area="heap", namespace="phi-workloads"}
            > 0.9
          for: 5m
          labels:
            severity: critical
          annotations:
            summary: "FHIR server JVM heap > 90% - OOM kill imminent"
Mirth Connect Pod Monitoring
Mirth Connect (NextGen Connect) is the most common healthcare integration engine. When running in Kubernetes, monitoring channel status, message throughput, and queue depth is critical for ensuring lab orders, results, and ADT messages flow without interruption:
# servicemonitor-mirth.yaml
apiVersion: monitoring.coreos.com/v1
kind: ServiceMonitor
metadata:
  name: mirth-connect-monitor
  namespace: phi-workloads
spec:
  selector:
    matchLabels:
      app: mirth-connect
  endpoints:
    - port: metrics
      path: /metrics
      interval: 30s
      # Mirth custom exporter endpoint
      # Use mirth-prometheus-exporter sidecar
Since Mirth does not expose Prometheus metrics natively, deploy a sidecar exporter that queries the Mirth REST API and exposes metrics in Prometheus format. Key metrics to expose include channel state (started/stopped/paused), messages sent/received per channel, queue depth per channel, and processing error counts.
GPU Monitoring with DCGM Exporter
Healthcare organizations deploying ML models for clinical decision support, radiology AI, or natural language processing on Kubernetes GPU nodes need specialized GPU monitoring. The NVIDIA Data Center GPU Manager (DCGM) exporter provides Prometheus metrics for GPU utilization, memory, temperature, power draw, and ECC errors.
DCGM Exporter DaemonSet
# dcgm-exporter-daemonset.yaml
apiVersion: apps/v1
kind: DaemonSet
metadata:
  name: dcgm-exporter
  namespace: monitoring
  labels:
    app: dcgm-exporter
spec:
  selector:
    matchLabels:
      app: dcgm-exporter
  template:
    metadata:
      labels:
        app: dcgm-exporter
    spec:
      nodeSelector:
        nvidia.com/gpu.present: "true"
      tolerations:
        - key: nvidia.com/gpu
          operator: Exists
          effect: NoSchedule
      containers:
        - name: dcgm-exporter
          image: nvcr.io/nvidia/k8s/dcgm-exporter:3.3.5-3.4.1-ubuntu22.04
          ports:
            - name: metrics
              containerPort: 9400
          env:
            - name: DCGM_EXPORTER_KUBERNETES
              value: "true"
            - name: DCGM_EXPORTER_LISTEN
              value: ":9400"
          securityContext:
            runAsNonRoot: false
            runAsUser: 0
            capabilities:
              add: ["SYS_ADMIN"]
          volumeMounts:
            - name: device-plugin
              mountPath: /var/lib/kubelet/device-plugins
      volumes:
        - name: device-plugin
          hostPath:
            path: /var/lib/kubelet/device-plugins
---
apiVersion: monitoring.coreos.com/v1
kind: ServiceMonitor
metadata:
  name: dcgm-exporter
  namespace: monitoring
spec:
  selector:
    matchLabels:
      app: dcgm-exporter
  endpoints:
    - port: metrics
      interval: 15s
GPU Alert Rules
# prometheus-rules-gpu.yaml
apiVersion: monitoring.coreos.com/v1
kind: PrometheusRule
metadata:
  name: gpu-monitoring-rules
  namespace: monitoring
spec:
  groups:
    - name: gpu-health
      rules:
        - alert: GPUHighTemperature
          expr: DCGM_FI_DEV_GPU_TEMP > 80
          for: 5m
          labels:
            severity: warning
          annotations:
            summary: "GPU temperature > 80C on {{ $labels.node }}"
            description: "GPU {{ $labels.gpu }} temperature is {{ $value }}C"

        - alert: GPUMemoryExhaustion
          expr: |
            DCGM_FI_DEV_FB_USED
            / (DCGM_FI_DEV_FB_USED + DCGM_FI_DEV_FB_FREE)
            > 0.95
          for: 2m
          labels:
            severity: critical
          annotations:
            summary: "GPU VRAM > 95% on {{ $labels.node }}"

        - alert: GPUECCErrors
          expr: rate(DCGM_FI_DEV_ECC_DBE_VOL_TOTAL[1h]) > 0
          labels:
            severity: critical
          annotations:
            summary: "GPU ECC double-bit errors detected"
            description: "GPU {{ $labels.gpu }} on {{ $labels.node }} has uncorrectable memory errors - model predictions may be corrupted"

        - alert: GPUUnderutilized
          expr: DCGM_FI_DEV_GPU_UTIL < 5
          for: 30m
          labels:
            severity: info
          annotations:
            summary: "GPU underutilized - consider rightsizing"
The ECC error alert is particularly important for healthcare ML workloads. A GPU with uncorrectable memory errors can produce silently corrupted model outputs -- a radiology AI model that returns incorrect predictions due to faulty GPU memory is a patient safety issue, not just an infrastructure concern.
Cross-Service Request Tracing
Healthcare workflows often span multiple services: a clinician searches for a patient in the EHR, which hits the FHIR server, which queries the database, which may trigger an ML model for risk scoring. Distributed tracing with OpenTelemetry gives you visibility into these cross-service flows.
# otel-collector-config.yaml
apiVersion: v1
kind: ConfigMap
metadata:
  name: otel-collector-config
  namespace: monitoring
data:
  config.yaml: |
    receivers:
      otlp:
        protocols:
          grpc:
            endpoint: 0.0.0.0:4317
          http:
            endpoint: 0.0.0.0:4318

    processors:
      batch:
        timeout: 5s
        send_batch_size: 1024

      # Remove PHI from trace attributes
      attributes:
        actions:
          - key: patient.name
            action: delete
          - key: patient.mrn
            action: delete
          - key: patient.dob
            action: delete
          - key: http.request.body
            action: delete
          - key: http.response.body
            action: delete
          - key: db.statement
            action: hash  # Hash SQL queries to prevent PHI exposure

    exporters:
      otlp:
        endpoint: tempo.monitoring.svc:4317
        tls:
          insecure: false
          cert_file: /etc/otel/tls/client.crt
          key_file: /etc/otel/tls/client.key

    service:
      pipelines:
        traces:
          receivers: [otlp]
          processors: [attributes, batch]
          exporters: [otlp]
Notice the attributes processor that removes PHI from trace spans. This is essential -- without it, trace data stored in Tempo or Jaeger could contain patient names, MRNs, or query parameters with PHI. The db.statement attribute is hashed rather than deleted to preserve query pattern visibility for debugging while preventing PHI exposure in SQL parameters.
Namespace Isolation for PHI Workloads
HIPAA requires access controls on systems containing PHI. In Kubernetes, this translates to namespace isolation with NetworkPolicies that restrict which pods can communicate with PHI-handling services.
NetworkPolicy for PHI Namespace
# network-policy-phi-namespace.yaml
# Default deny all ingress to PHI namespace
apiVersion: networking.k8s.io/v1
kind: NetworkPolicy
metadata:
  name: default-deny-ingress
  namespace: phi-workloads
spec:
  podSelector: {}
  policyTypes:
    - Ingress
---
# Allow specific ingress from API gateway
apiVersion: networking.k8s.io/v1
kind: NetworkPolicy
metadata:
  name: allow-api-gateway
  namespace: phi-workloads
spec:
  podSelector:
    matchLabels:
      app: hapi-fhir
  policyTypes:
    - Ingress
  ingress:
    - from:
        - namespaceSelector:
            matchLabels:
              name: api-gateway
          podSelector:
            matchLabels:
              app: api-gateway
      ports:
        - protocol: TCP
          port: 8080
---
# Allow monitoring namespace to scrape metrics
apiVersion: networking.k8s.io/v1
kind: NetworkPolicy
metadata:
  name: allow-prometheus-scrape
  namespace: phi-workloads
spec:
  podSelector:
    matchLabels:
      monitoring: enabled
  policyTypes:
    - Ingress
  ingress:
    - from:
        - namespaceSelector:
            matchLabels:
              name: monitoring
          podSelector:
            matchLabels:
              app: prometheus
      ports:
        - protocol: TCP
          port: 9090
        - protocol: TCP
          port: 8080  # actuator/metrics
The monitoring exception is important: Prometheus needs to scrape metrics from pods in the PHI namespace, but the NetworkPolicy should restrict this access to only the Prometheus server pods and only on the metrics port. This prevents a compromised pod in the monitoring namespace from accessing FHIR server API ports.
Grafana Dashboard for Healthcare Workloads
A well-designed Grafana dashboard gives your platform team a single pane of glass for all healthcare workloads. Here is a dashboard JSON model that combines FHIR server, Mirth, and GPU metrics into a unified view:
{
  "dashboard": {
    "title": "Healthcare K8s Workloads",
    "uid": "healthcare-k8s",
    "panels": [
      {
        "title": "FHIR Server - Request Latency (p99)",
        "type": "timeseries",
        "gridPos": {"h": 8, "w": 12, "x": 0, "y": 0},
        "targets": [{
          "expr": "fhir:request_duration:p99",
          "legendFormat": "{{ uri }}"
        }],
        "fieldConfig": {
          "defaults": {
            "unit": "s",
            "thresholds": {
              "steps": [
                {"value": 0, "color": "green"},
                {"value": 2, "color": "orange"},
                {"value": 5, "color": "red"}
              ]
            }
          }
        }
      },
      {
        "title": "GPU Utilization by Node",
        "type": "gauge",
        "gridPos": {"h": 8, "w": 12, "x": 12, "y": 0},
        "targets": [{
          "expr": "DCGM_FI_DEV_GPU_UTIL",
          "legendFormat": "{{ node }}/gpu{{ gpu }}"
        }],
        "fieldConfig": {
          "defaults": {
            "unit": "percent",
            "max": 100,
            "thresholds": {
              "steps": [
                {"value": 0, "color": "blue"},
                {"value": 70, "color": "green"},
                {"value": 90, "color": "orange"},
                {"value": 95, "color": "red"}
              ]
            }
          }
        }
      },
      {
        "title": "Pod Restart Count (24h)",
        "type": "stat",
        "gridPos": {"h": 4, "w": 6, "x": 0, "y": 8},
        "targets": [{
          "expr": "sum(increase(kube_pod_container_status_restarts_total{namespace=\"phi-workloads\"}[24h])) by (pod)"
        }]
      }
    ]
  }
}
Dependency Health Monitoring
Healthcare Kubernetes workloads have critical dependencies: PostgreSQL databases, Redis caches, message queues (RabbitMQ, Kafka), and external services (payer APIs, lab systems). Monitor each dependency as a first-class citizen:
| Dependency | Key Metrics | Alert Condition | Impact if Unhealthy |
|---|---|---|---|
| PostgreSQL | Connection count, replication lag, query latency | Replication lag > 30s, connections > 80% max | FHIR reads return stale data, writes fail |
| Redis | Memory usage, eviction rate, hit ratio | Eviction rate > 0, hit ratio < 90% | Session loss, cache miss storms |
| RabbitMQ | Queue depth, consumer count, message rate | Queue depth > 1000, consumers = 0 | HL7 messages not processed |
| External APIs | Response time, error rate, circuit breaker state | Error rate > 10%, circuit open | Payer lookups fail, lab orders rejected |
Frequently Asked Questions
Do I need a BAA with my monitoring vendor for Kubernetes observability?
If your monitoring system collects any data from pods handling PHI -- even just metrics and logs, not raw PHI -- you should have a BAA in place. Grafana Cloud, Datadog, and New Relic all offer HIPAA-eligible tiers. Self-hosted monitoring (Prometheus + Grafana on your own infrastructure) avoids the BAA requirement but increases operational burden. Make sure your log pipeline sanitizes PHI before it reaches any monitoring backend.
How do I monitor Kubernetes workloads without exposing PHI in metrics?
Design your metrics with PHI-free labels. Never use patient IDs, names, or MRNs as Prometheus label values -- this would create high-cardinality metrics and expose PHI in your monitoring system. Use aggregate metrics (e.g., "total patient searches per minute") rather than per-patient metrics. For traces, configure the OpenTelemetry collector to strip PHI attributes before exporting, as shown in the configuration above.
What is the recommended GPU monitoring stack for healthcare ML?
NVIDIA DCGM Exporter + Prometheus + Grafana is the standard stack. DCGM provides comprehensive GPU metrics including utilization, memory, temperature, power draw, ECC errors, and PCIe throughput. For healthcare-specific concerns, pay special attention to ECC errors (corrupted model outputs) and GPU memory usage (OOM kills that restart inference pods). If you are running clinical decision support models, consider adding model-level metrics (inference latency, prediction confidence scores) alongside infrastructure metrics.
How do NetworkPolicies affect Prometheus scraping?
NetworkPolicies in a PHI namespace will block Prometheus from scraping metrics unless you explicitly allow it. Create a NetworkPolicy that permits ingress from the monitoring namespace to the metrics port (usually 9090 or 8080 for actuator endpoints) on pods labeled for monitoring. This allows metric collection while maintaining the default-deny posture for all other traffic. Test your NetworkPolicies in a staging environment before deploying to production -- a misconfigured policy can silently break monitoring.
Should I use managed Kubernetes (EKS/GKE/AKS) or self-hosted for healthcare?
Managed Kubernetes is strongly recommended for healthcare workloads. AWS EKS, Google GKE, and Azure AKS all support HIPAA compliance with BAA coverage. The operational burden of self-hosting Kubernetes -- patching, upgrading, securing the control plane -- diverts resources from building healthcare features. Use managed K8s with a well-architected technology stack and focus your engineering effort on the application and observability layers described in this guide.
Conclusion
Healthcare Kubernetes observability requires going beyond standard pod and node metrics. You need FHIR-specific latency tracking, integration engine channel monitoring, GPU health metrics with ECC error detection, PHI-aware namespace isolation, and cross-service tracing that sanitizes sensitive data. The configurations in this guide provide a production-ready foundation -- deploy the ServiceMonitors, alert rules, and NetworkPolicies, then customize the thresholds and dashboards for your specific workload characteristics. The goal is not just knowing when something breaks, but understanding the clinical impact of every infrastructure event.