Why Reactive Monitoring Fails Healthcare APIs
In healthcare, you do not have the luxury of learning about API failures from your users. When a clinician cannot pull lab results because the FHIR server is down, patients wait. When the SMART on FHIR auth flow breaks silently, third-party apps lose access to EHR data. When a Mirth Connect channel stops processing HL7 messages, lab orders stack up in a queue nobody is watching. According to Ponemon Institute research, the average cost of unplanned healthcare IT downtime is $7,900 per minute -- and that calculation does not include clinical risk.
Synthetic monitoring flips the equation. Instead of waiting for real users to encounter failures, you run scheduled probes that test your APIs continuously -- every 30 seconds, every minute, every 5 minutes -- from multiple locations. When a probe fails twice consecutively, your on-call engineer gets paged before any patient or clinician is affected. This is the difference between "we detected and fixed the issue before it impacted care" and "we found out from a help desk ticket 45 minutes later."
This guide covers building a comprehensive synthetic monitoring system for healthcare APIs, with particular focus on FHIR endpoints, SMART on FHIR auth flows, HL7 integration engines, and bulk data operations. We include production-ready Python probe code, Checkly configurations, and Grafana Synthetic Monitoring setup.
The Six Critical Healthcare API Probes
Not all API endpoints deserve synthetic monitoring. Focus your probes on the endpoints whose failure has the highest clinical and operational impact. Here are the six probes every healthcare organization should run:
| Probe | Target | Frequency | Failure Impact | SLA Target |
|---|---|---|---|---|
| FHIR Capability Statement | GET /fhir/metadata | Every 60s | All FHIR clients cannot discover server capabilities | 99.95% |
| Patient Search | GET /fhir/Patient?family=Test | Every 2min | Clinical apps cannot look up patients | 99.9% |
| SMART on FHIR Auth | Full OAuth 2.0 dance | Every 5min | No third-party app can authenticate | 99.9% |
| Mirth Channel Health | Send test HL7 ADT message | Every 5min | Lab orders and results stop flowing | 99.9% |
| Bulk Data Export | POST /fhir/$export | Every 15min | Population health and analytics pipelines fail | 99.5% |
| Certificate Expiry | TLS certificate check | Every 6hr | Complete service outage on expiry | N/A |
Probe 1: FHIR /metadata Endpoint
The /metadata endpoint returns the server's CapabilityStatement -- the machine-readable description of what the FHIR server supports. Every FHIR client hits this endpoint first. If it is down or returning invalid data, every client integration fails.
Python Synthetic Probe Framework
Here is a complete, production-ready Python probe framework that you can extend for all six healthcare probes. It includes retry logic, timing measurement, structured result reporting, and Prometheus metric exposition:
import time
import ssl
import socket
import requests
import json
from datetime import datetime, timedelta
from dataclasses import dataclass, field
from typing import Optional, List
from enum import Enum
from prometheus_client import Gauge, Counter, Histogram, start_http_server


class ProbeStatus(Enum):
    PASS = "pass"
    FAIL = "fail"
    DEGRADED = "degraded"


@dataclass
class ProbeResult:
    probe_name: str
    status: ProbeStatus
    response_time_ms: float
    message: str
    timestamp: str = field(default_factory=lambda: datetime.utcnow().isoformat())
    details: dict = field(default_factory=dict)


# Prometheus metrics
probe_duration = Histogram(
    'synthetic_probe_duration_seconds',
    'Duration of synthetic probe execution',
    ['probe_name', 'target']
)
probe_status = Gauge(
    'synthetic_probe_status',
    'Current probe status (1=pass, 0=fail, 0.5=degraded)',
    ['probe_name', 'target']
)
probe_failures = Counter(
    'synthetic_probe_failures_total',
    'Total number of probe failures',
    ['probe_name', 'target']
)


class FHIRMetadataProbe:
    """Probe 1: Validate FHIR CapabilityStatement endpoint."""

    def __init__(self, base_url: str, timeout: int = 10):
        self.base_url = base_url.rstrip('/')
        self.timeout = timeout
        self.name = "fhir_metadata"

    def execute(self) -> ProbeResult:
        start = time.time()
        try:
            resp = requests.get(
                f"{self.base_url}/metadata",
                headers={"Accept": "application/fhir+json"},
                timeout=self.timeout
            )
            elapsed_ms = (time.time() - start) * 1000

            # Validate response
            if resp.status_code != 200:
                return ProbeResult(
                    probe_name=self.name,
                    status=ProbeStatus.FAIL,
                    response_time_ms=elapsed_ms,
                    message=f"HTTP {resp.status_code} from /metadata"
                )

            data = resp.json()

            # Verify it is a CapabilityStatement
            if data.get('resourceType') != 'CapabilityStatement':
                return ProbeResult(
                    probe_name=self.name,
                    status=ProbeStatus.FAIL,
                    response_time_ms=elapsed_ms,
                    message="Response is not a CapabilityStatement"
                )

            # Check for SMART security extensions
            security = None
            for rest in data.get('rest', []):
                sec = rest.get('security', {})
                for ext in sec.get('extension', []):
                    if 'oauth-uris' in ext.get('url', ''):
                        security = ext

            # Determine status based on response time
            if elapsed_ms > 5000:
                status = ProbeStatus.FAIL
                msg = f"Response time {elapsed_ms:.0f}ms exceeds 5s threshold"
            elif elapsed_ms > 2000:
                status = ProbeStatus.DEGRADED
                msg = f"Response time {elapsed_ms:.0f}ms exceeds 2s warning"
            else:
                status = ProbeStatus.PASS
                msg = f"CapabilityStatement OK in {elapsed_ms:.0f}ms"

            return ProbeResult(
                probe_name=self.name,
                status=status,
                response_time_ms=elapsed_ms,
                message=msg,
                details={
                    "fhir_version": data.get('fhirVersion'),
                    "smart_enabled": security is not None,
                    "resource_count": len(
                        data.get('rest', [{}])[0].get('resource', [])
                    ),
                }
            )

        except requests.Timeout:
            return ProbeResult(
                probe_name=self.name,
                status=ProbeStatus.FAIL,
                response_time_ms=(time.time() - start) * 1000,
                message=f"Timeout after {self.timeout}s"
            )
        except Exception as e:
            return ProbeResult(
                probe_name=self.name,
                status=ProbeStatus.FAIL,
                response_time_ms=(time.time() - start) * 1000,
                message=f"Error: {str(e)}"
            )
Probe 2: Patient Search Validation
The patient search probe verifies that the most common clinical workflow -- looking up a patient -- works correctly. This probe tests the database connection, search indexing, and response serialization in a single request:
class PatientSearchProbe:
    """Probe 2: Validate FHIR Patient search returns expected results."""

    def __init__(self, base_url: str, auth_token: str = None,
                 test_family: str = "TestPatient", timeout: int = 10):
        self.base_url = base_url.rstrip('/')
        self.auth_token = auth_token
        self.test_family = test_family
        self.timeout = timeout
        self.name = "fhir_patient_search"

    def execute(self) -> ProbeResult:
        start = time.time()
        headers = {"Accept": "application/fhir+json"}
        if self.auth_token:
            headers["Authorization"] = f"Bearer {self.auth_token}"

        try:
            resp = requests.get(
                f"{self.base_url}/Patient",
                params={"family": self.test_family, "_count": "5"},
                headers=headers,
                timeout=self.timeout
            )
            elapsed_ms = (time.time() - start) * 1000

            if resp.status_code == 401:
                return ProbeResult(
                    probe_name=self.name,
                    status=ProbeStatus.FAIL,
                    response_time_ms=elapsed_ms,
                    message="Authentication failed - token may be expired"
                )

            if resp.status_code != 200:
                return ProbeResult(
                    probe_name=self.name,
                    status=ProbeStatus.FAIL,
                    response_time_ms=elapsed_ms,
                    message=f"HTTP {resp.status_code} from Patient search"
                )

            bundle = resp.json()
            if bundle.get('resourceType') != 'Bundle':
                return ProbeResult(
                    probe_name=self.name,
                    status=ProbeStatus.FAIL,
                    response_time_ms=elapsed_ms,
                    message="Response is not a Bundle"
                )

            total = bundle.get('total', len(bundle.get('entry', [])))

            status = ProbeStatus.PASS if elapsed_ms < 3000 else ProbeStatus.DEGRADED
            return ProbeResult(
                probe_name=self.name,
                status=status,
                response_time_ms=elapsed_ms,
                message=f"Search returned {total} results in {elapsed_ms:.0f}ms",
                details={"result_count": total, "bundle_type": bundle.get('type')}
            )

        except Exception as e:
            return ProbeResult(
                probe_name=self.name,
                status=ProbeStatus.FAIL,
                response_time_ms=(time.time() - start) * 1000,
                message=f"Error: {str(e)}"
            )
Probe 3: SMART on FHIR Auth Flow
This is the most complex probe because it tests the full OAuth 2.0 authorization flow that every third-party healthcare app depends on. A failure here means no app can authenticate with your system.
class SMARTAuthProbe:
    """Probe 3: Test complete SMART on FHIR OAuth flow.
    Uses client_credentials grant for synthetic testing
    (no user interaction required)."""

    def __init__(self, base_url: str, client_id: str,
                 client_secret: str, timeout: int = 15):
        self.base_url = base_url.rstrip('/')
        self.client_id = client_id
        self.client_secret = client_secret
        self.timeout = timeout
        self.name = "smart_auth_flow"

    def _discover_endpoints(self) -> dict:
        """Fetch SMART configuration from well-known endpoint."""
        resp = requests.get(
            f"{self.base_url}/.well-known/smart-configuration",
            timeout=self.timeout
        )
        if resp.status_code == 200:
            return resp.json()
        # Fallback: parse from CapabilityStatement
        resp = requests.get(
            f"{self.base_url}/metadata",
            headers={"Accept": "application/fhir+json"},
            timeout=self.timeout
        )
        return self._extract_smart_urls(resp.json())

    def execute(self) -> ProbeResult:
        start = time.time()
        timings = {}

        try:
            # Step 1: Discover endpoints
            t1 = time.time()
            smart_config = self._discover_endpoints()
            timings['discovery_ms'] = (time.time() - t1) * 1000

            token_url = smart_config.get('token_endpoint')
            if not token_url:
                return ProbeResult(
                    probe_name=self.name,
                    status=ProbeStatus.FAIL,
                    response_time_ms=(time.time() - start) * 1000,
                    message="No token_endpoint in SMART configuration"
                )

            # Step 2: Request token via client_credentials
            t2 = time.time()
            token_resp = requests.post(
                token_url,
                data={
                    "grant_type": "client_credentials",
                    "client_id": self.client_id,
                    "client_secret": self.client_secret,
                    "scope": "system/*.read",
                },
                timeout=self.timeout
            )
            timings['token_exchange_ms'] = (time.time() - t2) * 1000

            if token_resp.status_code != 200:
                return ProbeResult(
                    probe_name=self.name,
                    status=ProbeStatus.FAIL,
                    response_time_ms=(time.time() - start) * 1000,
                    message=f"Token request failed: HTTP {token_resp.status_code}",
                    details=timings
                )

            token_data = token_resp.json()
            access_token = token_data.get('access_token')

            # Step 3: Validate token by fetching a resource
            t3 = time.time()
            resource_resp = requests.get(
                f"{self.base_url}/Patient?_count=1",
                headers={
                    "Authorization": f"Bearer {access_token}",
                    "Accept": "application/fhir+json"
                },
                timeout=self.timeout
            )
            timings['resource_fetch_ms'] = (time.time() - t3) * 1000

            total_ms = (time.time() - start) * 1000
            timings['total_ms'] = total_ms

            if resource_resp.status_code == 200:
                status = ProbeStatus.PASS if total_ms < 5000 else ProbeStatus.DEGRADED
                return ProbeResult(
                    probe_name=self.name,
                    status=status,
                    response_time_ms=total_ms,
                    message=f"Full SMART auth flow completed in {total_ms:.0f}ms",
                    details=timings
                )
            else:
                return ProbeResult(
                    probe_name=self.name,
                    status=ProbeStatus.FAIL,
                    response_time_ms=total_ms,
                    message=f"Resource fetch with token failed: {resource_resp.status_code}",
                    details=timings
                )

        except Exception as e:
            return ProbeResult(
                probe_name=self.name,
                status=ProbeStatus.FAIL,
                response_time_ms=(time.time() - start) * 1000,
                message=f"Auth flow error: {str(e)}"
            )
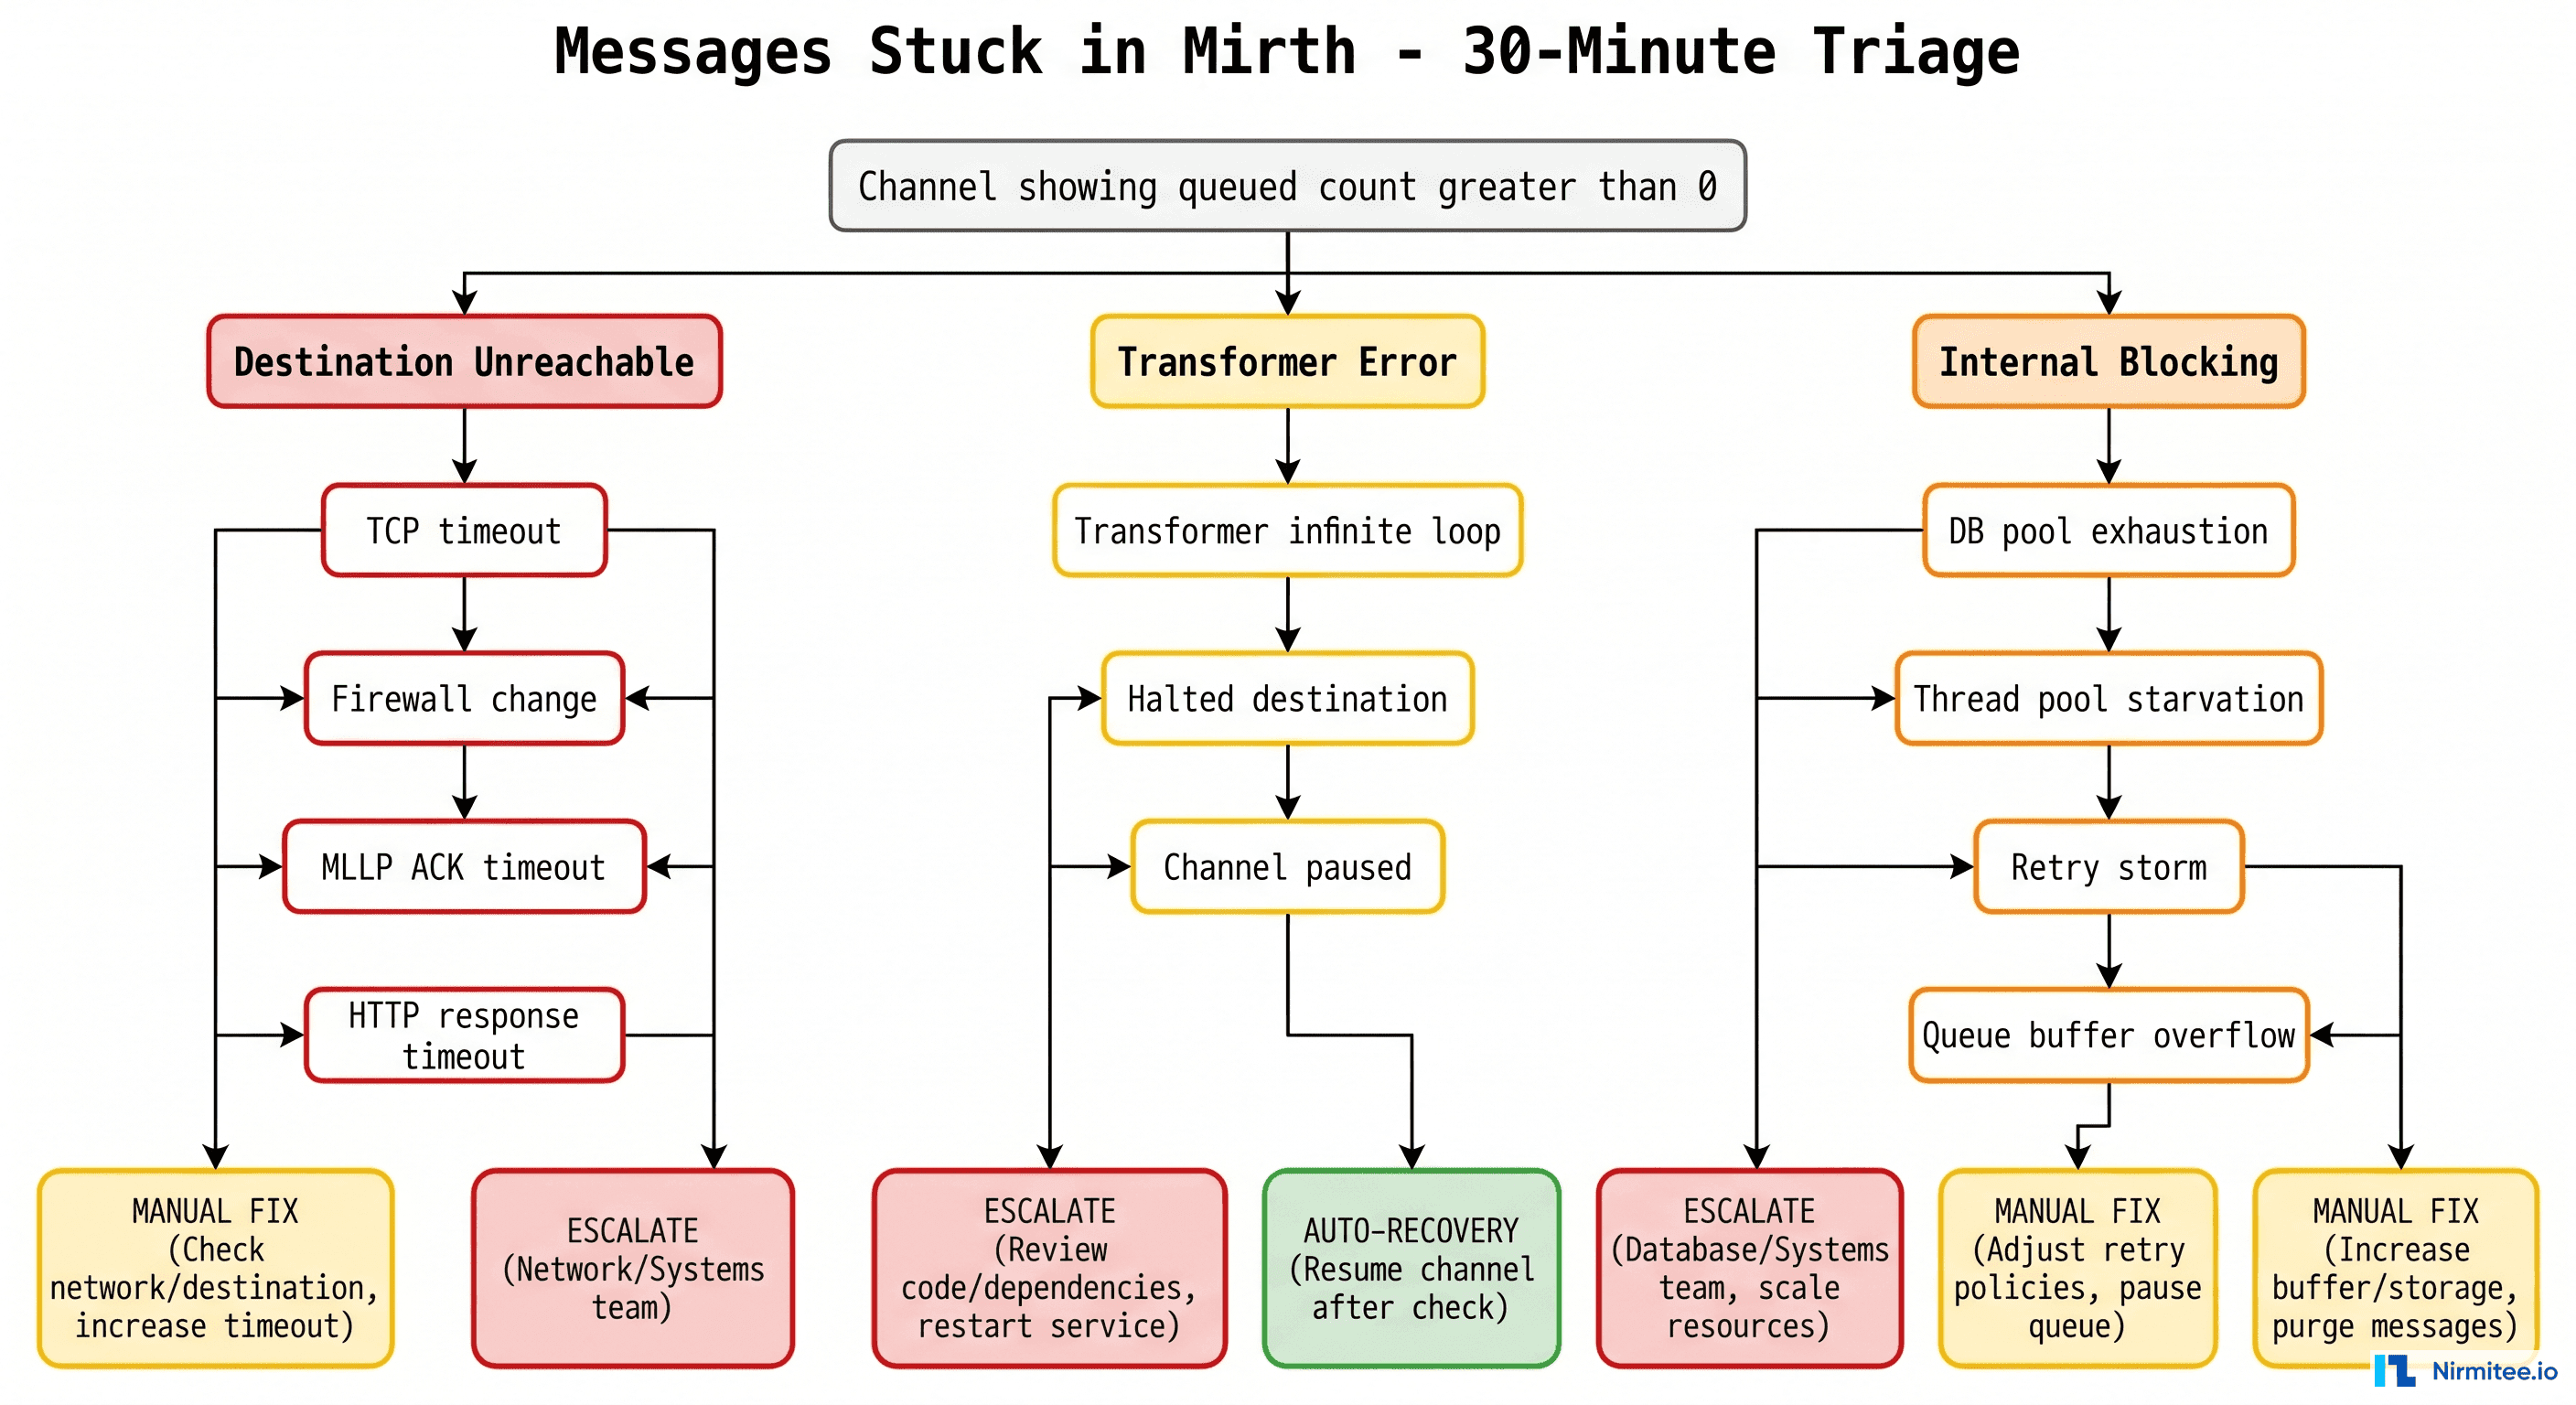
Probe 4: Mirth Connect Channel Health
For healthcare organizations running HL7 integration engines like Mirth Connect, monitoring channel health is critical. A stalled channel means lab orders are not being sent, results are not being delivered, and ADT messages are not updating patient demographics across systems:
class MirthChannelProbe:
    """Probe 4: Check Mirth Connect channel status via REST API."""

    def __init__(self, mirth_url: str, username: str,
                 password: str, channel_ids: list, timeout: int = 10):
        self.mirth_url = mirth_url.rstrip('/')
        self.username = username
        self.password = password
        self.channel_ids = channel_ids
        self.timeout = timeout
        self.name = "mirth_channel_health"

    def execute(self) -> ProbeResult:
        start = time.time()
        try:
            # Authenticate with Mirth
            session = requests.Session()
            login_resp = session.post(
                f"{self.mirth_url}/api/users/_login",
                data={"username": self.username, "password": self.password},
                timeout=self.timeout, verify=False
            )

            if login_resp.status_code != 200:
                return ProbeResult(
                    probe_name=self.name,
                    status=ProbeStatus.FAIL,
                    response_time_ms=(time.time() - start) * 1000,
                    message="Mirth authentication failed"
                )

            # Check each channel status
            failed_channels = []
            channel_details = {}

            for ch_id in self.channel_ids:
                status_resp = session.get(
                    f"{self.mirth_url}/api/channels/{ch_id}/status",
                    headers={"Accept": "application/json"},
                    timeout=self.timeout, verify=False
                )
                if status_resp.status_code == 200:
                    status_data = status_resp.json()
                    state = status_data.get('state', 'UNKNOWN')
                    queued = status_data.get('queued', 0)
                    channel_details[ch_id] = {
                        "state": state, "queued": queued
                    }
                    if state != 'STARTED' or queued > 100:
                        failed_channels.append(ch_id)

            elapsed_ms = (time.time() - start) * 1000

            if failed_channels:
                return ProbeResult(
                    probe_name=self.name,
                    status=ProbeStatus.FAIL,
                    response_time_ms=elapsed_ms,
                    message=f"{len(failed_channels)} channels unhealthy",
                    details=channel_details
                )

            return ProbeResult(
                probe_name=self.name,
                status=ProbeStatus.PASS,
                response_time_ms=elapsed_ms,
                message=f"All {len(self.channel_ids)} channels healthy",
                details=channel_details
            )

        except Exception as e:
            return ProbeResult(
                probe_name=self.name,
                status=ProbeStatus.FAIL,
                response_time_ms=(time.time() - start) * 1000,
                message=f"Mirth probe error: {str(e)}"
            )
Probe 5 and 6: Bulk Data Export and Certificate Monitoring
The bulk data export probe verifies that your $export operation can kick off successfully -- critical for population health analytics and regulatory reporting. The certificate expiry probe catches expired TLS certificates before they cause outages:
class CertificateExpiryProbe:
    """Probe 6: Check TLS certificate expiry for all endpoints."""

    def __init__(self, hostnames: list, warning_days: int = 30,
                 critical_days: int = 14):
        self.hostnames = hostnames
        self.warning_days = warning_days
        self.critical_days = critical_days
        self.name = "certificate_expiry"

    def _check_cert(self, hostname: str, port: int = 443) -> dict:
        context = ssl.create_default_context()
        with socket.create_connection((hostname, port), timeout=10) as sock:
            with context.wrap_socket(sock, server_hostname=hostname) as ssock:
                cert = ssock.getpeercert()
                not_after = datetime.strptime(
                    cert['notAfter'], '%b %d %H:%M:%S %Y %Z'
                )
                days_remaining = (not_after - datetime.utcnow()).days
                return {
                    "hostname": hostname,
                    "expires": not_after.isoformat(),
                    "days_remaining": days_remaining,
                    "issuer": dict(x[0] for x in cert['issuer']),
                    "subject": dict(x[0] for x in cert['subject']),
                }

    def execute(self) -> ProbeResult:
        start = time.time()
        results = []
        worst_status = ProbeStatus.PASS

        for hostname in self.hostnames:
            try:
                cert_info = self._check_cert(hostname)
                days = cert_info['days_remaining']

                if days <= self.critical_days:
                    cert_info['status'] = 'CRITICAL'
                    worst_status = ProbeStatus.FAIL
                elif days <= self.warning_days:
                    cert_info['status'] = 'WARNING'
                    if worst_status != ProbeStatus.FAIL:
                        worst_status = ProbeStatus.DEGRADED
                else:
                    cert_info['status'] = 'OK'

                results.append(cert_info)

            except Exception as e:
                results.append({
                    "hostname": hostname,
                    "status": "ERROR",
                    "error": str(e)
                })
                worst_status = ProbeStatus.FAIL

        elapsed_ms = (time.time() - start) * 1000
        min_days = min((r.get('days_remaining', 999) for r in results), default=0)

        return ProbeResult(
            probe_name=self.name,
            status=worst_status,
            response_time_ms=elapsed_ms,
            message=f"Nearest expiry: {min_days} days",
            details={"certificates": results}
        )
Alerting: From Probe Failure to Page
A probe that fails silently is worthless. Your alerting policy must convert probe failures into actionable notifications with appropriate escalation. The industry standard for healthcare APIs is the "two consecutive failures" rule -- a single failure might be a network blip, but two consecutive failures almost certainly indicate a real problem.
Prometheus AlertManager Configuration
# alertmanager-rules.yml
groups:
  - name: synthetic_monitoring
    rules:
      # Alert when any probe fails for 2+ consecutive checks
      - alert: SyntheticProbeFailing
        expr: synthetic_probe_status == 0
        for: 2m
        labels:
          severity: critical
          team: platform
        annotations:
          summary: "Synthetic probe {{ $labels.probe_name }} is FAILING"
          description: "Probe {{ $labels.probe_name }} targeting {{ $labels.target }} has been failing for 2+ minutes"
          runbook_url: "https://wiki.internal/runbooks/synthetic-probe-failure"

      # Alert when probe is degraded (slow but not failing)
      - alert: SyntheticProbeDegraded
        expr: synthetic_probe_status == 0.5
        for: 5m
        labels:
          severity: warning
          team: platform
        annotations:
          summary: "Synthetic probe {{ $labels.probe_name }} is DEGRADED"
          description: "Probe response time exceeds warning threshold for 5+ minutes"

      # Alert on certificate expiry
      - alert: CertificateExpiringSoon
        expr: synthetic_probe_status{probe_name="certificate_expiry"} < 1
        for: 1m
        labels:
          severity: high
          team: security
        annotations:
          summary: "TLS certificate expiring within 30 days"
Tool Comparison: Checkly vs Grafana vs Datadog vs Custom
Choosing the right synthetic monitoring platform depends on your healthcare-specific requirements. Here is how the major options compare:
| Feature | Checkly | Grafana Synthetic | Datadog Synthetics | Custom Python |
|---|---|---|---|---|
| FHIR-aware probes | Manual scripting | Manual scripting | Manual scripting | Native support |
| Browser-based OAuth test | Yes (Playwright) | Yes (k6 browser) | Yes (Selenium) | Headless only |
| Private probe locations | Yes | Yes | Yes | Yes |
| HL7/MLLP protocol support | No | No | No | Yes |
| BAA available | Contact sales | Yes (Grafana Cloud) | Yes | N/A (self-hosted) |
| Alerting integrations | PagerDuty, Slack, Webhook | AlertManager, Grafana OnCall | PagerDuty, Slack, custom | Any (custom code) |
| Cost (monthly) | $30-450+ | $0-299+ | $75-500+ | Infrastructure only |
| Setup complexity | Low | Medium | Low | High |
For most healthcare organizations, we recommend a hybrid approach: use Grafana Synthetic Monitoring or Checkly for standard HTTP probes (FHIR metadata, patient search, certificate checks) and custom Python probes for healthcare-specific protocols (HL7/MLLP, SMART auth flows, Mirth channel monitoring). This gives you the convenience of managed monitoring for common checks while retaining the flexibility to test healthcare-specific integration points.
Grafana Synthetic Monitoring Setup
Grafana Synthetic Monitoring integrates directly with Grafana Cloud and stores probe results as Prometheus metrics and Loki logs. Here is a complete setup for monitoring a FHIR server:
# grafana-synthetic-monitoring.yml
# Configure via Grafana Cloud API or Terraform provider
checks:
  - job: fhir_metadata
    target: https://fhir.yourhospital.org/fhir/metadata
    frequency: 60000  # 60 seconds
    timeout: 10000
    probes:
      - us-east
      - us-west
      - eu-west
    settings:
      http:
        method: GET
        headers:
          Accept: application/fhir+json
        validStatusCodes:
          - 200
        validHTTPVersions:
          - HTTP/2
        failIfBodyNotMatchesRegexp:
          - "CapabilityStatement"
        tlsConfig:
          insecureSkipVerify: false

  - job: fhir_patient_search
    target: https://fhir.yourhospital.org/fhir/Patient?_count=1
    frequency: 120000  # 2 minutes
    timeout: 15000
    probes:
      - us-east
    settings:
      http:
        method: GET
        headers:
          Accept: application/fhir+json
          Authorization: Bearer ${PROBE_SERVICE_TOKEN}
        validStatusCodes:
          - 200
        failIfBodyNotMatchesRegexp:
          - "Bundle"

  - job: smart_well_known
    target: https://fhir.yourhospital.org/.well-known/smart-configuration
    frequency: 300000  # 5 minutes
    timeout: 10000
    probes:
      - us-east
      - eu-west
    settings:
      http:
        method: GET
        validStatusCodes:
          - 200
        failIfBodyNotMatchesRegexp:
          - "token_endpoint"
          - "authorization_endpoint"
Running Probes: The Scheduler
Whether you use custom probes or a managed platform, you need a scheduler that runs probes at the right intervals and handles the alerting logic. Here is a production scheduler that ties everything together:
import threading
import schedule
import time
import json
import requests

class ProbeScheduler:
    """Schedule and run synthetic probes with consecutive failure tracking."""

    def __init__(self, alert_webhook: str):
        self.alert_webhook = alert_webhook
        self.consecutive_failures = {}
        self.probes = []

    def register(self, probe, interval_seconds: int):
        self.probes.append((probe, interval_seconds))
        self.consecutive_failures[probe.name] = 0

    def _run_probe(self, probe):
        result = probe.execute()

        # Update Prometheus metrics
        status_val = {ProbeStatus.PASS: 1, ProbeStatus.DEGRADED: 0.5, ProbeStatus.FAIL: 0}
        probe_status.labels(probe_name=probe.name, target=getattr(probe, 'base_url', '')).set(
            status_val[result.status]
        )
        probe_duration.labels(probe_name=probe.name, target=getattr(probe, 'base_url', '')).observe(
            result.response_time_ms / 1000
        )

        if result.status == ProbeStatus.FAIL:
            self.consecutive_failures[probe.name] += 1
            probe_failures.labels(probe_name=probe.name, target=getattr(probe, 'base_url', '')).inc()

            if self.consecutive_failures[probe.name] >= 2:
                self._send_alert(result)
        else:
            self.consecutive_failures[probe.name] = 0

        print(json.dumps({
            "probe": result.probe_name,
            "status": result.status.value,
            "response_time_ms": round(result.response_time_ms, 1),
            "message": result.message,
            "timestamp": result.timestamp,
        }))

    def _send_alert(self, result: ProbeResult):
        payload = {
            "text": f"ALERT: {result.probe_name} FAILING\n"
                    f"Message: {result.message}\n"
                    f"Consecutive failures: {self.consecutive_failures[result.probe_name]}"
        }
        try:
            requests.post(self.alert_webhook, json=payload, timeout=5)
        except Exception:
            pass  # Alert delivery failure is logged separately

    def start(self):
        start_http_server(9090)  # Prometheus metrics endpoint
        for probe, interval in self.probes:
            schedule.every(interval).seconds.do(self._run_probe, probe)
        while True:
            schedule.run_pending()
            time.sleep(1)
Frequently Asked Questions
How often should I run synthetic probes against healthcare APIs?
Critical endpoints like FHIR /metadata and patient search should be probed every 60-120 seconds. Auth flows can run every 5 minutes since they are more resource-intensive. Bulk data export checks should run every 15 minutes. Certificate expiry checks only need to run every 6-12 hours. The key principle is: the higher the clinical impact of a failure, the more frequently you probe.
Will synthetic probes create noise in my audit logs?
Yes, and this is intentional. Use a dedicated service account for synthetic probes (e.g., synthetic-monitor@system) so you can filter probe traffic from real user traffic in your HIPAA-compliant logs. The audit trail of probe requests also serves as evidence that you are actively monitoring your systems -- a positive signal for compliance auditors.
Should synthetic probes use test data or real patient data?
Always use synthetic test data. Create a dedicated test patient (e.g., family name "SyntheticProbe") in your production FHIR server specifically for monitoring. Never query real patient data from synthetic probes -- this would constitute unnecessary PHI access and violate HIPAA's minimum necessary standard. If you are using a healthcare tech stack with proper test data management, seed your probe test data during deployment.
How do I handle probe authentication without storing credentials insecurely?
Use short-lived service account tokens managed by your secrets manager (AWS Secrets Manager, HashiCorp Vault, or Azure Key Vault). The probe scheduler should fetch fresh tokens before each probe run. For SMART on FHIR probes, use the client_credentials grant type with a dedicated synthetic monitoring client registered in your auth server. Rotate client secrets on a 90-day schedule.
Can synthetic monitoring replace traditional uptime monitoring?
No -- they complement each other. Traditional uptime monitoring (ping, TCP port checks) tells you whether a service is reachable. Synthetic monitoring tells you whether it is functioning correctly. A FHIR server can respond to TCP connections while returning 500 errors on every API call. You need both layers for complete coverage. For healthcare organizations building interoperable systems, synthetic monitoring is the only way to verify that complex multi-system workflows actually work end-to-end.
Conclusion
Synthetic monitoring is the difference between finding problems before patients do and finding them after. For healthcare APIs, where downtime has clinical consequences, the investment in proactive monitoring pays for itself many times over. Start with the FHIR metadata probe (15 minutes to implement), add patient search and auth flow probes, then extend to integration engine and bulk data monitoring as your platform matures. The Python probe framework in this guide is designed to be extended -- add new probe classes for your specific endpoints, register them with the scheduler, and you have comprehensive coverage of your entire healthcare API surface.