Every healthcare executive knows prior authorization is expensive. But when you ask "how expensive, exactly?" the answers tend to be vague hand-waves toward "administrative burden" and "staff time." That vagueness is the problem. Without precise cost data, prior authorization reform remains a conversation about frustration rather than a business case for investment.
Related case study: how AI agents eliminated the prior authorization bottleneck — our production implementation of the fixes this data points to.
This analysis changes that. We have compiled data from the three most authoritative sources on prior authorization costs in the United States: the CAQH 2023 Index Report, the 2024 AMA Prior Authorization Physician Survey, and the CMS Interoperability and Prior Authorization Final Rule (CMS-0057-F). Together, these sources provide a complete picture: per-transaction costs, volume data, clinical impact, specialty-specific breakdowns, payer-by-payer denial rates, and the economic implications of the CMS mandate that took effect in January 2026.
Our goal is not to repeat the well-known complaint that prior authorization is burdensome. It is to give you the specific numbers you need to build a business case, compare automation approaches, and calculate ROI for your organization. If you are a CFO, VP of Revenue Cycle, or CIO evaluating prior authorization solutions, this is the financial analysis your board presentation needs.
The Per-Transaction Cost: What CAQH Data Actually Shows
The 2023 CAQH Index Report is the healthcare industry's definitive benchmark for administrative transaction costs. Published annually since 2006, it surveys thousands of providers and health plans to calculate the actual cost of processing administrative transactions including eligibility verification, claims submission, remittance advice, and prior authorization.
The Headline Numbers
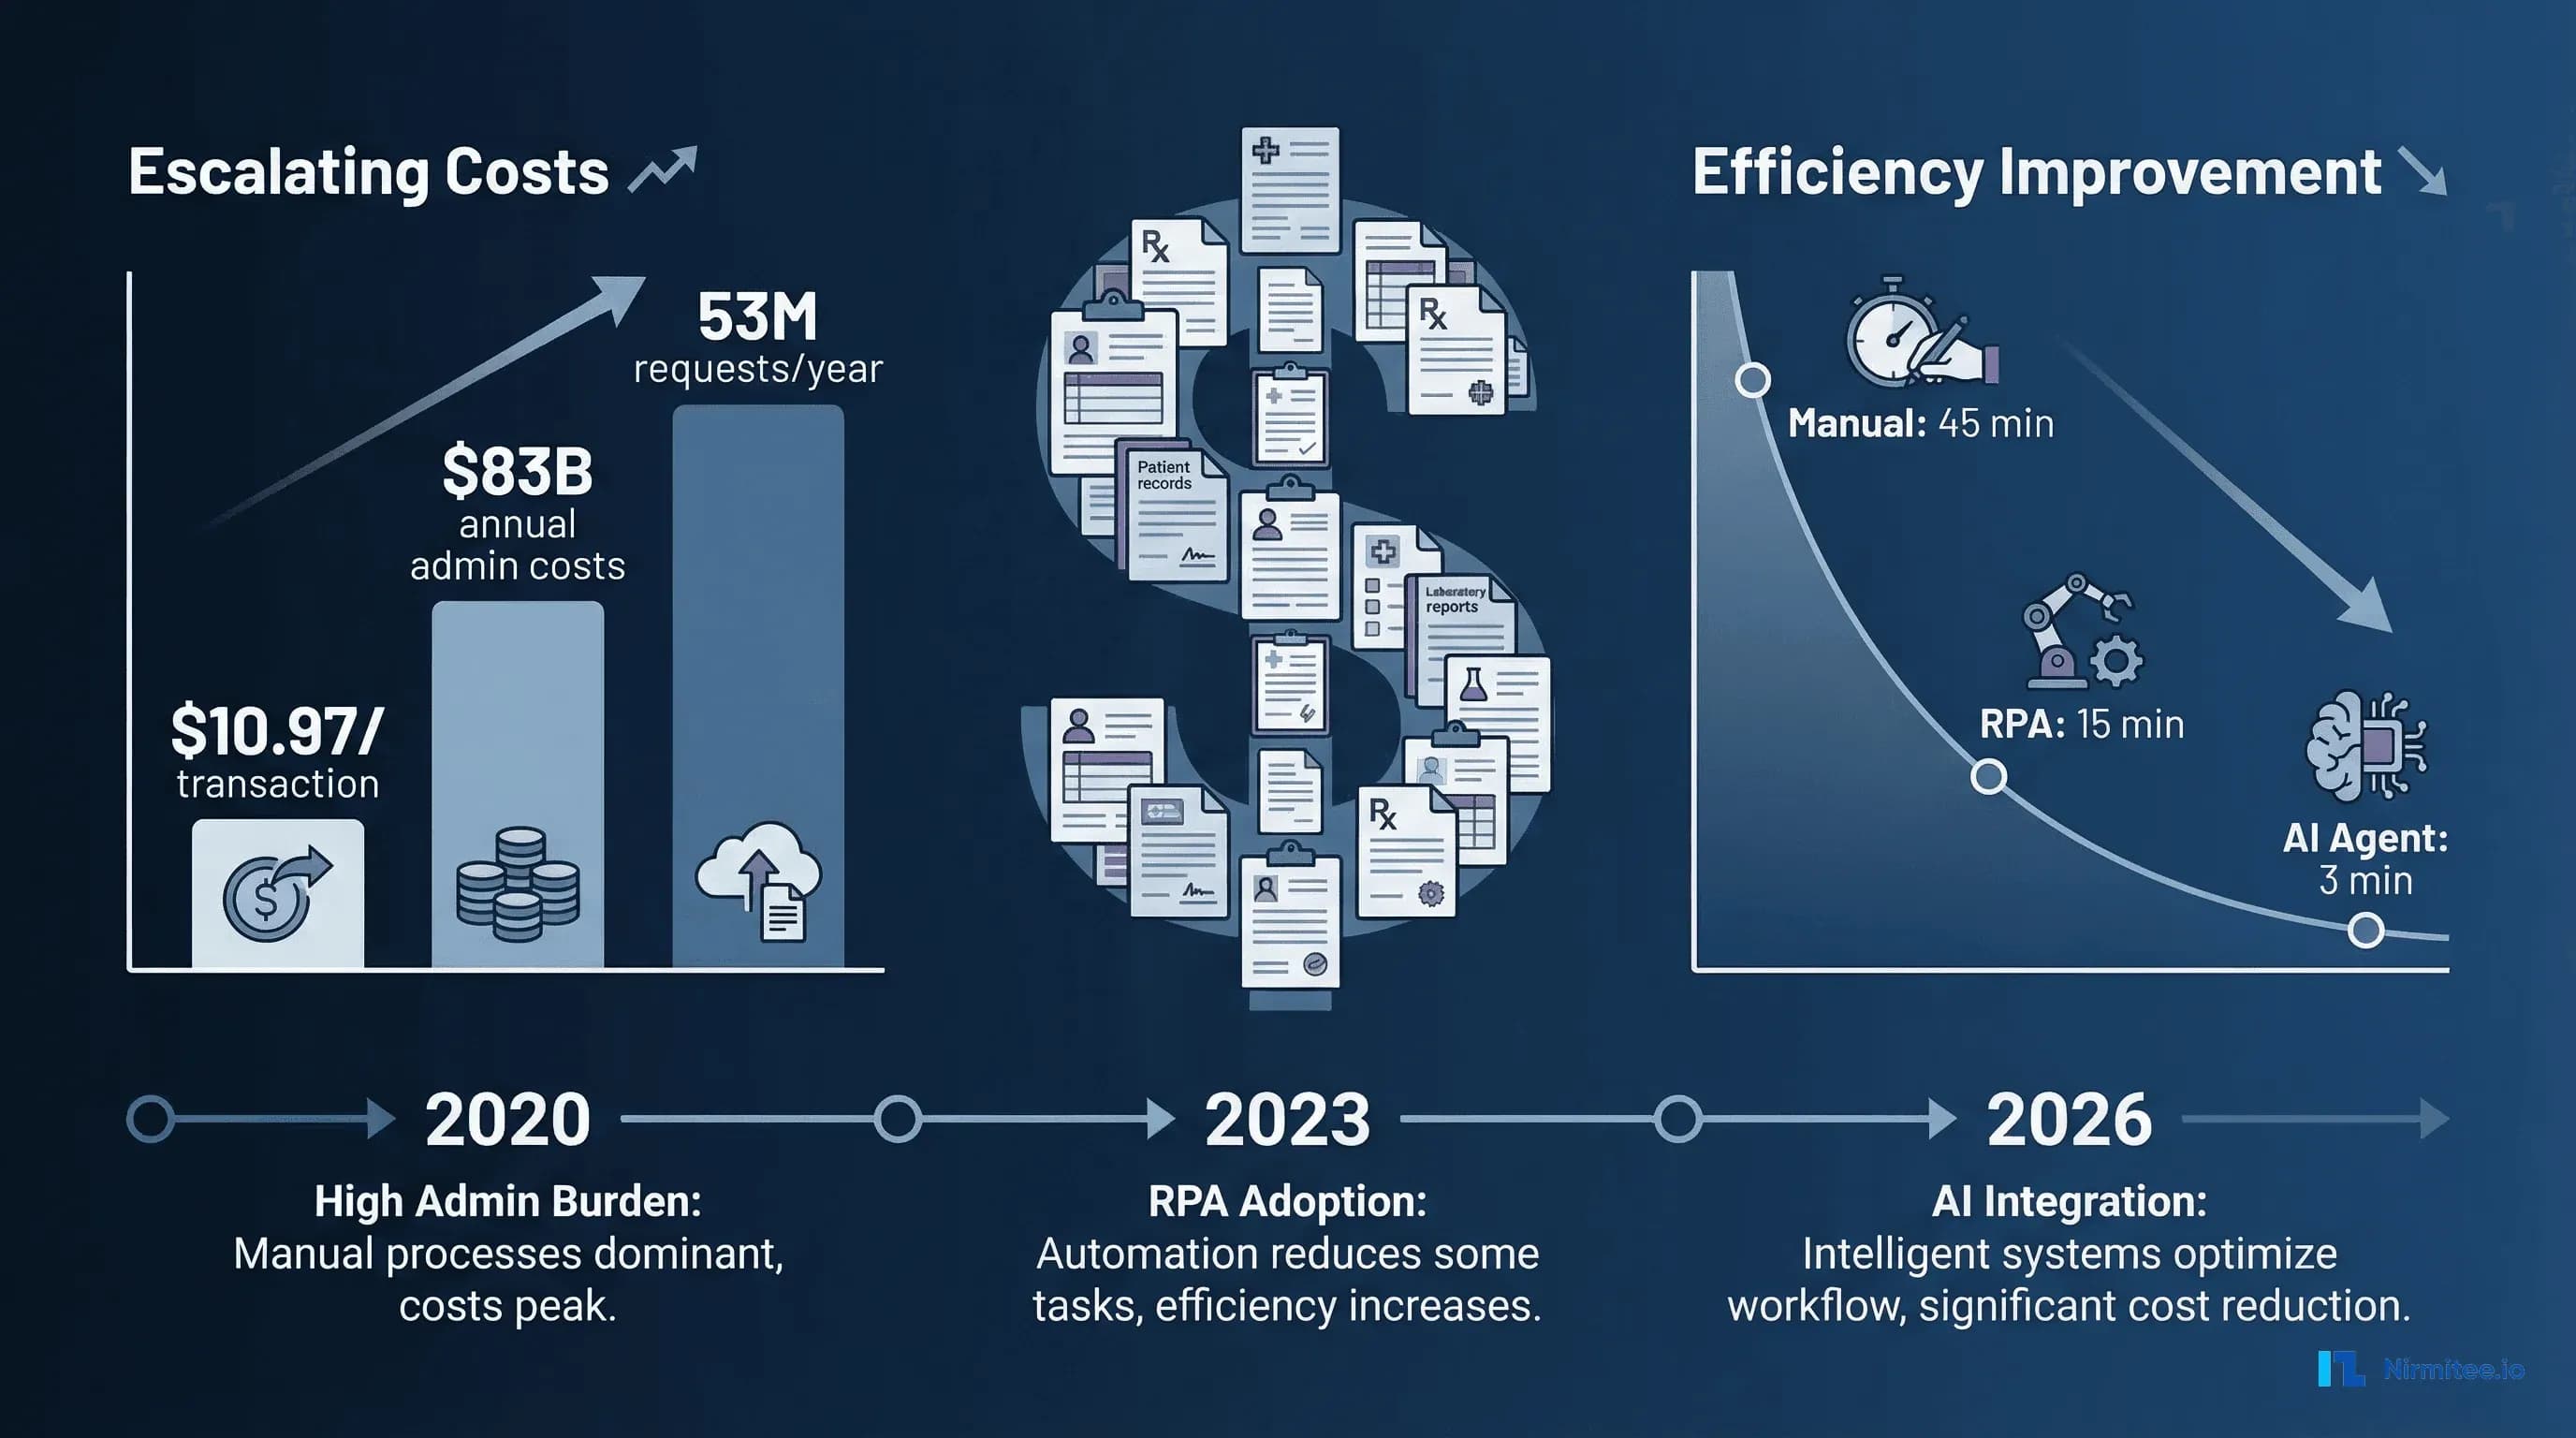
A manual prior authorization transaction costs providers an average of $10.97. A fully electronic prior authorization costs providers $5.79, roughly half the manual cost. But here is the number that reveals the structural inequity in the system: a manual prior authorization costs payers only $3.52. A fully electronic prior authorization costs payers $0.05.
That cost asymmetry is not accidental. Providers bear 97% of the total administrative cost burden across all healthcare administrative transactions. The entity that creates the prior authorization requirement (the payer) pays a fraction of the cost of complying with it (the provider). This misaligned incentive structure is why prior authorization volume continues to grow: payers face minimal cost consequences for adding new requirements.
What $10.97 Actually Buys
That $10.97 per manual transaction includes staff time for information gathering and form completion, phone hold time with payer representatives, fax transmission and confirmation, clinical documentation compilation, follow-up calls for status checks, and appeals preparation when initial requests are denied. When you multiply this across volume, the scale becomes clear. The healthcare industry spends an estimated $83 billion annually on staff time to conduct routine administrative transactions between providers and health plans, according to CAQH. Prior authorization represents one of the most expensive individual transaction types in that total.
Specialty-Specific Cost Differences
The CAQH data reveals significant variation by specialty. Specialists and behavioral health providers take an average of 24 minutes to process a manual prior authorization, which is three times longer than the 8 minutes it takes generalists. Phone-based authorizations show a similar gap: specialists and behavioral health providers spend an average of 25 minutes obtaining a prior authorization via phone, fax, or email, compared to 14 minutes for generalists.
This disparity exists because specialist procedures typically require more complex clinical documentation, face higher scrutiny from utilization management programs, and more frequently trigger peer-to-peer review requirements. For a cardiology practice or oncology clinic, the effective per-transaction cost is significantly higher than the $10.97 average.
The Automation Savings Opportunity
If all medical prior authorization transactions were fully electronic, CAQH estimates spending on prior authorizations would drop by $494 million per year. That is not a theoretical number. It represents the calculable difference between current manual processing costs and what electronic processing would cost at scale. The $20 billion broader opportunity identified by CAQH across all administrative transactions represents approximately 22% of current administrative costs that could be eliminated through automation.
The Volume Problem: 53 Million Requests and Growing
Cost per transaction only tells half the story. The other half is volume, and prior authorization volume is accelerating.
According to KFF's analysis of CMS data, Medicare Advantage insurers alone received nearly 53 million prior authorization requests in 2024, up from 49.8 million in 2023. That represents a 6.4% year-over-year increase in just the Medicare Advantage segment. When you include commercial insurance, Medicaid managed care, and other payer types, the total prior authorization volume across the U.S. healthcare system is estimated to exceed 100 million requests annually.
The growth is being driven by three factors. First, Medicare Advantage enrollment continues to expand. Over 33 million Americans are now enrolled in MA plans, and MA organizations use prior authorization more aggressively than traditional Medicare. Second, payers are expanding the list of services that require prior authorization, particularly for specialty drugs, advanced imaging, and surgical procedures. Third, the shift to value-based care models has paradoxically increased utilization management requirements as payers attempt to control costs while maintaining quality metrics.
For an individual physician practice, the AMA survey reports that physicians complete an average of 43 prior authorizations per week. That translates to roughly 2,236 per physician per year. At $10.97 per manual transaction, a single physician's prior authorization processing costs approximately $24,529 annually in direct administrative expense alone.
The Hidden Costs: What Does Not Show Up in Transaction Data
The CAQH per-transaction cost captures direct administrative processing. It does not capture the downstream costs that prior authorization creates throughout the healthcare system. The 2024 AMA Prior Authorization Physician Survey quantifies many of these hidden costs.
Care Delays and Patient Harm
94% of physicians reported that prior authorization delays access to necessary care. This is not a minor inconvenience. 29% of physicians reported that prior authorization caused a serious adverse event for a patient in their care. Breaking this down further:
- 19% reported an adverse event leading to patient hospitalization
- 13% reported an event leading to a life-threatening situation or requiring intervention to prevent permanent impairment
- 7% reported an event leading to disability, permanent bodily damage, or death
Each of these adverse events has a financial dimension. An avoidable hospitalization costs the health system $10,000 to $50,000 or more. A medical malpractice claim related to delayed care can cost $200,000 to $1 million or more in settlements. These downstream costs dwarf the $10.97 per-transaction administrative cost but are rarely attributed to the prior authorization that caused them.
Treatment Abandonment
78% of physicians reported that patients abandon treatment recommended by their physician due to prior authorization struggles. Treatment abandonment creates a cascade of costs: the patient's condition worsens, they present to the emergency department at higher acuity, they require more intensive and expensive interventions, and outcomes are poorer. A patient who abandons a $5,000 outpatient cardiac procedure due to prior authorization delays may end up in the ED six months later with a $75,000 acute event.
Physician Burnout and Turnover
95% of physicians reported that prior authorization somewhat or significantly increases burnout. Physician burnout has its own economic impact: replacing a single physician costs an organization $500,000 to $1 million in recruitment, onboarding, lost productivity, and revenue during the vacancy period. When 95% of physicians cite prior authorization as a burnout driver, the connection between prior authorization burden and physician turnover costs becomes direct.
Dedicated Staffing Costs
35% of physicians employ staff members who work exclusively on prior authorization tasks. At an average salary of $45,000 to $55,000 per prior authorization specialist (including benefits), a practice with two dedicated PA staff members is spending over $100,000 annually on a function that exists solely because of payer-imposed administrative requirements. Prior authorization requirements consume the equivalent of 12 hours of physician and staff time per week per physician, which translates to 624 hours per year, or roughly 30% of a full-time equivalent position.
Specialty-Specific Impact: Who Gets Hit Hardest
Not all specialties experience prior authorization equally. The data shows clear patterns in which medical specialties bear the greatest burden.
Oncology
88% of hematology/oncology clinicians report facing prior authorization requirements for their treatments. Oncology is uniquely vulnerable to prior authorization harm because cancer treatment is time-sensitive. A two-week delay in starting chemotherapy can meaningfully affect outcomes. Oncology prior authorizations are also among the most complex, often requiring genetic testing results, tumor board documentation, line-of-therapy justification, and clinical trial eligibility assessment. The Health Affairs analysis found that hematology/oncology was among the top specialties by PA request volume (54% of payer respondents identified it as a high-volume specialty).
Cardiology
93% of cardiologists report facing prior authorization requirements. Cardiac procedures, from advanced imaging (cardiac MRI, CT angiography) to interventions (catheterization, stenting, ablation), are among the most frequently authorized services. The high cost of cardiac procedures makes them targets for payer utilization management, but the clinical urgency of many cardiac conditions means delays carry significant risk. A patient waiting two weeks for prior authorization for a stress test may present to the ED with an acute myocardial infarction in the interim.
Orthopedics
Orthopedic procedures, particularly joint replacements, spinal surgeries, and advanced imaging, require extensive prior authorization documentation. Payers typically require evidence of conservative treatment failure (physical therapy records, medication trials, imaging progression) before authorizing surgical intervention. This documentation burden means orthopedic prior authorizations take longer to process and have higher denial rates on initial submission, as documentation requirements are more complex and more frequently deemed "incomplete" by payers.
Radiation Oncology
97% of radiation oncology clinicians report prior authorization requirements, the highest rate of any specialty. Radiation treatment plans are technically complex, and payers frequently require peer-to-peer review with radiation oncology medical directors. The irony is that radiation oncology prior authorization reviews are almost always approved eventually (the clinical necessity is rarely questioned), but the administrative process still consumes days or weeks of elapsed time.
Payer-by-Payer: Who Denies the Most
The KFF analysis of CMS data for 2024 provides the most comprehensive payer-by-payer comparison of prior authorization denial rates available.
Denial Rates by Major Payer (Medicare Advantage, 2024)
| Payer | PA Denial Rate | Appeals Overturn Rate | Post-Acute Care Denial Rate |
|---|---|---|---|
| UnitedHealthcare | 12.8% | ~80% | 22.7% (2022) |
| Aetna (CVS Health) | 11.9% | ~80% | ~3x overall rate |
| Anthem (Elevance Health) | 4.2% | ~80% | Below average |
| Industry Average | 7.7% | 80.7% | Varies widely |
The most striking finding is the appeal overturn rate: 80.7%. More than four out of five denied prior authorization requests are overturned when appealed. This means the majority of denials were inappropriate from the start. The denial did not reflect a genuine clinical determination that the service was unnecessary. It reflected either an administrative error, an algorithmic denial, or a documentation technicality.
A U.S. Senate investigation found that UnitedHealthcare's post-acute care denial rate jumped from 10.9% in 2020 to 22.7% in 2022, a period coinciding with the deployment of algorithmic and AI-driven utilization management tools. The Senate report raised concerns that predictive technology was being used to deny care that would have been approved under traditional clinical review.
The Financial Impact of Inappropriate Denials
Each inappropriate denial that is appealed costs the provider approximately $25 or more per claim in rework costs, excluding the indirect cost of delayed cash flow and patient billing disputes. For a health system processing 50,000 prior authorizations annually with a 10% denial rate and an 80% appeal overturn rate:
- 5,000 denials per year
- 4,000 inappropriate denials (80% overturn rate)
- $25+ per appeal = $100,000+ in annual appeal costs
- Plus: delayed revenue, staff time for appeals, patient dissatisfaction
The CMS-0057-F Mandate: Economic Implications
The CMS Interoperability and Prior Authorization Final Rule (CMS-0057-F) is the most significant regulatory change to prior authorization in decades. Understanding its economic implications is essential for any cost analysis.
What the Rule Requires
Effective January 1, 2026: Impacted payers must respond to prior authorization requests within 72 hours for expedited (urgent) requests and 7 calendar days for standard requests. This is a dramatic reduction from the current reality where prior authorizations routinely take 14 to 30 days.
Effective March 31, 2026: Impacted payers must publicly report prior authorization metrics for calendar year 2025, including approval rates, denial rates, average processing times, and appeal outcomes. This transparency requirement creates market accountability. Providers and patients will be able to compare payers on prior authorization performance for the first time.
Effective January 1, 2027: Impacted payers must implement FHIR-based APIs for prior authorization, including the Prior Authorization API (based on the Da Vinci Prior Authorization Support Implementation Guide), the Patient Access API, and the Provider Directory API. These APIs enable automated, electronic prior authorization submission and status tracking.
Affected Payers
The rule applies to Medicare Advantage organizations, state Medicaid and CHIP programs, Medicaid managed care plans, and Qualified Health Plan (QHP) issuers on the Federally Facilitated Exchanges. Notably, QHP issuers have a later compliance date for API requirements. Commercial insurance plans outside the exchanges are not directly covered by this rule but are likely to follow due to market pressure and state-level legislation.
Economic Impact for Providers
The 7-day response requirement alone has significant economic implications. Currently, the average prior authorization takes 14 to 30 days to process. Reducing this to 7 days means faster patient scheduling, faster revenue recognition, reduced follow-up calls and status checks, and lower treatment abandonment rates. For a mid-size health system, the reduced follow-up burden alone could save 1 to 2 FTEs worth of staff time.
The FHIR API mandate (January 2027) is the game-changer. When payers are required to accept prior authorization requests via standardized FHIR APIs, the entire cost structure changes. Electronic submission eliminates fax-based workflows, phone-based submissions, and web portal data entry. It enables real-time status checking, automated documentation attachment, and programmatic appeal submission. For organizations already invested in prior authorization automation, the FHIR API mandate dramatically reduces the complexity and cost of maintaining payer integrations. For a deeper technical analysis of how these APIs work, see our guide on prior authorization automation with CMS FHIR and AI.
Cost Comparison: Manual vs. RPA vs. AI Agent
With the cost data established, the strategic question becomes: what is the best approach to reducing prior authorization costs? Three models are in active use across the healthcare industry, and the economics of each are meaningfully different.
Manual Processing
| Metric | Manual Processing |
|---|---|
| Cost per transaction | $10.97 (CAQH 2023) |
| Processing time | 24-45 minutes per auth |
| Turnaround time | 14-30 days |
| Error/denial rate | 10-15% initial denial |
| Annual cost (40,000 auths) | $438,800 |
| FTE requirement | 5-7 dedicated staff |
Manual processing remains the dominant model for most healthcare organizations. It is the most expensive per transaction, the slowest, and the most error-prone because it depends on individual staff knowledge of payer-specific requirements that change frequently.
RPA (Robotic Process Automation)
| Metric | RPA |
|---|---|
| Cost per transaction | $3.50-$5.50 |
| Processing time | 10-15 minutes per auth |
| Turnaround time | 3-7 days |
| Error/denial rate | 8-12% initial denial |
| Annual cost (40,000 auths) | $150,000-$250,000 |
| FTE requirement | 2-3 staff + 1 RPA admin |
RPA automates the repetitive data entry and form-filling tasks in prior authorization. Bots log into payer portals, enter patient and procedure information, upload documentation, and check status. RPA reduces cost per transaction by 50-60% and processing time by 60-70%. However, RPA has a fundamental limitation: it is brittle. When a payer portal changes its layout, the RPA bot breaks. Maintaining RPA scripts across dozens of payer portals requires ongoing development effort. Industry data shows RPA saves 700 to 870 hours annually per scheduler and 810 to 980 hours per claims processor.
AI Agent (Agentic AI)
| Metric | AI Agent |
|---|---|
| Cost per transaction | $1.00-$2.50 |
| Processing time | 2-5 minutes per auth |
| Turnaround time | Same-day to 48 hours |
| Error/denial rate | 3-7% initial denial |
| Annual cost (40,000 auths) | $80,000-$150,000 |
| FTE requirement | 1-2 staff (exception handling) |
AI agents represent the next generation of prior authorization automation. Unlike RPA, which follows scripted workflows, AI agents can reason about clinical documentation, understand payer-specific requirements, extract relevant information from unstructured clinical notes, and adapt to changes in payer portals without script updates. The economic advantage compounds: AI agents improve over time through learning from approval and denial patterns, meaning denial rates decrease the longer the system operates. For a comprehensive exploration of how AI agents transform healthcare workflows, see our analysis of agentic AI in revenue cycle management and 5 healthcare workflows agentic AI will transform.
Business Case Framework: Building Your ROI Model
Every healthcare organization's prior authorization cost profile is different. Here is a framework for calculating your specific ROI from automation investment.
Step 1: Calculate Your Current Cost Baseline
Current Annual PA Cost = (Annual PA Volume) x (Cost Per Transaction)
                       + (Dedicated PA Staff Salary x Number of Staff)
                       + (Physician Time Value x Hours Spent on PA)
                       + (Denial Rework Cost x Number of Denials)
                       + (Estimated Revenue Lost to Abandonment)
Example for a 50-physician multispecialty group:
PA Volume:           50 physicians x 43 PAs/week x 50 weeks = 107,500 PAs/year
Transaction Cost:    107,500 x $10.97 = $1,179,275
Dedicated Staff:     3 FTEs x $52,000 = $156,000
Physician Time:      50 physicians x 12 hrs/week x 50 weeks x $150/hr = $4,500,000
Denial Rework:       107,500 x 10% denial rate x $25/appeal = $268,750
Revenue Abandonment: 107,500 x 5% abandonment x $2,000 avg procedure = $10,750,000

TOTAL ANNUAL COST:   $16,854,025
Note: The physician time cost ($4.5M) and revenue abandonment ($10.75M) are the largest components but are typically invisible in financial reporting because they do not appear as line items. They manifest as reduced physician productivity and lower procedural revenue.
Step 2: Model Your Automation Savings
Automation Savings = Current Cost - Automated Cost

Automated Cost = (Annual PA Volume) x (New Cost Per Transaction)
               + (Reduced Staff Salary x Remaining Staff)
               + (Reduced Physician Time Value)
               + (Reduced Denial Rework)
               + (Reduced Revenue Loss)
Same group with AI agent automation:
Transaction Cost:    107,500 x $1.75 = $188,125
Reduced Staff:       1 FTE x $52,000 = $52,000
Physician Time:      50 physicians x 3 hrs/week x 50 weeks x $150/hr = $1,125,000
Denial Rework:       107,500 x 5% x $15/appeal = $80,625
Revenue Abandonment: 107,500 x 2% x $2,000 = $4,300,000

TOTAL AUTOMATED COST: $5,745,750

ANNUAL SAVINGS:       $11,108,275
ROI RATIO:            Savings / Investment = 11x first year
Step 3: Calculate Implementation Timeline
Break-Even Point = Implementation Cost / (Monthly Savings)

For AI Agent:
  Implementation:    $150,000 - $300,000 (integration, training, testing)
  Monthly Savings:   $11,108,275 / 12 = $925,690
  Break-Even:        0.2 - 0.3 months (~1-2 weeks for large groups)

For mid-size practice (10 physicians):
  Implementation:    $50,000 - $100,000
  Monthly Savings:   ~$185,000
  Break-Even:        0.3 - 0.5 months (~1-2 weeks)
The break-even calculations show that prior authorization automation is one of the highest-ROI investments available in healthcare operations. The payback period is measured in weeks, not months, when you account for the full cost picture, including physician time and revenue abandonment.
Step 4: Factor in the CMS-0057-F Effect
The CMS FHIR API mandate (January 2027) will further improve the economics of automation by standardizing payer interfaces. Organizations that invest in automation now will be positioned to leverage FHIR APIs when they become available, further reducing per-transaction costs. Organizations that wait until 2027 will face both the implementation cost and the competitive disadvantage of having operated manually while competitors have automated.
What CMS FHIR Prior Auth APIs Change Economically
The FHIR-based Prior Authorization API mandated by CMS-0057-F fundamentally changes the economics of prior authorization processing in three ways.
1. Elimination of Portal-Specific Integration Costs
Today, automating prior authorization requires building and maintaining integrations with each payer's proprietary web portal. A health system contracting with 20 payers needs 20 different integrations, each with its own authentication, data format, and workflow. When a payer redesigns their portal, the integration breaks. The FHIR API mandate standardizes this. One API specification works across all compliant payers. The cost of maintaining payer integrations drops from $5,000 to $15,000 per payer per year to near zero for the API layer.
2. Real-Time Status and Decision Transparency
FHIR APIs enable real-time submission and status checking. Instead of submitting a prior authorization and calling back in 7 days, providers can query the API for immediate status updates. This eliminates the estimated 3 to 5 follow-up contacts per prior authorization that staff currently make, saving approximately $3 to $5 per authorization in follow-up costs alone.
3. Structured Data Reduces Denial Rates
FHIR-based submissions use structured clinical data (FHIR resources like Claim, Condition, Procedure, and supporting DocumentReference) instead of free-text faxes or PDF uploads. Structured data enables automated medical necessity checks against payer criteria, reducing "incomplete documentation" denials, which account for the majority of initial denials. The economic impact: a 30 to 50% reduction in initial denial rates, saving $2.50 to $5.00 per transaction in avoided appeal costs.
The Compound Cost: Adding It All Up
When you combine the data from CAQH, AMA, and CMS, the total cost of prior authorization to the U.S. healthcare system is staggering.
| Cost Category | Annual Estimate | Source |
|---|---|---|
| Direct administrative processing | $83 billion (all admin transactions) | CAQH 2023 Index |
| Physician time on PA (estimated) | $35-40 billion | AMA Survey + physician compensation data |
| Denial rework and appeals | $1-2 billion | CAQH + KFF denial data |
| Care delays and adverse events | $10-25 billion (estimated) | AMA Survey + hospitalization cost data |
| Treatment abandonment | $20-50 billion (estimated) | AMA Survey + procedure revenue data |
| Physician turnover attributed to burnout | $5-10 billion (estimated) | AMA burnout data + replacement cost studies |
The directly measurable costs (administrative processing, denial rework) are significant but represent a fraction of the total economic impact. The indirect costs (physician time, care delays, treatment abandonment, burnout-driven turnover) are larger by an order of magnitude but are diffused across the system in ways that make them invisible to any single decision-maker's P&L statement.
This is precisely why prior authorization reform has been so slow despite universal agreement that the current system is broken. The costs are real but dispersed, while the savings from the payer perspective (reduced utilization of authorized services) are concentrated and visible.


