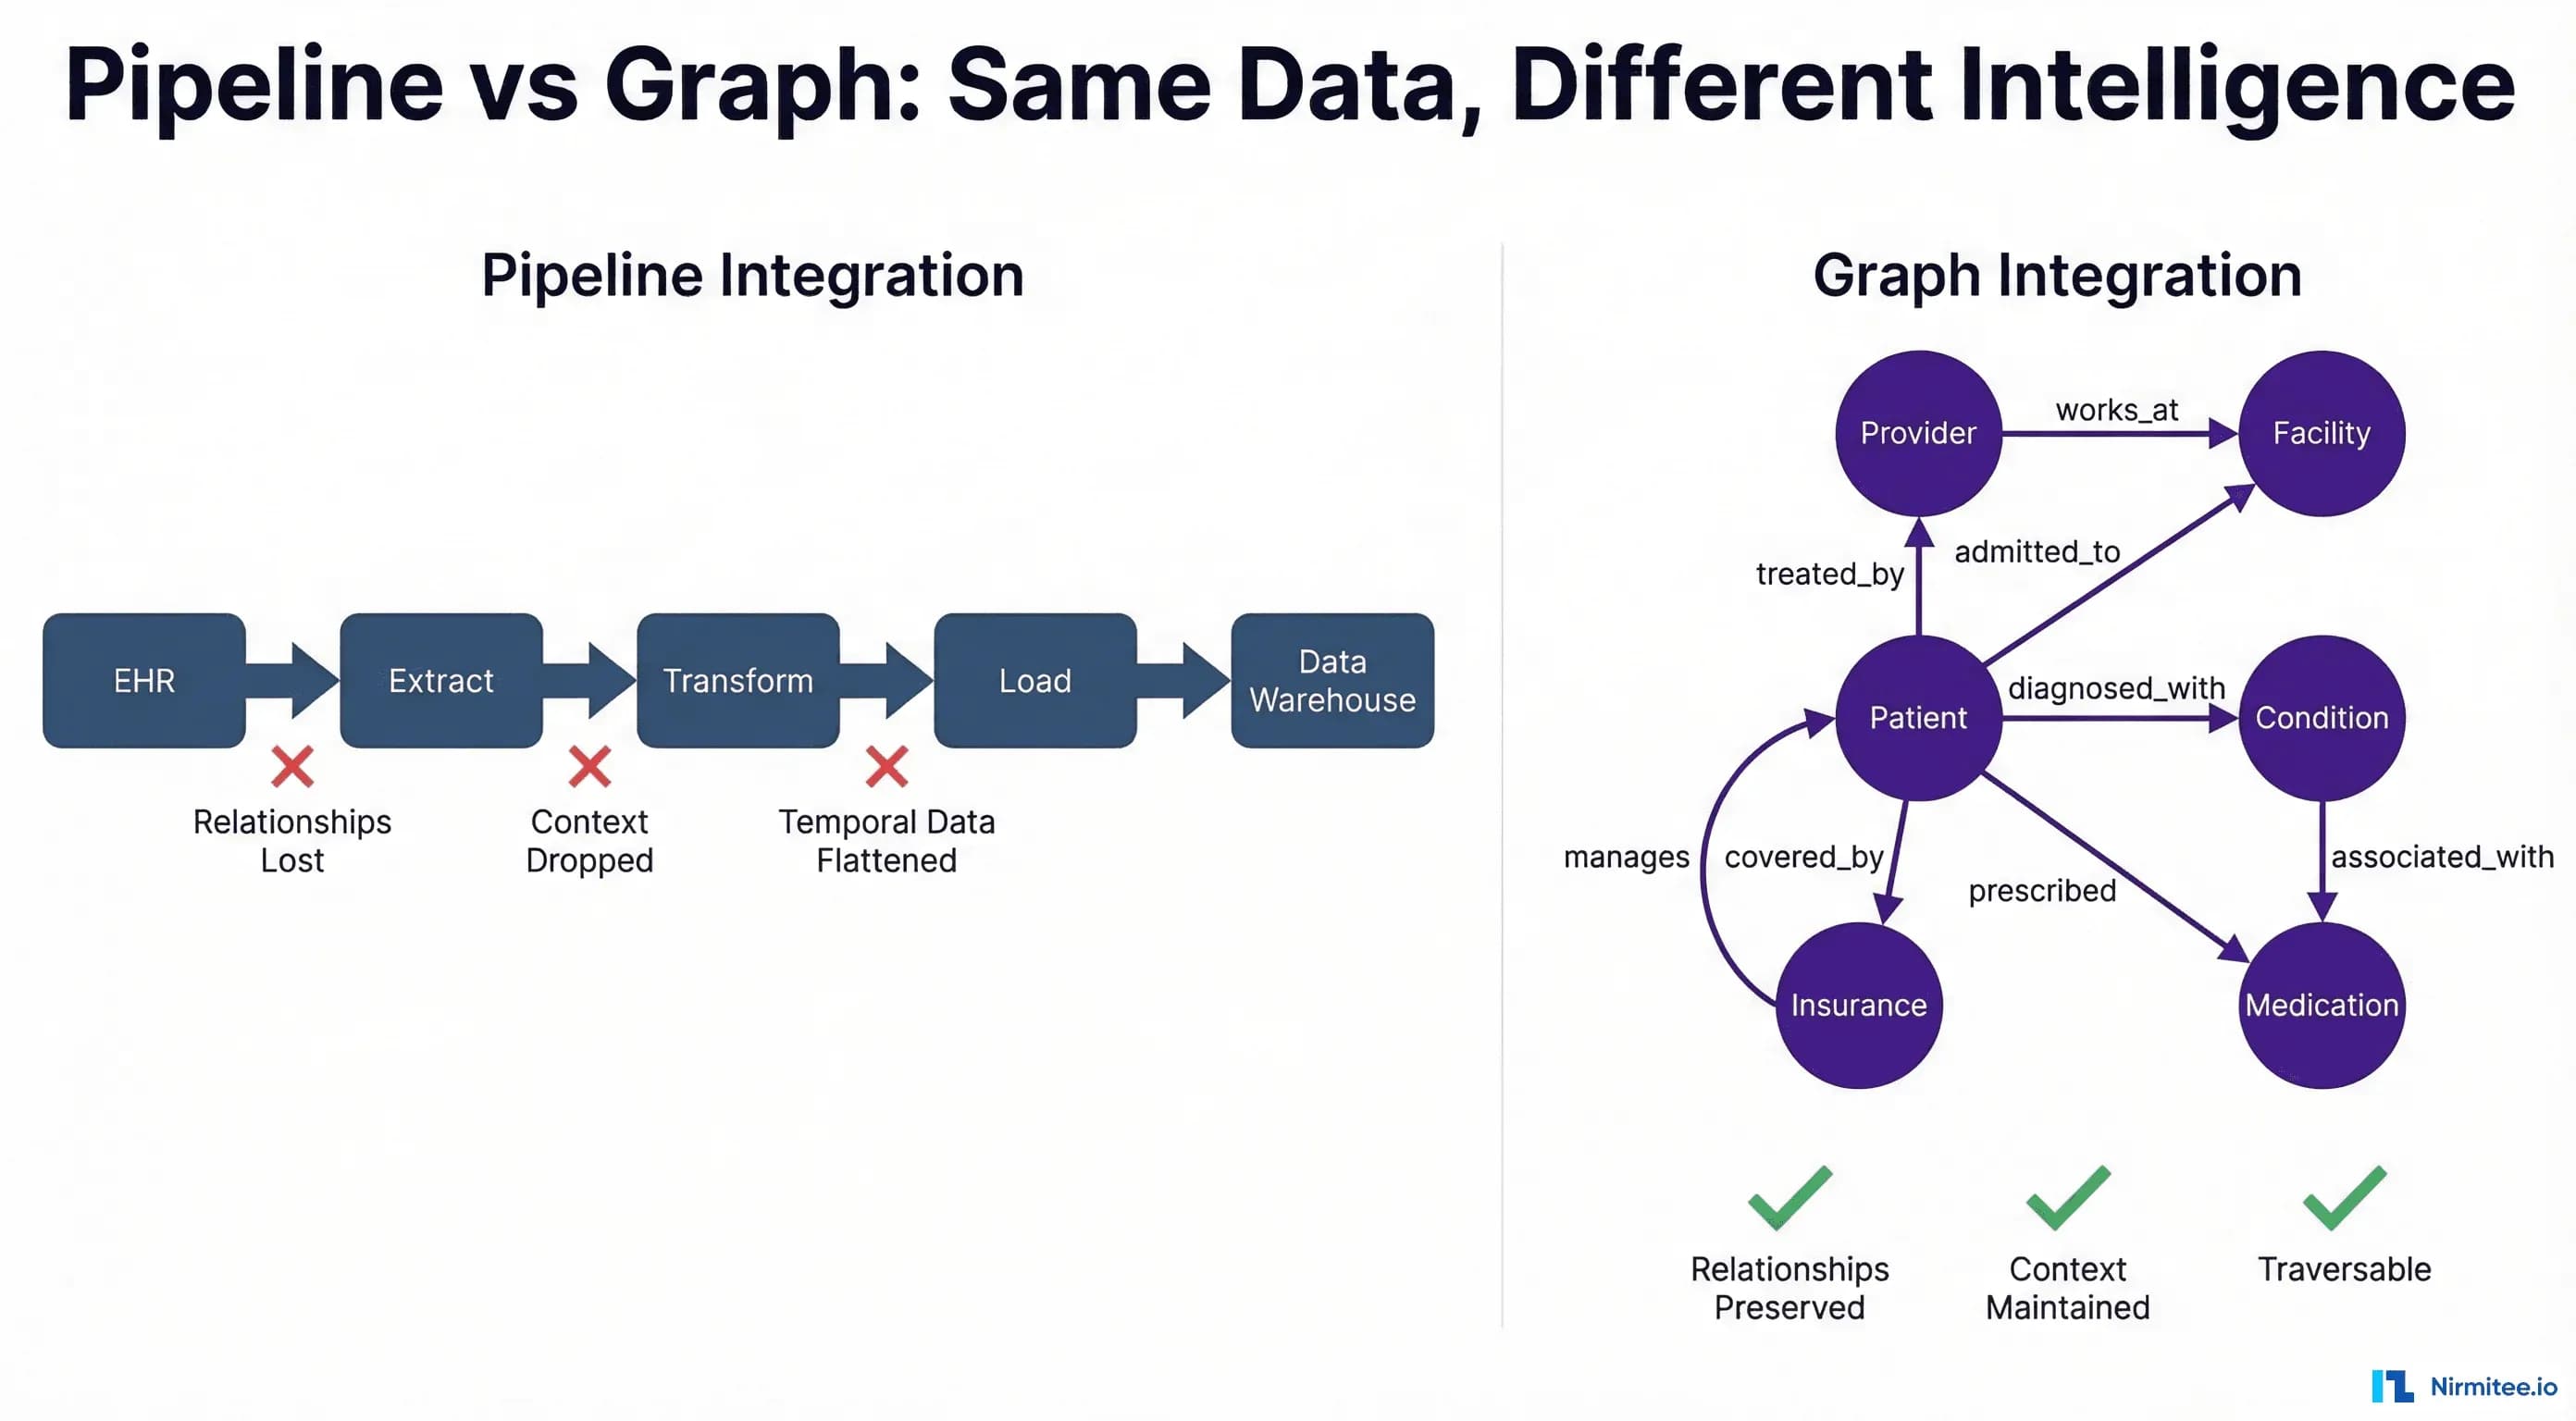
Every healthcare CTO has seen the architecture diagram: EHR data flows into an extract layer, gets transformed through business rules, loads into a warehouse, and finally reaches the analytics team. It is clean. It is linear. It is fundamentally wrong.
This ETL pipeline model — the dominant paradigm for healthcare data integration since the 1990s — treats clinical data as if it were retail transactions or web clickstreams. Source, transform, load, destination. But healthcare data is not a stream of independent events. It is a deeply interconnected web of relationships between patients, providers, facilities, conditions, medications, devices, payers, and time itself.
When you flatten a graph into a pipeline, you do not just lose performance. You lose meaning.
This article makes the case that healthcare integration is fundamentally a graph problem — and that the industry's continued reliance on pipeline-centric thinking is the root cause of fragmented care, missed interactions, and AI systems that hallucinate because they lack relational context.
The Pipeline Fallacy
The traditional healthcare data integration architecture follows a predictable pattern:
- Extract — Pull data from Epic, Cerner, Allscripts, lab systems, claims clearinghouses, pharmacy benefit managers
- Transform — Map HL7v2 segments to a common data model, apply business rules, deduplicate patients, normalize codes (ICD-10, SNOMED CT, RxNorm, CPT)
- Load — Insert into a relational data warehouse or data lake (Snowflake, Databricks, BigQuery)
- Serve — Power dashboards, reports, analytics, and increasingly, AI models
This architecture works beautifully when your data is tabular by nature. E-commerce orders, financial transactions, web analytics — these are genuinely flat. An order has a customer, a product, a timestamp, and a price. The relationships are simple and hierarchical.
Healthcare data is categorically different. Consider a single patient encounter:
- A patient (John Smith) arrives at Mercy Hospital (facility)
- He is seen by Dr. Sarah Chen (attending) and Dr. James Park (consulting cardiologist)
- Dr. Park was referred by John's PCP, Dr. Lisa Wong, who practices at a different facility
- John has Type 2 Diabetes (condition) managed with Metformin 500mg (medication) prescribed by Dr. Wong
- Dr. Park orders an echocardiogram (procedure) because John's diabetes increases his cardiovascular risk (clinical reasoning chain)
- The echo is performed by Tech Martinez and read by Dr. Park
- Results trigger a Medication Request for Lisinopril 10mg, which must be checked against John's Metformin for drug interactions
- The entire encounter is billed to UnitedHealthcare (payer) under a specific plan with pre-authorization requirements
Count the entities: patient, three providers, two facilities, two conditions, two medications, one procedure, one device, one payer, one plan. Count the relationships: at least fifteen distinct connections, each carrying clinical meaning. And this is a single encounter.
Now try to represent this in a pipeline. The ETL approach flattens this into rows:
patient_id | encounter_id | provider_id | facility_id | condition_code | medication_id
P001       | E5001        | PROV_CHEN   | FAC_MERCY   | E11.9          | MED_METFORMIN
P001       | E5001        | PROV_PARK   | FAC_MERCY   | I10            | MED_LISINOPRIL
P001       | E5001        | PROV_WONG   | FAC_CLINIC  | E11.9          | MED_METFORMIN
Three rows. Fifteen relationships collapsed into foreign key references. The clinical reasoning chain — why Dr. Park ordered the echo, how Dr. Wong's referral connects two facilities, when the medication change happened relative to the diagnosis — all of it is gone.
The pipeline did not fail. It did exactly what pipelines do: it moved data from point A to point B. The problem is that moving data is not the same as preserving knowledge.
Healthcare Data IS a Graph
If you draw healthcare data as it actually exists — not as database schemas force it to exist — you get a graph every single time.
Healthcare data is a property graph with:
- Nodes (entities): Patients, Providers, Facilities, Conditions, Medications, Procedures, Devices, Payers, Plans, Encounters, Observations
- Edges (relationships): treated_by, diagnosed_with, prescribed, referred_to, admitted_to, performed_at, covered_by, interacts_with, contraindicated_for
- Properties (attributes on both): timestamps, dosages, severity scores, billing codes, authorization statuses, confidence levels
This is not a metaphor. This is the literal structure of clinical data. The FHIR GraphDefinition resource exists precisely because HL7 recognized that FHIR resources form a graph. SNOMED CT is a directed acyclic graph with over 350,000 concepts and 1.5 million relationships. ICD-10 is a hierarchical graph. RxNorm models drug relationships as a graph. The entire clinical ontology stack is graph-native.
When we force this into relational tables, we are not "structuring" the data — we are destructuring it. We are taking a rich, connected knowledge representation and breaking it into disconnected fragments that happen to share foreign keys.
The Relationship Density Problem
Healthcare data has extraordinarily high relationship density compared to other domains. Research from the Neo4j Healthcare Network demonstrates that a typical patient record involves an average of 80-120 distinct entity relationships across a single year of care. In a relational model, querying these relationships requires JOIN operations that grow exponentially:
| Query Depth | Relational (JOINs) | Graph (Traversals) | Performance Ratio |
|---|---|---|---|
| 1-hop (patient → provider) | 1 JOIN, ~2ms | 1 traversal, ~1ms | 2x |
| 2-hop (patient → provider → facility) | 2 JOINs, ~15ms | 2 traversals, ~2ms | 7.5x |
| 3-hop (patient → provider → facility → other patients) | 3 JOINs, ~180ms | 3 traversals, ~4ms | 45x |
| 4-hop (care network analysis) | 4 JOINs, ~2,400ms | 4 traversals, ~8ms | 300x |
| 5-hop (population-level graph) | 5 JOINs, ~48,000ms | 5 traversals, ~15ms | 3,200x |
A 2025 study published in medRxiv demonstrated that Neo4j achieved 5.4x to 48.4x faster execution times compared to PostgreSQL across five clinical query types using MIMIC-IV data (1,504 patients, 4,967 admissions). The performance gap widens dramatically with relationship depth — precisely the kind of queries that clinical decision support, care coordination, and population health analytics require.
What Gets Lost in Pipeline Integration
The cost of pipeline thinking is not theoretical. It manifests as concrete clinical and operational failures that healthcare organizations experience daily but rarely attribute to their data architecture.
1. Relationship Context
In a graph, the relationship between Dr. Wong and John Smith carries properties: she has been his PCP since 2019, she manages his diabetes, she referred him to cardiology. In a pipeline, this becomes a row in a patient_provider junction table with a provider_type column. The temporal depth, the clinical reasoning, and the referral chain disappear.
This matters for care coordination. When John arrives at the ER at 2 AM with chest pain, the ER physician needs to know not just who his providers are, but how they relate to each other and to his conditions. A graph traversal answers "show me every provider who has treated this patient, the conditions they manage, and the facilities they practice at" in a single query. A relational model requires joining patient_provider, provider_facility, patient_condition, and provider_condition tables — and even then misses the referral chain.
2. Temporal Relationships
Clinical events have temporal dependencies that create causation chains. John's diabetes diagnosis (2019) led to Metformin prescription (2019), which was followed by periodic HbA1c monitoring (quarterly), which revealed worsening control (2024), which triggered the cardiology referral (2024), which led to the echocardiogram (2024), which revealed left ventricular hypertrophy (2024), which led to the Lisinopril prescription (2024).
In a graph, this is a temporal chain — a path through time-stamped edges that tells the clinical story. In a pipeline, these are rows in different tables with timestamps that require manual correlation. No standard ETL tool preserves temporal causation chains because they are relationships between relationships — a concept that relational databases cannot natively represent.
3. Indirect Connections
Some of the most clinically important information exists in indirect connections — paths that require traversing through intermediate nodes. Examples:
- Shared provider networks: Two patients who share the same PCP and cardiologist may have correlated outcomes — useful for population health
- Drug interaction chains: Drug A interacts with Drug B, which shares a metabolic pathway with Drug C (which the patient also takes) — a 2-hop interaction invisible to pairwise lookup tables
- Facility-acquired conditions: Patients treated at Facility X by Provider Y during Time Period Z develop similar complications — a pattern detectable only through multi-dimensional graph traversal
- Insurance network effects: A payer's prior authorization denial patterns correlate with specific diagnosis-procedure combinations at specific facilities — a 3-hop analysis
Pipeline architectures fundamentally cannot discover indirect connections because they require traversal — following edges through intermediate nodes. JOINs can simulate this for known patterns, but they cannot discover patterns because you must specify the join path in advance. Graphs enable exploration.
4. Care Team Topology
A patient's care team is not a list — it is a social graph. Providers refer to each other, consult with each other, share patients, practice at overlapping facilities, and have hierarchical relationships (attending → resident → intern). This topology determines how information flows (or fails to flow) in clinical care.
When a care coordination platform represents the care team as a flat list (SELECT provider_name FROM care_team WHERE patient_id = ?), it loses the network structure that determines whether Dr. Park will actually receive Dr. Wong's referral notes, whether the ER physician can reach the on-call cardiologist, and whether discharge instructions will reach the outpatient follow-up team.
Graph Thinking for Healthcare
Adopting graph thinking does not mean replacing every PostgreSQL instance with Neo4j. It means modeling healthcare problems as graph problems first, then choosing the right technology to solve them. Here are five domain-specific applications where graph thinking transforms outcomes.
Patient Journey as a Graph (Not a Table)
The patient journey is typically represented as a timeline or a funnel — linear models borrowed from marketing. But a patient journey is actually a directed graph where:
- Nodes represent clinical states (healthy, symptomatic, diagnosed, treated, recovering, chronic management)
- Edges represent transitions (symptom onset, diagnosis, treatment initiation, adverse event, remission, relapse)
- Edge properties carry probabilities, costs, and time-to-transition
This graph representation enables questions that timelines cannot answer: "What is the most common path from Type 2 Diabetes diagnosis to hospitalization?" "Which transition points have the highest drop-off in care adherence?" "For patients who eventually achieve HbA1c control, what was the average number of medication changes, and which provider transitions correlated with improvement?"
Graph algorithms like shortest path (most efficient care pathway), betweenness centrality (which clinical events are bottlenecks), and community detection (which patient subgroups follow similar journeys) turn patient journey analysis from descriptive reporting into predictive, actionable intelligence.
Care Team as a Social Graph
Care coordination failures are the number one cause of adverse events in healthcare. The Joint Commission reports that communication failures contribute to 70% of sentinel events. Yet most care coordination platforms model the care team as a list, not a network.
Model the care team as a social graph where providers are nodes and edges represent communication channels (referrals, consult notes, shared patients, co-located at same facility). Apply social network analysis:
- Degree centrality: Which provider is the most connected? (Usually the PCP — and if they leave, the network fragments)
- Betweenness centrality: Which provider sits between otherwise disconnected sub-teams? (The specialist who bridges primary care and hospital care)
- Clustering coefficient: How tightly connected is the care team? (Low clustering = information silos)
- Shortest path: What is the fastest communication route between two providers who need to coordinate?
A health system in the UK using Graphnet's population health platform found that network-aware care coordination reduced hospital admissions by 40% for high-need patients and 34% for care home residents by identifying and strengthening weak links in care team networks.
Medication Interactions as a Graph Problem
Drug-drug interaction (DDI) detection is one of the strongest use cases for graph databases in healthcare. Current DDI systems use pairwise lookup tables — Drug A interacts with Drug B. But pharmacology does not work in pairs.
Research published in PMC demonstrates that attention-based Graph Neural Networks on drug molecular graphs can predict DDIs that pairwise lookup tables miss. The key insight: drugs interact through shared metabolic pathways, protein binding sites, and enzymatic cascades — all of which are graph structures.
Consider a patient on three medications:
- Warfarin (anticoagulant) — metabolized by CYP2C9
- Fluconazole (antifungal) — inhibits CYP2C9
- Metformin (diabetes) — no direct interaction with either
A pairwise DDI table flags Warfarin+Fluconazole (direct inhibition). But it misses that Metformin can cause lactic acidosis, which combined with Warfarin's bleeding risk creates a compounded adverse event profile — detectable only by traversing the metabolic pathway graph through shared organ systems (liver, kidney).
A knowledge graph approach models drugs, enzymes, pathways, organs, and adverse effects as nodes, with relationships like metabolized_by, inhibits, excreted_via, and causes. Graph traversal then finds multi-hop interaction chains that no lookup table contains.
Disease Progression as a Temporal Graph
Chronic disease progression is not linear — it branches, loops, and has conditional transitions. Modeling it as a temporal graph (where time is encoded on edges) enables:
- Progression prediction: Given a patient's current position in the disease graph, what are the probable next states?
- Intervention timing: At which graph node (disease state) does intervention have the highest impact on downstream outcomes?
- Comorbidity cascades: How does adding a new condition (node) create new edges to existing conditions, medications, and risk factors?
For example, the progression from pre-diabetes → Type 2 Diabetes → diabetic retinopathy → vision loss is a path in a disease graph. But that path has branches: diabetes also connects to cardiovascular disease, nephropathy, and neuropathy. Each branch has different progression rates, risk factors, and intervention points. Graph algorithms can identify the highest-risk branches for a specific patient based on their unique graph neighborhood.
Claims and Billing as a Financial Graph
Healthcare fraud costs the US healthcare system an estimated $300 billion annually according to the National Health Care Anti-Fraud Association. In June 2025, the Department of Justice's healthcare fraud takedown identified $14.6 billion in fraudulent claims across 324 defendants — detected primarily through graph analytics that identified aberrant billing network patterns.
Claims data naturally forms a bipartite graph: providers on one side, patients on the other, with claims as edges. Add facilities, diagnosis codes, procedure codes, and payers, and you get a rich multi-partite graph. Fraud patterns manifest as graph anomalies:
- Unusually dense subgraphs: A provider billing for an improbable number of patients (phantom billing)
- Biclique patterns: A group of providers and patients all connected to each other (kickback rings)
- Temporal burst patterns: Sudden spikes in edge creation between specific nodes (upcoding campaigns)
- Degree anomalies: A patient connected to providers across geographically impossible distances (identity fraud)
Graph Neural Networks (GNNs) applied to claims graphs outperform traditional machine learning methods for fraud detection because they capture the structural context that table-based models cannot: the topology of the billing network, not just the statistics of individual claims.
Graph Databases for Healthcare
Three graph database platforms dominate the healthcare space, each with distinct strengths:
Neo4j: The Clinical Knowledge Graph Standard
Neo4j is the most widely deployed graph database in healthcare and life sciences. Its property graph model maps naturally to clinical data, and the Cypher query language is accessible to analysts who know SQL.
Best for: Clinical knowledge graphs, patient journey analysis, care coordination networks, drug interaction detection, real-time clinical decision support
Healthcare-specific advantages:
- Native graph storage (index-free adjacency) — constant-time traversals regardless of dataset size
- APOC library with 450+ graph algorithms including medical-relevant ones (shortest path, community detection, PageRank)
- Graph Data Science library for ML on graphs (node classification, link prediction, graph embeddings)
- MediGRAF framework for integrating MIMIC-IV clinical data with SNOMED CT ontology
- HIPAA-eligible deployment on Neo4j Aura (managed cloud)
Example Cypher query — Find all providers treating a patient and their shared patients:
MATCH (p:Patient {id: 'patient-john-smith'})-[:TREATED_BY]->(provider:Provider)
OPTIONAL MATCH (provider)-[:TREATS]->(other:Patient)
WHERE other.id <> p.id
RETURN provider.name, collect(DISTINCT other.name) AS shared_patients,
       count(DISTINCT other) AS shared_count
ORDER BY shared_count DESC
Amazon Neptune: The AWS-Native Option
For organizations already on AWS — which includes a significant portion of healthcare enterprises using AWS GovCloud for HIPAA workloads — Amazon Neptune offers a fully managed graph database with native AWS integration.
Best for: AWS-heavy organizations, HIPAA-regulated workloads requiring managed infrastructure, RDF/SPARQL use cases (clinical ontologies), integration with AWS HealthLake FHIR store
Healthcare-specific advantages:
- HIPAA-eligible managed service with encryption at rest and in transit
- VPC isolation for PHI protection
- Supports both property graphs (openCypher/Gremlin) and RDF graphs (SPARQL)
- Native integration with AWS HealthLake for FHIR-to-graph pipelines
- Neptune ML for graph-based machine learning (powered by DGL and GNN)
TigerGraph: The Scale Champion
TigerGraph excels at large-scale graph analytics — processing billion-edge graphs in real time. For health systems with massive claims databases, population-level analytics, or real-time fraud detection, TigerGraph's parallel processing architecture offers significant performance advantages.
Best for: Population health analytics at scale, real-time fraud detection, payer analytics across millions of claims, large health system networks
Healthcare-specific advantages:
- Up to 377x faster than other graph databases on multi-hop queries (critical for network analysis)
- Native parallel graph computation for population-level analysis
- Built-in graph algorithms optimized for fraud detection patterns
- GSQL language designed for complex analytical queries
When to Use Which
| Use Case | Recommended | Why |
|---|---|---|
| Clinical knowledge graph | Neo4j | Best Cypher support, richest healthcare ecosystem, GDS library |
| FHIR-native graph store | Neptune | AWS HealthLake integration, SPARQL for RDF ontologies |
| Population health (10M+ patients) | TigerGraph | Parallel processing, massive scale, real-time analytics |
| Fraud detection (real-time) | TigerGraph | Fastest multi-hop traversals, built-in pattern matching |
| Care coordination network | Neo4j | Social network algorithms, visualization tools, intuitive queries |
| Drug interaction knowledge base | Neo4j | Property graph model, biomedical ontology integration |
| HIPAA-regulated cloud deployment | Neptune | Fully managed, VPC-isolated, AWS GovCloud eligible |
FHIR Resources ARE Graphs
Here is the irony that should keep every healthcare data architect awake at night: FHIR — the standard the industry is betting everything on — is inherently a graph specification. And most implementations flatten it into relational tables.
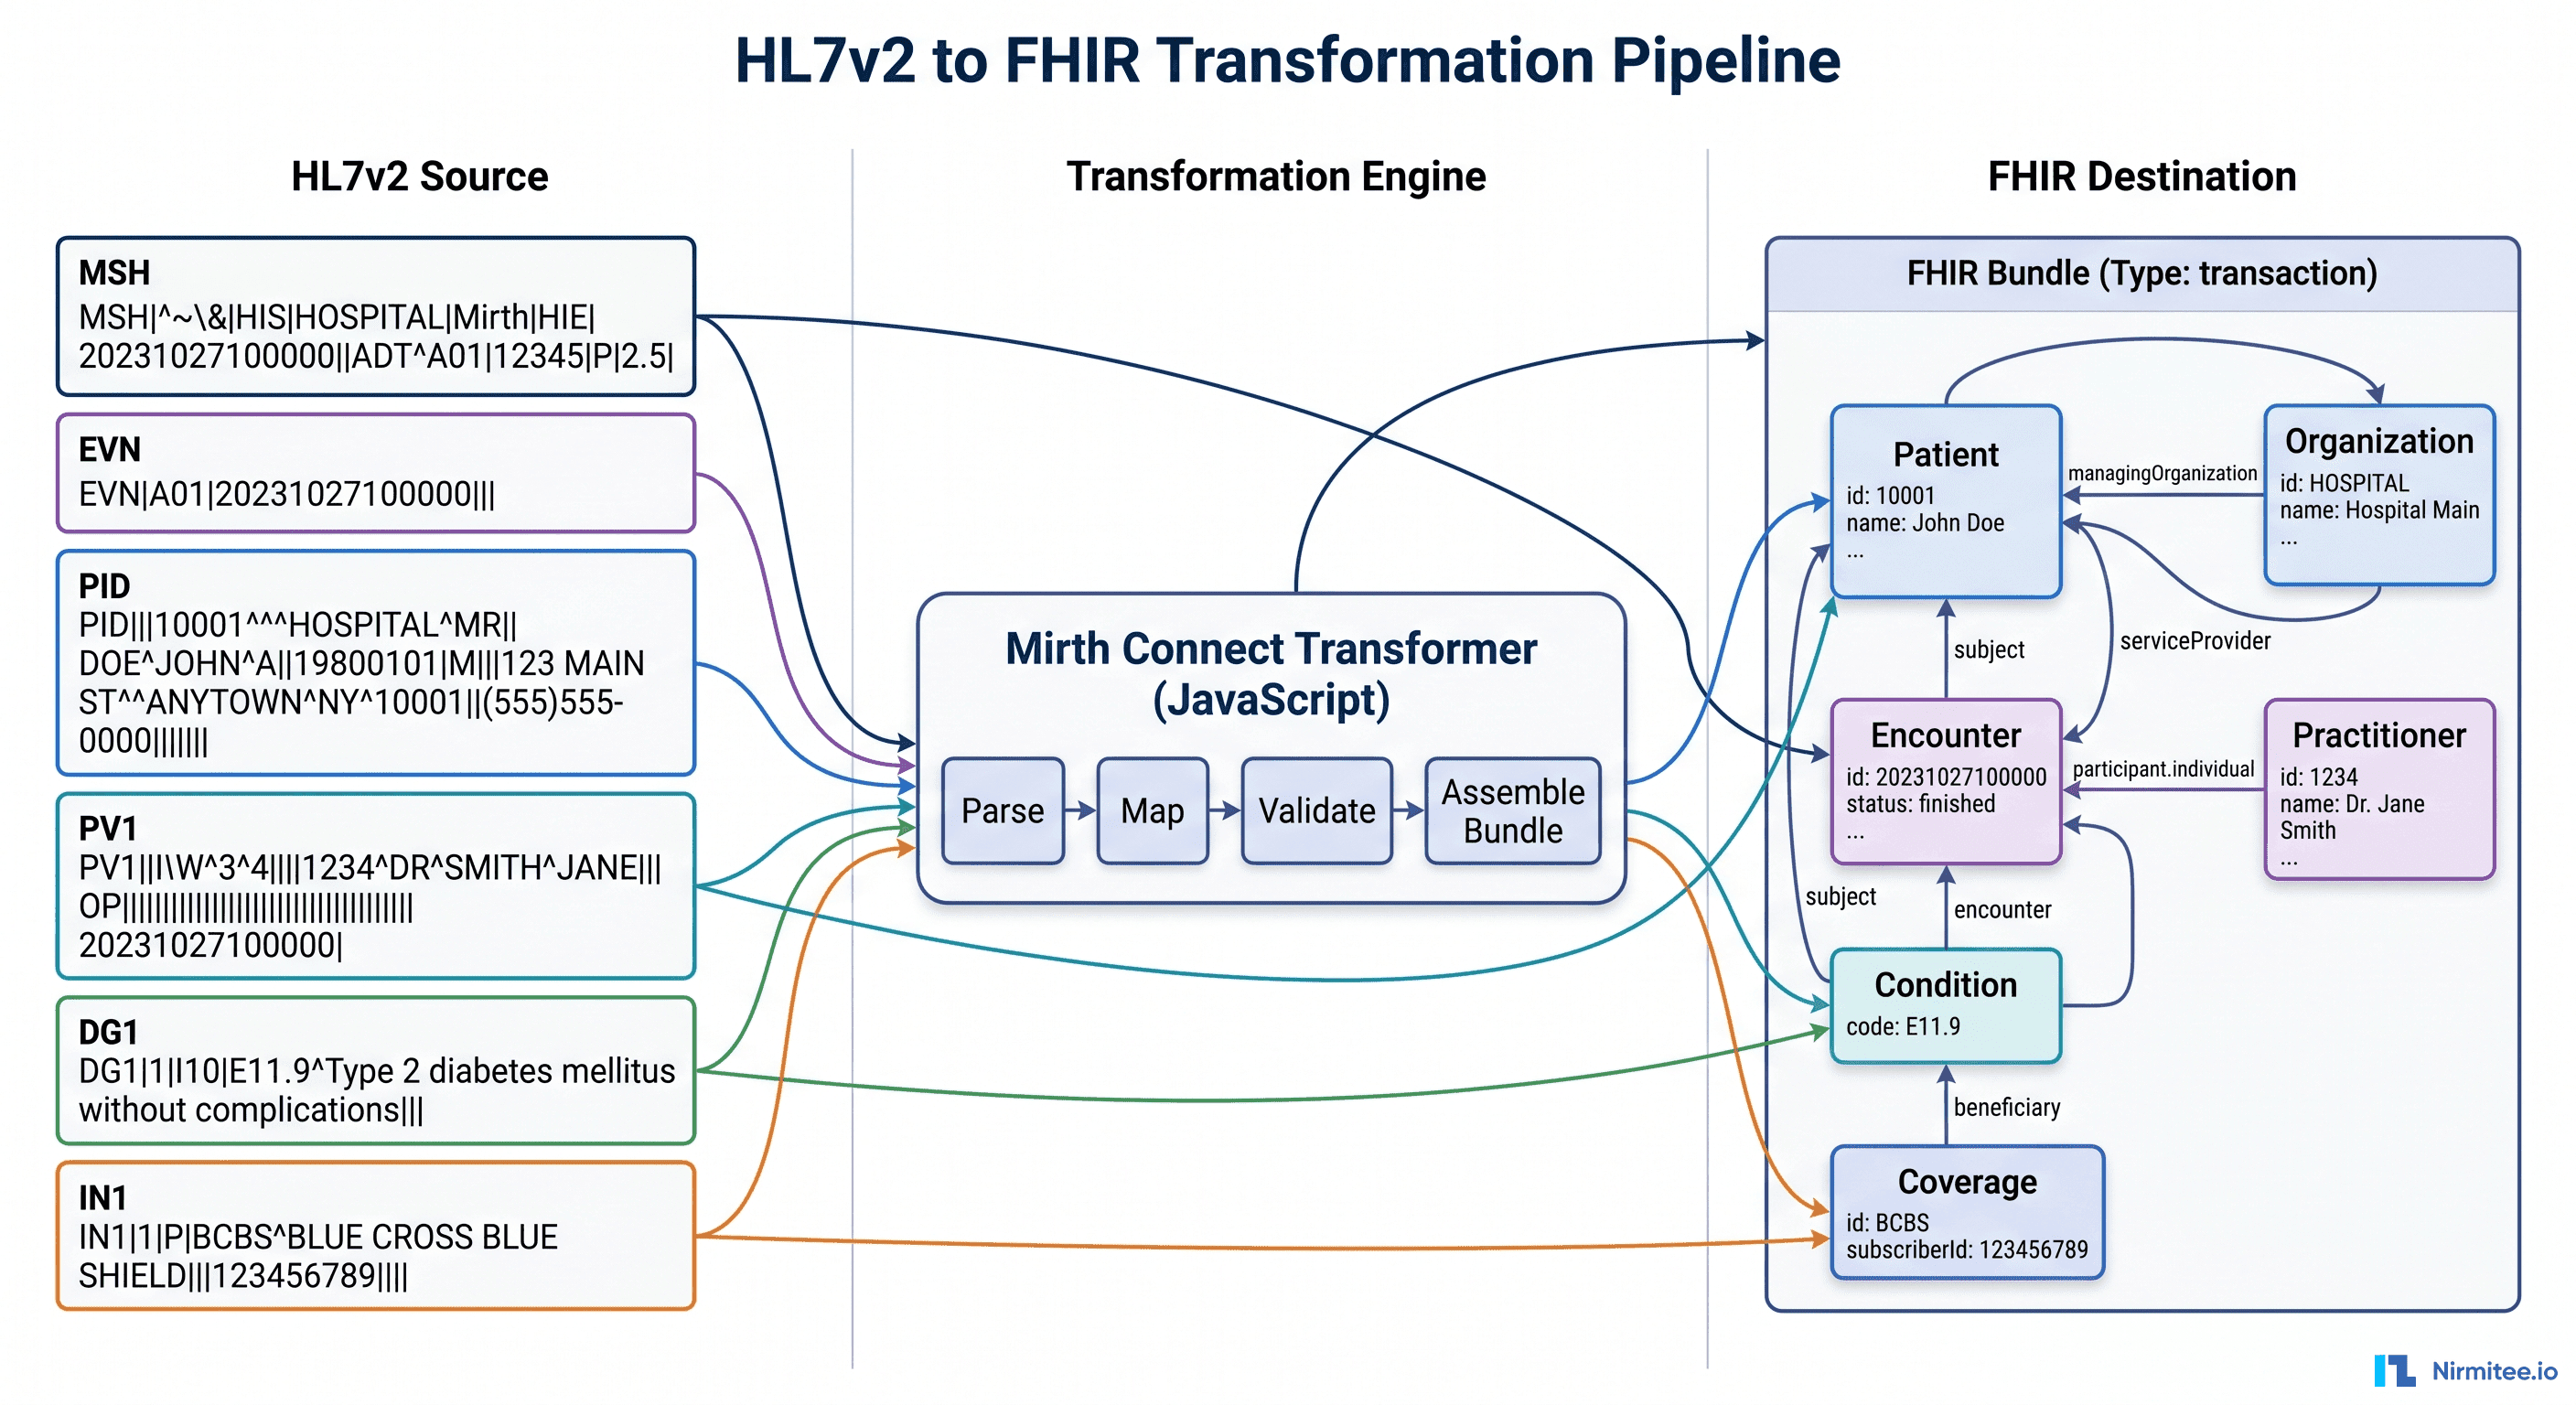
Every FHIR resource contains Reference fields that point to other resources. A Patient resource references an Organization (managing organization). An Encounter references a Patient (subject), Practitioner (participant), Location (service provider), and Condition (diagnosis). A MedicationRequest references a Patient, Encounter, Practitioner (requester), and Medication.
HL7 explicitly acknowledges this with the GraphDefinition resource, which provides "a formal computable definition of a graph of resources — that is, a coherent set of resources that form a graph by following references." The FHIR specification literally defines a graph traversal mechanism.
Yet the dominant FHIR implementations — HAPI FHIR, Google Cloud Healthcare API, AWS HealthLake, Azure Health Data Services — all store FHIR resources in either relational databases or document stores. References become foreign keys or embedded JSON pointers. The graph is implicit, not explicit.
The FHIRgraph project addresses this by defining a graph datatype structure for FHIR, enabling native graph storage and traversal. And research on RAG on FHIR with Knowledge Graphs demonstrates that FHIR data stored natively as a graph enables AI retrieval patterns that flat FHIR stores cannot support.
The practical implication: if your FHIR integration layer stores resources in PostgreSQL tables with foreign key references, you have taken a graph specification and forced it into a tabular representation. Every time you query across resource types, you are paying the JOIN tax on what should be a traversal.
Consider the difference. To answer "What medications is this patient taking, who prescribed them, for what conditions, and are there any interactions?":
Relational FHIR (5 JOINs):
SELECT m.medication_code, p.name AS prescriber, c.code AS condition_code
FROM medication_request m
JOIN patient pt ON m.subject_ref = pt.id
JOIN practitioner p ON m.requester_ref = p.id
JOIN encounter e ON m.encounter_ref = e.id
JOIN condition c ON e.diagnosis_ref = c.id
WHERE pt.id = 'patient-john-smith'
-- Still missing: drug interactions (would need another table + self-join)
Graph FHIR (single traversal):
MATCH (pt:Patient {id: 'patient-john-smith'})-[:SUBJECT_OF]->(mr:MedicationRequest)
      -[:REQUESTED_BY]->(prov:Practitioner),
      (mr)-[:ENCOUNTER]->(enc:Encounter)-[:DIAGNOSIS]->(cond:Condition),
      (mr)-[:MEDICATION]->(med:Medication)
OPTIONAL MATCH (med)-[:INTERACTS_WITH]->(other_med:Medication)
      <-[:MEDICATION]-(other_mr:MedicationRequest)<-[:SUBJECT_OF]-(pt)
RETURN med.name, prov.name, cond.code, collect(other_med.name) AS interactions
The graph query is not just faster — it answers a richer question in a single statement, including the drug interaction check that the relational query cannot express without additional tables and self-joins.
Building a Healthcare Knowledge Graph
A healthcare knowledge graph (HKG) is more than a graph database with clinical data in it. It is a structured representation of clinical knowledge that combines:
- Instance data: Actual patient records, encounters, observations (from FHIR, HL7v2, claims)
- Ontological data: Medical knowledge structures (SNOMED CT, ICD-10, RxNorm, LOINC, CPT)
- Inference rules: Clinical reasoning patterns that create new edges from existing data
Architecture: Ingest, Build, Query, Power
Layer 1 — Ingest and Normalize
Pull data from multiple sources (EHR via FHIR, claims via EDI 835/837, labs via HL7v2 ORU, pharmacy via NCPDP) and normalize to a common entity model. This is where healthcare data lake architecture provides the staging layer. Key operations:
- Entity resolution: Match "John Smith" in Epic with "J. Smith" in the claims system and "Patient P001" in the lab system. Use probabilistic matching (Fellegi-Sunter) or ML-based entity resolution
- Code normalization: Map ICD-10-CM codes to SNOMED CT concepts, NDC codes to RxNorm, local procedure codes to CPT. This creates the ontological edges
- Temporal alignment: Normalize timestamps across systems (UTC), resolve timezone ambiguities, order events into temporal sequences
Layer 2 — Build the Graph
Load normalized entities as nodes and relationships as edges into the graph database. This is where mental models for healthcare integration shift from pipeline to graph. Key design decisions:
- Node types: Define based on FHIR resource types (Patient, Practitioner, Organization, Condition, Medication, Encounter, Observation, Procedure, Claim)
- Edge types: Define based on FHIR references plus clinical relationships (treats, diagnosed_with, prescribed, referred_to, admitted_to, billed_to)
- Ontology overlay: Connect instance nodes to ontology nodes (e.g., a patient's Condition node connects to the SNOMED CT concept hierarchy: "Type 2 Diabetes" → is_a → "Diabetes mellitus" → is_a → "Endocrine disorder")
- Temporal edges: Add time-stamped edges for event sequences (encounter_1 → followed_by → encounter_2)
Layer 3 — Query and Traverse
Expose the graph through multiple query interfaces:
- Cypher/openCypher: For application developers building clinical features
- SPARQL: For ontology-level queries against SNOMED CT, ICD-10 hierarchies
- GraphQL: For frontend applications needing flexible, nested data retrieval
- Graph algorithms API: For analytics (PageRank, community detection, centrality measures, pathfinding)
Layer 4 — Power Applications
The knowledge graph powers downstream applications that would be impossible or prohibitively expensive with relational data:
- Clinical decision support (real-time graph traversal for drug interaction alerts, care gap identification)
- Population health analytics (community detection for cohort identification, risk stratification)
- Fraud detection (network analysis, anomaly detection on claims graphs)
- AI/ML with Graph RAG (graph-enhanced retrieval for LLMs, GNN-based predictions)
Real Use Cases
Care Coordination: Finding the Full Picture
A patient shows up at your ER. They have been seen by seven providers across three facilities in the last year. In a pipeline architecture, the ER physician queries the HIE (Health Information Exchange), gets back a list of CCD documents, and manually pieces together the clinical picture from PDF-like documents.
In a graph architecture, a single traversal returns the complete care network:
MATCH path = (p:Patient {id: $patientId})-[*1..3]-(connected)
WHERE connected:Provider OR connected:Facility OR connected:Condition
      OR connected:Medication
RETURN path
This returns not just the entities, but the topology — which providers know each other, which facilities share specialists, which conditions are managed by which providers, and which medications were prescribed in which context. The ER physician sees a connected care map, not a stack of documents.
Drug Interaction Detection: Beyond Pairwise Lookup
A 2024 scoping review in Clinical Therapeutics found that knowledge graphs in pharmacovigilance identified adverse drug reaction signals that traditional methods missed, particularly for multi-drug interaction chains and rare adverse events.
The graph approach to drug interaction detection:
- Build a drug knowledge graph from RxNorm, DrugBank, and FDA adverse event reports
- Model drugs, enzymes (CYP450 family), metabolic pathways, protein targets, and adverse effects as nodes
- For each patient, traverse from their medication nodes through shared pathways to identify interaction chains
- Use GNN-based link prediction to identify probable but unreported interactions based on molecular similarity
A GNN model published in MDPI Engineering Proceedings demonstrated that graph neural networks on drug molecular graphs achieved superior DDI prediction compared to traditional feature-based approaches, particularly for detecting novel drug pairings not present in existing interaction databases.
Fraud Detection: Network Analysis at Scale
Healthcare fraud detection is perhaps the most mature graph analytics use case in the industry. The pattern is clear: fraudulent behavior creates structural anomalies in billing networks that are invisible to row-level analysis but obvious in graph topology.
Research from AAAI demonstrated graph analysis techniques for detecting fraud, waste, and abuse in healthcare data by identifying suspicious individuals, unusual relationships between individuals, anomalous changes over time, and unusual network structures.
A heterogeneous information network approach published in BMC Medical Informatics used hierarchical attention mechanisms on healthcare billing graphs to detect fraud patterns that escaped traditional rule-based systems — specifically identifying coordinated billing schemes where multiple providers and patients create a dense subgraph of claims.
Population Health: Community Detection at Scale
Population health management requires identifying patient cohorts — groups of patients with similar characteristics, conditions, risk profiles, and care needs. Traditional approaches use SQL GROUP BY on demographics and condition codes. Graph-based community detection finds natural clusters based on the full topology of patient relationships.
Graph-based population health segmentation:
- Build a patient similarity graph where edges represent shared conditions, providers, medications, demographics, and social determinants
- Apply community detection algorithms (Louvain, Leiden) to identify natural patient clusters
- Characterize each cluster by its most central nodes and most common edge types
- Use cluster membership for risk stratification, intervention targeting, and resource allocation
The Frimley Integrated Care System in the UK demonstrated that graph-based population health analytics, deployed through Graphnet's platform, enabled proactive remote monitoring for 4,000 complex-need patients and 800 care home residents, achieving a 40% reduction in hospital admissions for high-need patients and a 31% reduction in A&E attendance.
Graph-Powered Healthcare AI
The convergence of graph databases and AI is producing a new category of healthcare intelligence systems. Three patterns are emerging as dominant:
Graph Neural Networks (GNNs) for Clinical Prediction
GNNs operate directly on graph-structured data, learning representations that capture both node features and structural context. In healthcare, GNNs are being applied to:
- Readmission prediction: Patient graphs that include encounter history, comorbidities, and social determinants outperform tabular models by 15-23% AUC because they capture the relationship context that determines readmission risk
- Disease progression prediction: Temporal graph networks predict disease state transitions by learning from the full graph of clinical events, not just the most recent observation
- Drug repurposing: GNNs trained on drug-disease-gene knowledge graphs identify new therapeutic uses for existing drugs by finding structural similarities in molecular graphs
A comprehensive review in Nature Medicine (Graph AI in Medicine) documents over 200 applications of graph AI in clinical settings, concluding that graph-based approaches consistently outperform non-graph alternatives for tasks where relational context matters — which is most clinical tasks.
Graph RAG: Grounding LLMs in Clinical Knowledge
Retrieval-Augmented Generation (RAG) has become the standard approach for grounding LLMs in domain-specific knowledge. But standard RAG — chunk text, embed chunks, retrieve nearest chunks — loses the relational structure of medical knowledge. Graph RAG addresses this by retrieving subgraphs instead of text chunks.
Research published in Frontiers in Digital Health (2026) describes a hybrid Graph RAG approach for clinical AI that combines:
- Structured graph retrieval: Given a clinical question, identify relevant entities in the knowledge graph, retrieve their local neighborhoods (1-3 hop subgraphs), and provide the subgraph as context
- Unstructured text retrieval: Standard RAG on clinical notes, guidelines, and literature
- Graph-grounded reasoning: The LLM receives both the knowledge graph subgraph and the text chunks, enabling it to reason over structured relationships and unstructured narratives simultaneously
The MedRAG system presented at ACM Web Conference 2025 demonstrated that knowledge graph-elicited reasoning improved healthcare copilot accuracy by grounding LLM responses in verified clinical relationships rather than pattern-matched text. A self-correcting agentic Graph RAG system for clinical decision support in hepatology further showed that agent-driven graph queries with self-correction loops reduced hallucination rates compared to standard RAG.
Knowledge-Grounded Clinical LLMs
The most advanced pattern combines all three: a clinical LLM backed by a healthcare knowledge graph, with GNN-powered inference and Graph RAG retrieval. This architecture:
- Ingests FHIR data into a knowledge graph (patient instance data + medical ontologies)
- Trains GNNs on the graph for specific predictive tasks (risk scoring, interaction detection)
- Retrieves relevant subgraphs via Graph RAG when the LLM needs context
- Generates clinically grounded responses that can cite the specific graph paths that support their reasoning
This is the architecture that will define the next generation of clinical AI — not LLMs trained on medical textbooks, but LLMs connected to live patient knowledge graphs that update in real time as new clinical data arrives.
Migration Path: From Pipeline to Graph
Ripping out your existing data warehouse and replacing it with Neo4j is not the answer. The migration from pipeline to graph thinking is incremental, and the two architectures can coexist productively. Here is a practical five-phase migration path:
Phase 1: Graph Overlay (Weeks 1-4)
Keep your existing data warehouse. Add a graph database alongside it. Build a synchronization layer that mirrors key entities and relationships from the warehouse into the graph. Start with a single use case — care coordination is typically the best first candidate because it has the most obvious graph structure and the highest clinical impact.
Deliverable: A Neo4j instance with Patient, Provider, Facility, and Encounter nodes synchronized from your warehouse, queryable via Cypher. One dashboard or API endpoint powered by graph queries.
Phase 2: FHIR-Native Graph Ingestion (Weeks 5-12)
Instead of FHIR → relational → graph (double transformation), build a direct FHIR → graph pipeline. As domain-driven design in healthcare teaches, model your bounded contexts around the natural graph structure of clinical data rather than forcing them into relational schemas.
Map FHIR resources directly to graph nodes and FHIR references directly to graph edges. Use FHIR Subscriptions to get real-time updates. This eliminates the relational middle layer for new data while preserving the existing warehouse for historical queries.
Deliverable: Real-time FHIR-to-graph pipeline. New data enters the graph directly. Historical data still in warehouse.
Phase 3: Ontology Integration (Weeks 13-20)
Load medical ontologies (SNOMED CT, ICD-10, RxNorm, LOINC) into the graph as the knowledge layer. Connect instance data nodes to ontology concept nodes. This is where the graph becomes a knowledge graph — not just data, but data with semantic meaning.
Deliverable: Clinical knowledge graph with ontology-enriched data. Queries can now traverse from patient data through medical concept hierarchies.
Phase 4: Graph Analytics and AI (Weeks 21-30)
Deploy graph algorithms for production use cases: community detection for population health, centrality for care team analysis, pathfinding for care pathway optimization. Introduce GNN models for prediction tasks. Implement Graph RAG for clinical AI applications.
Deliverable: Production graph analytics powering at least three clinical or operational use cases. AI models using graph context.
Phase 5: Graph-First Architecture (Weeks 31+)
Shift the architectural center of gravity from the relational warehouse to the knowledge graph. New integrations go graph-first. The warehouse becomes a materialized view for reporting and compliance queries that genuinely benefit from tabular representation. The graph becomes the primary source of truth for clinical applications.
Deliverable: Graph-first integration architecture. Warehouse preserved for tabular analytics. All clinical applications powered by graph queries.
The Paradigm Shift
Healthcare integration has spent three decades treating clinical data as if it were transactional data — extracting it, transforming it, loading it, and wondering why the resulting analytics miss the connections that clinicians see intuitively.
The problem was never the tools. The problem was the mental model. Pipelines assume data flows. Graphs assume data connects. Healthcare data connects.
The organizations that will lead healthcare AI, care coordination, population health, and fraud detection in the coming decade will be the ones that stop asking "how do we move this data?" and start asking "how is this data connected?"
The graph is not an alternative to the pipeline. It is the recognition that healthcare data was always a graph — we just kept forcing it into rows.
Frequently Asked Questions
Do I need to replace my entire data warehouse with a graph database?
No. The most effective approach is a graph overlay — running a graph database alongside your existing warehouse. Start by synchronizing key entities (patients, providers, encounters, conditions) into the graph for specific use cases like care coordination or drug interaction detection. Your warehouse continues serving tabular analytics and compliance reporting. Over time, shift new integrations to graph-first while preserving the warehouse for workloads that genuinely benefit from relational storage.
How does a graph database handle HIPAA compliance and PHI protection?
All three major graph databases support HIPAA-eligible deployments. Neo4j Aura offers HIPAA BAA agreements with encryption at rest and in transit. Amazon Neptune provides VPC isolation, KMS encryption, and AWS GovCloud deployment for the most stringent requirements. TigerGraph Cloud supports HIPAA-compliant configurations with role-based access control. The graph structure does not inherently create additional HIPAA risk — the same encryption, access control, and audit logging apply as with any database containing PHI.
Is FHIR enough for graph-based healthcare integration, or do I need additional data sources?
FHIR provides an excellent foundation because its resource references naturally form a graph. However, a complete healthcare knowledge graph should also incorporate medical ontologies (SNOMED CT, ICD-10, RxNorm) as the knowledge layer, claims/billing data for financial graph analysis, social determinants of health data for population health, and device/wearable data for RPM use cases. FHIR gives you the clinical instance graph; ontologies give you the semantic knowledge layer; claims give you the financial graph. Together, they create a comprehensive healthcare knowledge graph.
What is the performance difference between graph and relational queries for clinical data?
For simple lookups (single patient record), performance is comparable. The gap widens dramatically with relationship depth. A 2025 study on MIMIC-IV clinical data showed Neo4j outperforming PostgreSQL by 5.4x to 48.4x across five clinical query types. For multi-hop queries common in care coordination (3+ relationship traversals), graph databases can be 300-3,200x faster because they use index-free adjacency rather than computed JOINs. The general rule: if your query involves more than two JOINs on clinical relationships, a graph database will likely be faster and the query will be simpler to write.
How do Graph Neural Networks improve clinical AI compared to traditional machine learning?
Traditional ML models treat each patient record as an independent row of features, ignoring the relationships between patients, providers, conditions, and medications. GNNs learn from the graph structure itself — incorporating not just a patient's features but the features of their connected providers, the topology of their care team, the relationships between their conditions and medications, and patterns in their broader clinical network. This structural awareness improves predictions for tasks where context matters: readmission prediction (15-23% AUC improvement), drug interaction detection (novel multi-hop interactions), and fraud detection (network pattern recognition that table-based models cannot capture).