At 3:47 AM on a Tuesday in late February, an on-call engineer at a 600-bed regional hospital received an alert that every ADT message from the EHR was timing out. The integration engine had not crashed. The Java process was running.
The channels were green. But somewhere underneath, the PostgreSQL database had quietly grown from a manageable 40 GB to 850 GB over eighteen months, and a routine autovacuum had finally triggered a table-level lock that brought message processing to a halt.
By the time the team finished a manual VACUUM FULL, twelve hours of patient registrations had been queued in upstream systems. This is not a rare incident. It is the single most common failure mode we see in production Mirth Connect deployments, and it is almost always preventable.
d_mm_xxx tables indefinitely. Fix: configure per-channel pruning in Mirth Administrator (Properties → Message Storage). For HIPAA compliance, retain 7 years and archive to S3 rather than delete. Run SELECT table_name, pg_size_pretty(pg_total_relation_size(table_name::text)) FROM information_schema.tables WHERE table_schema='public' ORDER BY 2 DESC LIMIT 20 to find the biggest tables first.The Mirth Connect database is designed to grow. Every message that passes through a channel writes rows to multiple tables, every attachment lands in its own storage table, every custom metadata field adds an index, and every retry doubles the footprint. Out of the box, Mirth ships with defaults optimized for development and demos, not for production at scale.
The result is a slow, invisible accretion of data that eventually crosses a threshold where queries slow down, autovacuum thrashes, disks fill, and the integration engine becomes the bottleneck in the very pipeline it was meant to accelerate.
This guide is the field manual we use when called in to rescue Mirth deployments that have grown out of control. It covers the tables that bloat, the diagnostic queries that reveal where the data is hiding, the per-channel pruning configuration that stops the growth, and the three-tier storage architecture that lets you meet seven-year HIPAA retention requirements without keeping every byte in your primary PostgreSQL instance.
Why the Mirth Connect Database Grows Uncontrolled
The Mirth Connect database grows because message content is stored in per-channel d_mm_xxx tables indefinitely by default. Every message processed — including raw HL7 content, FHIR JSON, and Base64-encoded attachments — accumulates without limit. A channel processing 10,000 messages per day at 5KB average message size adds 50MB per day to the database, or 18GB per year, from that one channel alone. Multiply across all channels and the growth compounds fast.
The root cause of Mirth database bloat is seldom the volume of HL7 traffic. It is the combination of four configuration defaults that, individually, feel reasonable but together create an unsustainable growth curve.
1. Development storage mode is the default. When you install Mirth Connect for the first time, every new channel is created with storage settings tuned for debugging. Raw messages, transformed messages, encoded messages, channel maps, response maps, and source maps are all persisted in full.
For a single ADT^A04 message of 4 KB, this can translate to 35-50 KB of database rows once you account for the inbound payload, the transformed FHIR bundle, the response from the destination, and the metadata trail. Multiply by 80,000 messages per day, and you are writing roughly 3 GB per day to the database before you have processed a single attachment.
2. The data pruner is off by default. Mirth ships with a data pruner component, but on a fresh install, it is either disabled or configured to run only when explicitly invoked. Most teams discover this control panel for the first time during an incident, which is the worst possible moment to start tuning retention windows. Until pruning is configured at the channel level, every message ever processed by Mirth lives in the database forever.
3. Attachments are kept in line. Mirth's d_mca table stores attachments as bytea columns. If your integration handles CDA documents, lab PDF reports, DICOM thumbnails, or claim attachments, every one of those documents sits inside PostgreSQL alongside the operational message stream.
We have seen a single d_mca table grow to 600 GB on a 12-month-old integration that processed an average of 1,800 lab PDFs per day. The database was 92% attachment data and 8% actual messages.
4. History is kept indefinitely. The channel statistics, error logs, and message search indexes accumulate row by row, day after day, with no built-in time-to-live. After two years of operation, the message_search table alone on a moderately busy channel can hold tens of millions of rows.
Queries that used to return in 30 milliseconds now take 8 seconds, and the administrator dashboard starts loading slowly enough that operations teams stop trusting it.
The Mirth Tables That Bloat: A Field Guide
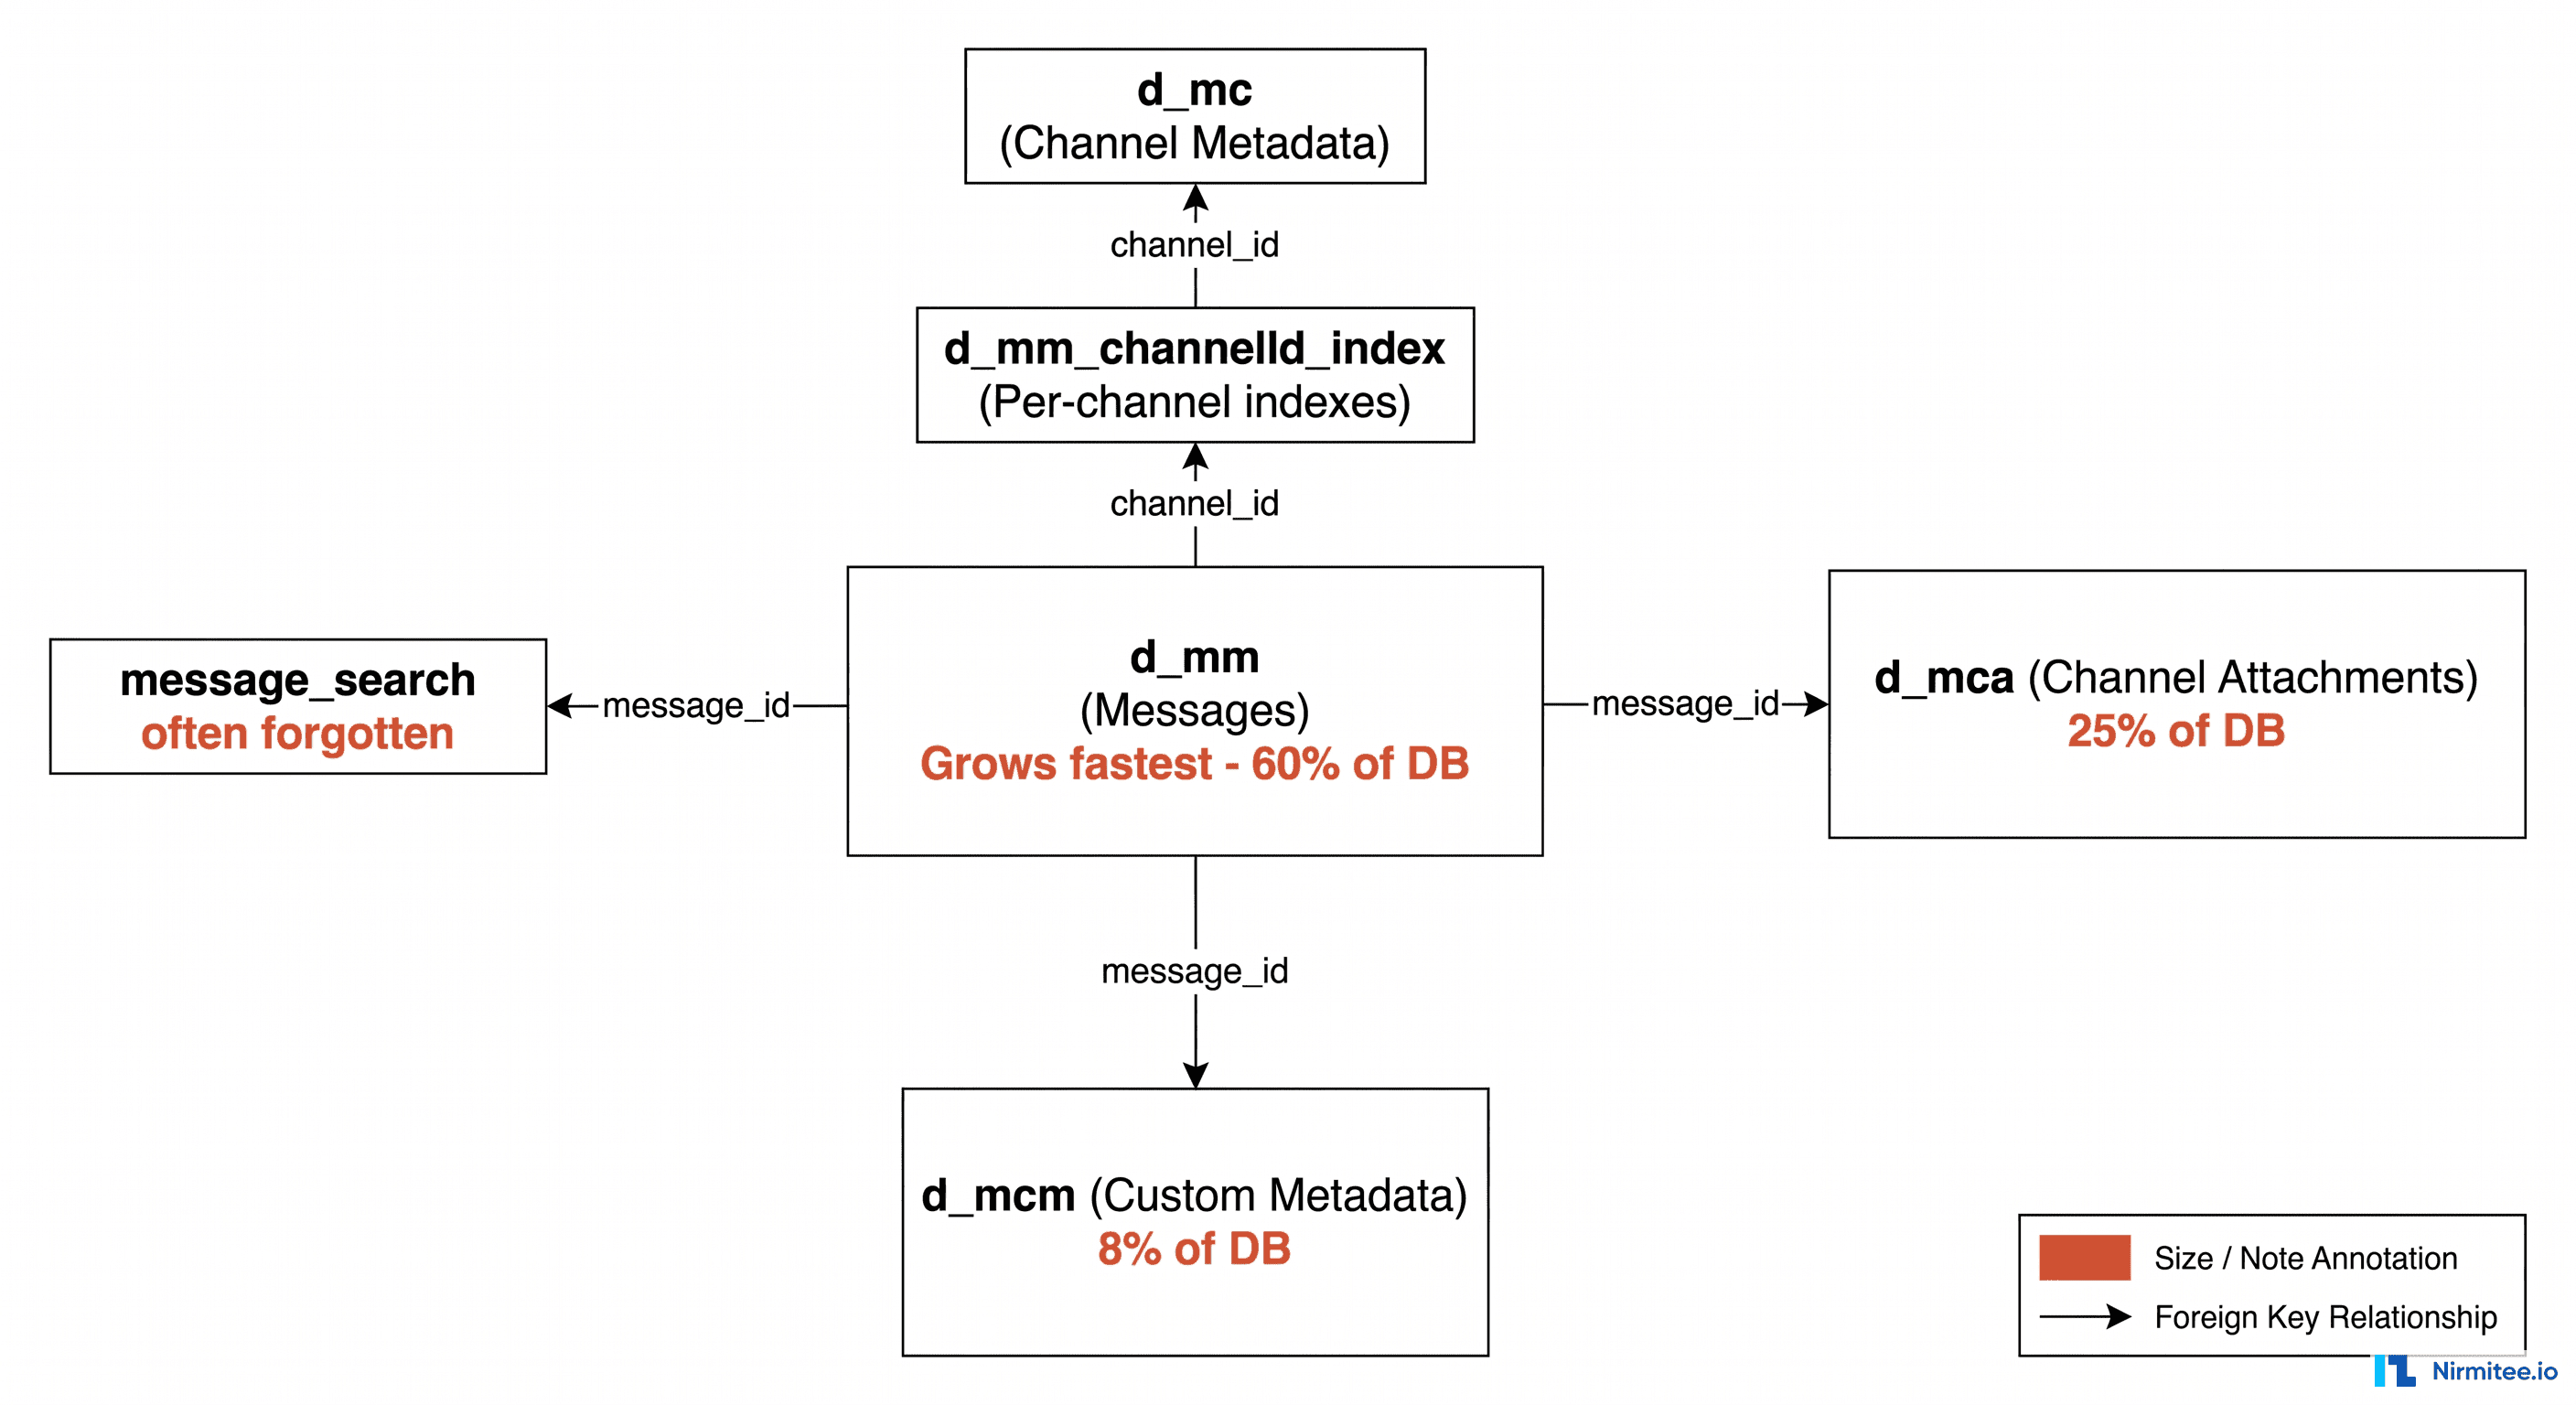
The five Mirth tables that drive database bloat: d_mm (one row per message — metadata, status, timestamps, retry counts), d_mm_xxx (per-channel content tables — raw message bodies, the biggest storage consumer), d_ma (message attachments — PDFs, DICOM, Base64 payloads — often the single largest table), d_mca (connector state — usually small but can grow if connectors are never pruned), d_ms (message statistics). Pruning targets d_mm and d_mm_xxx first, then d_ma.
Before you can fix the problem, you need to know which tables are eating your disk. The Mirth schema uses a mix of shared tables (one row per message across all channels) and per-channel tables (created dynamically for each deployed channel). The shared tables are the most important to understand, because they are the ones that grow proportionally to total throughput across your entire integration estate.
d_mm — The Messages Table
The d_mm table is the heart of the Mirth database. Every inbound message creates at least one row here, with columns for the channel ID, server ID, received date, processed date, response date, and a handful of status flags. On its own, a single row in d_mm is small (roughly 200 bytes), but it is the anchor for every other piece of data associated with that message. The d_mm table typically represents 40-60% of the database in a deployment with moderate attachment volume.
d_mca — The Channel Attachments Table
Every attachment processed by a channel lands in d_mca as a bytea row. For text-heavy integrations like X12 837 claims, this table grows quickly. For document-heavy integrations like MDM document distribution or CDA exchange, it explodes. Compressing attachments inside d_mca helps with the disk footprint but does nothing to fix the query performance problem, because PostgreSQL still has to scan or seek across a massive table on every administrator query that touches attachments.
d_mcm — The Custom Metadata Table
If you have configured custom metadata columns on any channel (patient MRN, encounter ID, sender facility code, etc.), every message writes a row to d_mcm with one row per indexed field. The table is small per message, but it is the most aggressively indexed table in the Mirth schema, and indexes do not compress well. On a channel with five custom metadata fields, d_mcm and its associated indexes often account for 10-15% of the total database size.
d_mc and d_mm_<channelId>_index — Channel-Specific Tables
Each deployed channel gets its own message index table, named d_mm_<channelId>_index. These are partitioned per channel so that pruning and statistics queries can operate on a single channel without scanning the global d_mm. The catch is that every channel adds another table to the schema, and high-volume hospitals can easily have 200+ channels deployed. The cumulative cost of these per-channel tables is significant, and they need their own VACUUM and ANALYZE schedule.
message_search — The Search Acceleration Table
The message_search table powers the message browser in the Mirth Administrator. It is one of the most commonly forgotten tables when calculating bloat, partly because it is rarely visible in routine monitoring and partly because its growth is non-linear. As the table grows, the search index becomes less selective, queries get slower, and the table accumulates dead tuples faster than autovacuum can keep up.
Six SQL Queries to Diagnose Mirth Database Bloat
The six SQL queries that diagnose Mirth database bloat in under 10 minutes: (1) total database size, (2) top 20 tables by size (identifies which channel's d_mm_xxx table dominates), (3) oldest unprocessed message per channel (finds channels with stuck messages holding up pruning), (4) message count by status per channel (identifies ERROR and QUEUED backlogs), (5) attachment table size breakdown, (6) estimated daily growth rate from the past 7 days. Run these before configuring pruning to baseline what you are working with.
When we walk into a new Mirth environment to diagnose growth problems, we run a standard battery of diagnostic SQL queries before changing a single setting. The goal is to understand where the data is, how old it is, and which channels are responsible. These queries are PostgreSQL-specific (Mirth supports MySQL, MSSQL, Oracle, and PostgreSQL — the queries translate easily, but the system catalog names differ).
1. Top 10 Channels by Message Count
SELECT channel_id,
       count(*) AS message_count,
       pg_size_pretty(pg_total_relation_size('d_mm_' || channel_id || '_index')) AS index_size
FROM d_mm
GROUP BY channel_id
ORDER BY message_count DESC
LIMIT 10;
This query is the single most useful starting point. In nine out of ten cases, the bloat is concentrated in two or three channels — typically a high-volume ADT feed, a lab results channel, and one runaway integration that someone forgot to configure properly. Identifying these channels first lets you prioritize where to spend tuning effort.
2. The Oldest Message in d_mm
SELECT min(received_date) AS oldest_message,
       max(received_date) AS newest_message,
       (max(received_date) - min(received_date)) AS retention_window
FROM d_mm;
If the oldest message is older than your stated retention policy, pruning has either never run successfully or is not configured aggressively enough. We routinely find Mirth instances with 4+ years of message history when the actual retention requirement is 90 days.
3. Largest Attachments by Channel
SELECT channel_id,
       count(*) AS attachment_count,
       pg_size_pretty(sum(octet_length(content))) AS total_size,
       pg_size_pretty(avg(octet_length(content))) AS avg_size
FROM d_mca
GROUP BY channel_id
ORDER BY sum(octet_length(content)) DESC
LIMIT 20;
This query exposes the channels that are storing large binary payloads. If you see a channel with average attachment size above 500 KB, that is your first candidate for externalizing attachments to S3 or an object store.
4. Index Bloat Report
SELECT relname,
       pg_size_pretty(pg_relation_size(oid)) AS table_size,
       pg_size_pretty(pg_total_relation_size(oid) - pg_relation_size(oid)) AS index_size
FROM pg_class
WHERE relname LIKE 'd_mm%'
   OR relname LIKE 'd_mca%'
ORDER BY pg_total_relation_size(oid) DESC;
If the index size is more than 60% of the table size on any Mirth table, you have index bloat. The fix is REINDEX CONCURRENTLY (PostgreSQL 12+) or a one-time pg_repack pass during a maintenance window.
5. Vacuum Candidates
SELECT relname,
       n_dead_tup,
       n_live_tup,
       round(100.0 * n_dead_tup / nullif(n_live_tup + n_dead_tup, 0), 2) AS dead_pct,
       last_autovacuum
FROM pg_stat_user_tables
WHERE schemaname = 'public'
ORDER BY n_dead_tup DESC
LIMIT 20;
Any table with dead_pct above 20% is a candidate for manual VACUUM. If last_autovacuum is more than a week old on a busy table, your autovacuum settings are too conservative for the write rate.
6. Partition Pruning Eligibility
SELECT channel_id,
       count(*) FILTER (WHERE received_date < now() - interval '90 days') AS prunable_old,
       count(*) FILTER (WHERE received_date >= now() - interval '90 days') AS recent,
       round(100.0 * count(*) FILTER (WHERE received_date < now() - interval '90 days') / count(*), 2) AS prunable_pct
FROM d_mm
GROUP BY channel_id
ORDER BY prunable_old DESC;
This is your before-and-after estimate. The prunable_pct column tells you exactly how much of each channel's data is older than 90 days and would be removed if you set a 90-day retention policy today. On most untuned deployments, this number is between 75% and 92%.
Configuring the Mirth Data Pruner the Right Way
Mirth's built-in data pruner runs on a configurable schedule (default: every hour) and removes messages older than the per-channel retention setting. Configure per-channel in Mirth Administrator: Properties → Message Storage → set "Remove message content after" to your retention period (24 hours for non-clinical routing channels, 7 years for clinical data channels per HIPAA). Set "Remove messages after" for complete message removal. Enable "Archive messages" if you want content moved to S3 before deletion rather than hard-deleted.
The Mirth data pruner is configured in two places: the global pruner settings (Administrator → Settings → Data Pruner) and per-channel storage settings on each channel's Summary tab. Most teams set the global schedule and forget the per-channel settings, which is the single biggest source of pruning that "isn't working."
Global Data Pruner Settings
The global settings control when the pruner runs, how long it can run, and whether it should archive messages before deleting them. Our recommended defaults for production:
- Block size: 1,000 messages per batch. Smaller blocks reduce lock contention but slow throughput. Larger blocks accelerate pruning but can interfere with live message processing.
- Schedule: Daily at 2:00 AM local time, with a hard stop at 5:00 AM. This window is typically the lowest-traffic period for hospital systems.
- Archive enabled: Yes, if your retention policy requires it. Mirth's archiver writes messages to disk as XML or JSON before pruning. We typically pipe this output to a script that uploads to S3 within the same maintenance window.
- Prune events: Set to 30 days. The events table fills up quickly with audit entries and is rarely needed for operational queries beyond a few weeks.
Per-Channel Storage Settings
This is where most teams get tripped up. Even with the global pruner running, no data will be removed from a channel unless that channel has explicit retention values set. Each channel has independent settings for:
- Prune metadata older than X days: Controls the d_mcm and per-channel index tables.
- Prune content older than X days: Controls d_mm message content storage. Must be less than or equal to the metadata retention value.
- Archive enabled per channel: Channel-level toggle that respects the global archive setting.
Recommended Retention by Channel Type
Different channel types have different operational and compliance needs. A high-volume ADT feed serves real-time bed-management queries and rarely needs more than a week of full content; a claims channel serving X12 837 transactions has a regulatory retention requirement that can extend to seven years. The right approach is to assign retention values per channel type, not globally.
The table above shows our default starting point for retention values on the most common HL7 v2 and X12 channel types. Tune from there based on your operational data access patterns and your compliance counsel's interpretation of state and federal retention rules. These values are starting points, not regulatory advice.
The Three-Tier Storage Architecture
The three-tier Mirth storage architecture separates hot, warm, and cold data: Hot tier (Mirth database) — 24–72 hours of recent messages for operational querying, error replay, and monitoring dashboards; Warm tier (S3 Standard) — 90 days of archived messages compressed and queryable via Athena for incident investigation; Cold tier (S3 Glacier) — 7 years of compliance archive meeting HIPAA's 6-year minimum retention, accessed rarely and priced at ~$0.004/GB/month. Mirth's archive channel pattern automates the hot-to-warm move; S3 lifecycle policies automate warm-to-cold.
Aggressive pruning solves the database growth problem, but it does not solve the retention problem. HIPAA requires a minimum of six years of medical record retention. Many states extend this to ten or more years. CMS billing rules require seven years of claims data. If you simply delete everything older than 30 days, you have traded one problem for a far more expensive one: a regulatory finding during an audit.
The solution is to separate operational storage from retention storage. Your PostgreSQL primary should hold only the data you actually query day-to-day. Older messages move to cheaper tiers that are still accessible for compliance, audit, and e-discovery, but are not in the hot path for live message processing.
Hot Tier: The Last 7 Days
The hot tier is your PostgreSQL primary instance, running on NVMe SSD storage with enough memory to hold the working set in shared_buffers. This tier holds the last 7 days of message data, statistics, and search indexes. On a 60,000-message-per-day deployment, this is typically 15-30 GB total, which fits comfortably in 64-128 GB of RAM and delivers sub-50 ms queries on the administrator dashboard.
The hot tier is also where live message processing happens. Every write goes here first. Pruning is what moves data out of this tier on a daily schedule.
Warm Tier: 8 to 90 Days
The warm tier handles the messy middle: data that is too old for the hot tier but too recent to ship to archive. This is typically a PostgreSQL read replica or a partitioned set of tables on cheaper EBS gp3 storage. The warm tier is read-only — Mirth never writes here directly. Instead, a nightly ETL job moves data from the primary to the warm tier as part of the pruning cycle.
The warm tier exists because operations teams routinely need to look up messages from "last month" or "the second week of April." Forcing those queries to go to S3 and Glacier is painful enough that teams will avoid investigating issues, which is exactly the wrong outcome. The warm tier is the compromise: cheap enough to keep 60-90 days, fast enough that lookups complete in seconds.
Cold Tier: 91 Days to 7+ Years
The cold tier is S3, S3 Glacier Instant Retrieval, or S3 Glacier Deep Archive, depending on how often you actually need to access old data. Messages are written as compressed JSON or Parquet files, partitioned by channel and date. A typical lifecycle policy looks like this:
- Days 91-365: S3 Standard (instant retrieval, ~$0.023/GB/month).
- Days 366-730: S3 Glacier Instant Retrieval (~$0.004/GB/month, retrieval in milliseconds).
- Days 731-2,555 (year 7): S3 Glacier Deep Archive (~$0.00099/GB/month, retrieval in 12 hours).
- After 7 years: Lifecycle policy moves data to a compliance vault or deletes per policy.
For HIPAA retention, lock the bucket with S3 Object Lock in compliance mode. This makes the archive immutable for the retention period and satisfies the "integrity controls" requirement of the HIPAA Security Rule.
A Real Outage: When Database Bloat Killed Production
The pattern we see most often in database-bloat outages: Mirth processes normally until the PostgreSQL data volume fills the attached EBS volume (or RDS storage auto-scaling hits its limit), at which point the database goes read-only, all Mirth channels halt with ERROR: could not extend file, and messages start accumulating in the source system's retry queue. Recovery requires adding storage, clearing the oldest content tables, and restarting Mirth — typically 2–4 hours of downtime. All of this is preventable with pruning configuration and a storage growth alert set at 70% capacity.
In late 2025, a Nirmitee client running Mirth Connect 4.x for a multi-hospital health system experienced a textbook database-bloat outage. The integration estate had grown organically over four years: 280 channels, 1.2 million messages per day at peak, 14 TB of PostgreSQL data on a single primary instance. The team had never configured per-channel pruning. The global data pruner had been disabled at some point during an upgrade and never re-enabled.
The first symptom was the Administrator dashboard taking 45 seconds to load. The second was an autovacuum on d_mca, taking out a table-level lock that blocked all writes for 22 minutes. During those 22 minutes, the upstream Epic interface engine queued 18,000 ADT messages, which then flooded Mirth as soon as the lock was released. The flood triggered a memory exhaustion event in the Mirth JVM, which crashed and restarted, which queued another 12 minutes of upstream messages, which crashed Mirth again. The full incident lasted 4 hours and 16 minutes.
The remediation took three weeks:
- Week 1: Stand up a read replica, snapshot the primary, and export everything older than 90 days to S3. Total exported: 11.8 TB of compressed JSON.
- Week 2: Configure per-channel retention on all 280 channels. Enable global pruner with archive. Run pg_repack on d_mm and d_mca during nightly maintenance windows.
- Week 3: Validate that the database had shrunk from 14 TB to 320 GB. Verify that all archived messages were retrievable from S3. Document the new architecture for compliance.
Post-remediation metrics: average query time on the Administrator dashboard dropped from 8.2 seconds to 50 milliseconds. The PostgreSQL primary's disk utilization dropped from 94% to 18%. The team eliminated the on-call wake-up alerts for autovacuum lock contention. Total S3 storage cost for 11.8 TB of compressed archive: roughly $48 per month on Glacier Deep Archive. This single project saved the client an estimated $180,000 per year in avoided database scaling costs.
Operational Best Practices for Long-Term Sustainability
Five operational practices that prevent Mirth database bloat from recurring: (1) set per-channel pruning on every channel before go-live — never leave a channel at the default unlimited retention; (2) alert at 70% database storage capacity, not 90%; (3) run the six diagnostic SQL queries monthly and review growth trends; (4) use separate d_mm_xxx tablespaces or RDS storage classes for high-volume channels; (5) document the per-channel retention policy in a runbook so the policy survives staff turnover.
Pruning and tiering are not one-time projects. They are operational disciplines that need to be embedded into your Mirth deployment lifecycle. The teams that avoid recurring database-bloat incidents follow a small set of consistent practices.
Treat New Channel Deployments as Capacity Events
Every time a new channel is deployed in Mirth, the database growth profile changes. Build a checklist into your channel deployment process that requires explicit retention values, attachment storage strategy, and projected daily message volume before the channel is promoted to production. Channels deployed without these values should be rejected by your CI/CD pipeline or your change-advisory-board process.
Monitor Database Growth as a First-Class Metric
Most Mirth monitoring focuses on message throughput, error rates, and queue depths. Add database size, per-table growth rate, and dead-tuple percentage to your operational dashboard. Set alerts at the warning level (database has grown 20% in the last 30 days) and at the critical level (disk utilization above 80%). For a deeper dive on how to instrument production Mirth, see our guide on production-grade Mirth monitoring.
Test Pruning in a Pre-Production Environment
The first time you turn on aggressive pruning should not be in production. Restore a snapshot of your production database to a staging instance, configure pruning, run it for a full cycle, and validate that nothing breaks: dashboard queries return reasonable results, message reprocessing still works for channels you might need to replay, and the archive output is restorable end-to-end.
Run pg_repack on a Schedule
Even with aggressive pruning, indexes and tables accumulate dead tuples that VACUUM cannot fully reclaim without acquiring a heavy lock. pg_repack lets you reclaim space online without blocking writes. Schedule it monthly on d_mm, d_mca, and the largest per-channel index tables.
Document Your Retention Policy in One Place
Compliance auditors will ask, sometimes years later, why a particular message was retained for a particular duration. Maintain a single document that maps each channel to its retention values, its archive destination, and the business or regulatory rationale for those choices. When the question comes up, the answer should take two minutes, not two days.
Free Database Sizing Assessment + Pruning Configuration Template
If your Mirth Connect database has grown beyond what feels manageable, or if you are planning a deployment and want to get the storage architecture right from day one, we offer a free 60-minute database sizing assessment. We will walk through your current schema, run a subset of the diagnostic queries above against a snapshot, and produce a concrete remediation plan with projected database size reductions, archive cost estimates, and a per-channel pruning configuration template tailored to your channel mix.
The assessment includes a downloadable pruning configuration template (XML files importable directly into Mirth Administrator) covering the eight most common channel types with our recommended starting retention values. Most engagements identify between 60% and 90% reduction in primary database size within the first 30 days. Schedule your free assessment to get started.
For teams running Mirth at high message volumes, see our companion guide on performance tuning Mirth Connect at 10,000+ messages per hour. For multi-tier deployments, our high-availability setup guide covers the read-replica patterns referenced in this article.
Where Nirmitee Comes In
Database sustainability is one of the most under-invested areas in healthcare interoperability. Most teams build channels first and worry about storage later, and "later" usually means "during the outage." We work with health systems, digital health vendors, and integration teams to design Mirth deployments that scale cleanly — from channel architecture and pruning configuration through monitoring, archiving, and HIPAA-grade retention.


