Every hospital CIO knows the feeling. The quarterly board meeting is approaching, and the IT budget request looks almost identical to last year's — except the number is higher. Not because new capabilities were added, but because the cost of keeping the lights on went up again. Another legacy vendor raised maintenance fees. Another developer who understood the custom HL7v2 interfaces left for a tech company. Another compliance audit found PHI in plain text inside an integration channel nobody knew existed.
This is the hidden tax of technical debt in healthcare, and it is compounding faster than most organizations realize.
According to Gartner, organizations spend up to 40% of their IT budgets maintaining technical debt by 2025. In healthcare, that number is far worse — industry analyses suggest hospitals spend 60-80% of IT budgets on legacy system maintenance, leaving single-digit percentages for innovation. Over a 10-year period, this compounding cost can drain tens of millions of dollars from a mid-sized hospital network — money that could have funded new patient care technologies, improved clinician workflows, or strengthened security posture.
This article provides the first comprehensive framework for quantifying that cost. If you are a hospital CIO making a modernization decision, a CMIO building a case for the board, or a CTO evaluating integration platform options, this analysis will give you the numbers, the frameworks, and the business case template you need.
The Hidden Tax: How Technical Debt Silently Drains Hospital IT Budgets
Technical debt in healthcare is not a metaphor. It is a measurable financial liability that grows every year it is not addressed. Unlike financial debt, which appears on balance sheets and has explicit interest rates, technical debt hides inside operating budgets, disguised as "maintenance costs," "support contracts," and "staff time."
The mechanics are straightforward. When a healthcare organization builds or buys a system and then fails to invest in its ongoing modernization — updating dependencies, refactoring architecture, migrating to current standards — the system becomes progressively more expensive to operate. The original developers leave. Vendor support contracts escalate. Regulatory requirements change but the system cannot adapt. Integration with newer systems requires increasingly elaborate workarounds.
A McKinsey analysis found that CIOs report 10-20% of technology budgets earmarked for new products get diverted to resolving technical debt issues. But that is the visible portion. The invisible portion — the opportunity cost of projects never started, the compliance risk of systems never updated, the recruitment cost of developers who refuse to work on legacy stacks — is often 3-5x larger.
For a hospital network spending $30 million annually on IT, this means:
- $18-24 million goes to maintaining what already exists
- $3-6 million goes to regulatory compliance on legacy systems
- $1-3 million is available for actual innovation
- $0 is allocated for paying down technical debt itself
The compounding effect is the critical insight most budgets miss. Year-over-year, maintenance costs do not stay flat — they increase 8-15% annually as systems age, vendor contracts escalate, and qualified staff become scarcer. Meanwhile, the opportunity cost accelerates as competitors who modernized early gain compounding advantages in efficiency, patient experience, and clinician satisfaction.
What Technical Debt Looks Like in Healthcare: Six Patterns Every CIO Recognizes
Technical debt in healthcare is not abstract. It has specific, recognizable forms that appear in virtually every hospital IT environment. Understanding these patterns is the first step toward quantifying their cost.
1. Twenty-Year-Old HL7v2 Interfaces
The most pervasive form of technical debt in hospital IT is the HL7 v2.x interface. First standardized in 1988, HL7v2 remains the backbone of clinical data exchange in over 95% of US hospitals. The standard itself is not the problem — its flexibility is. HL7v2 allows so much customization that virtually every implementation is unique.
The typical 300-bed hospital operates 150-400 HL7v2 interfaces. Many were built 10-20 years ago by consultants or staff who have long since left. The interfaces use proprietary Z-segments, custom field mappings, and organization-specific data transformations that are documented nowhere. HL7 integration costs are notoriously expensive, with each custom interface costing $5,000-$50,000 to build and $2,000-$10,000 per year to maintain.
Annual cost for a mid-sized hospital: $300,000-$800,000 in direct interface maintenance, plus $150,000-$400,000 in staff time troubleshooting interface failures.
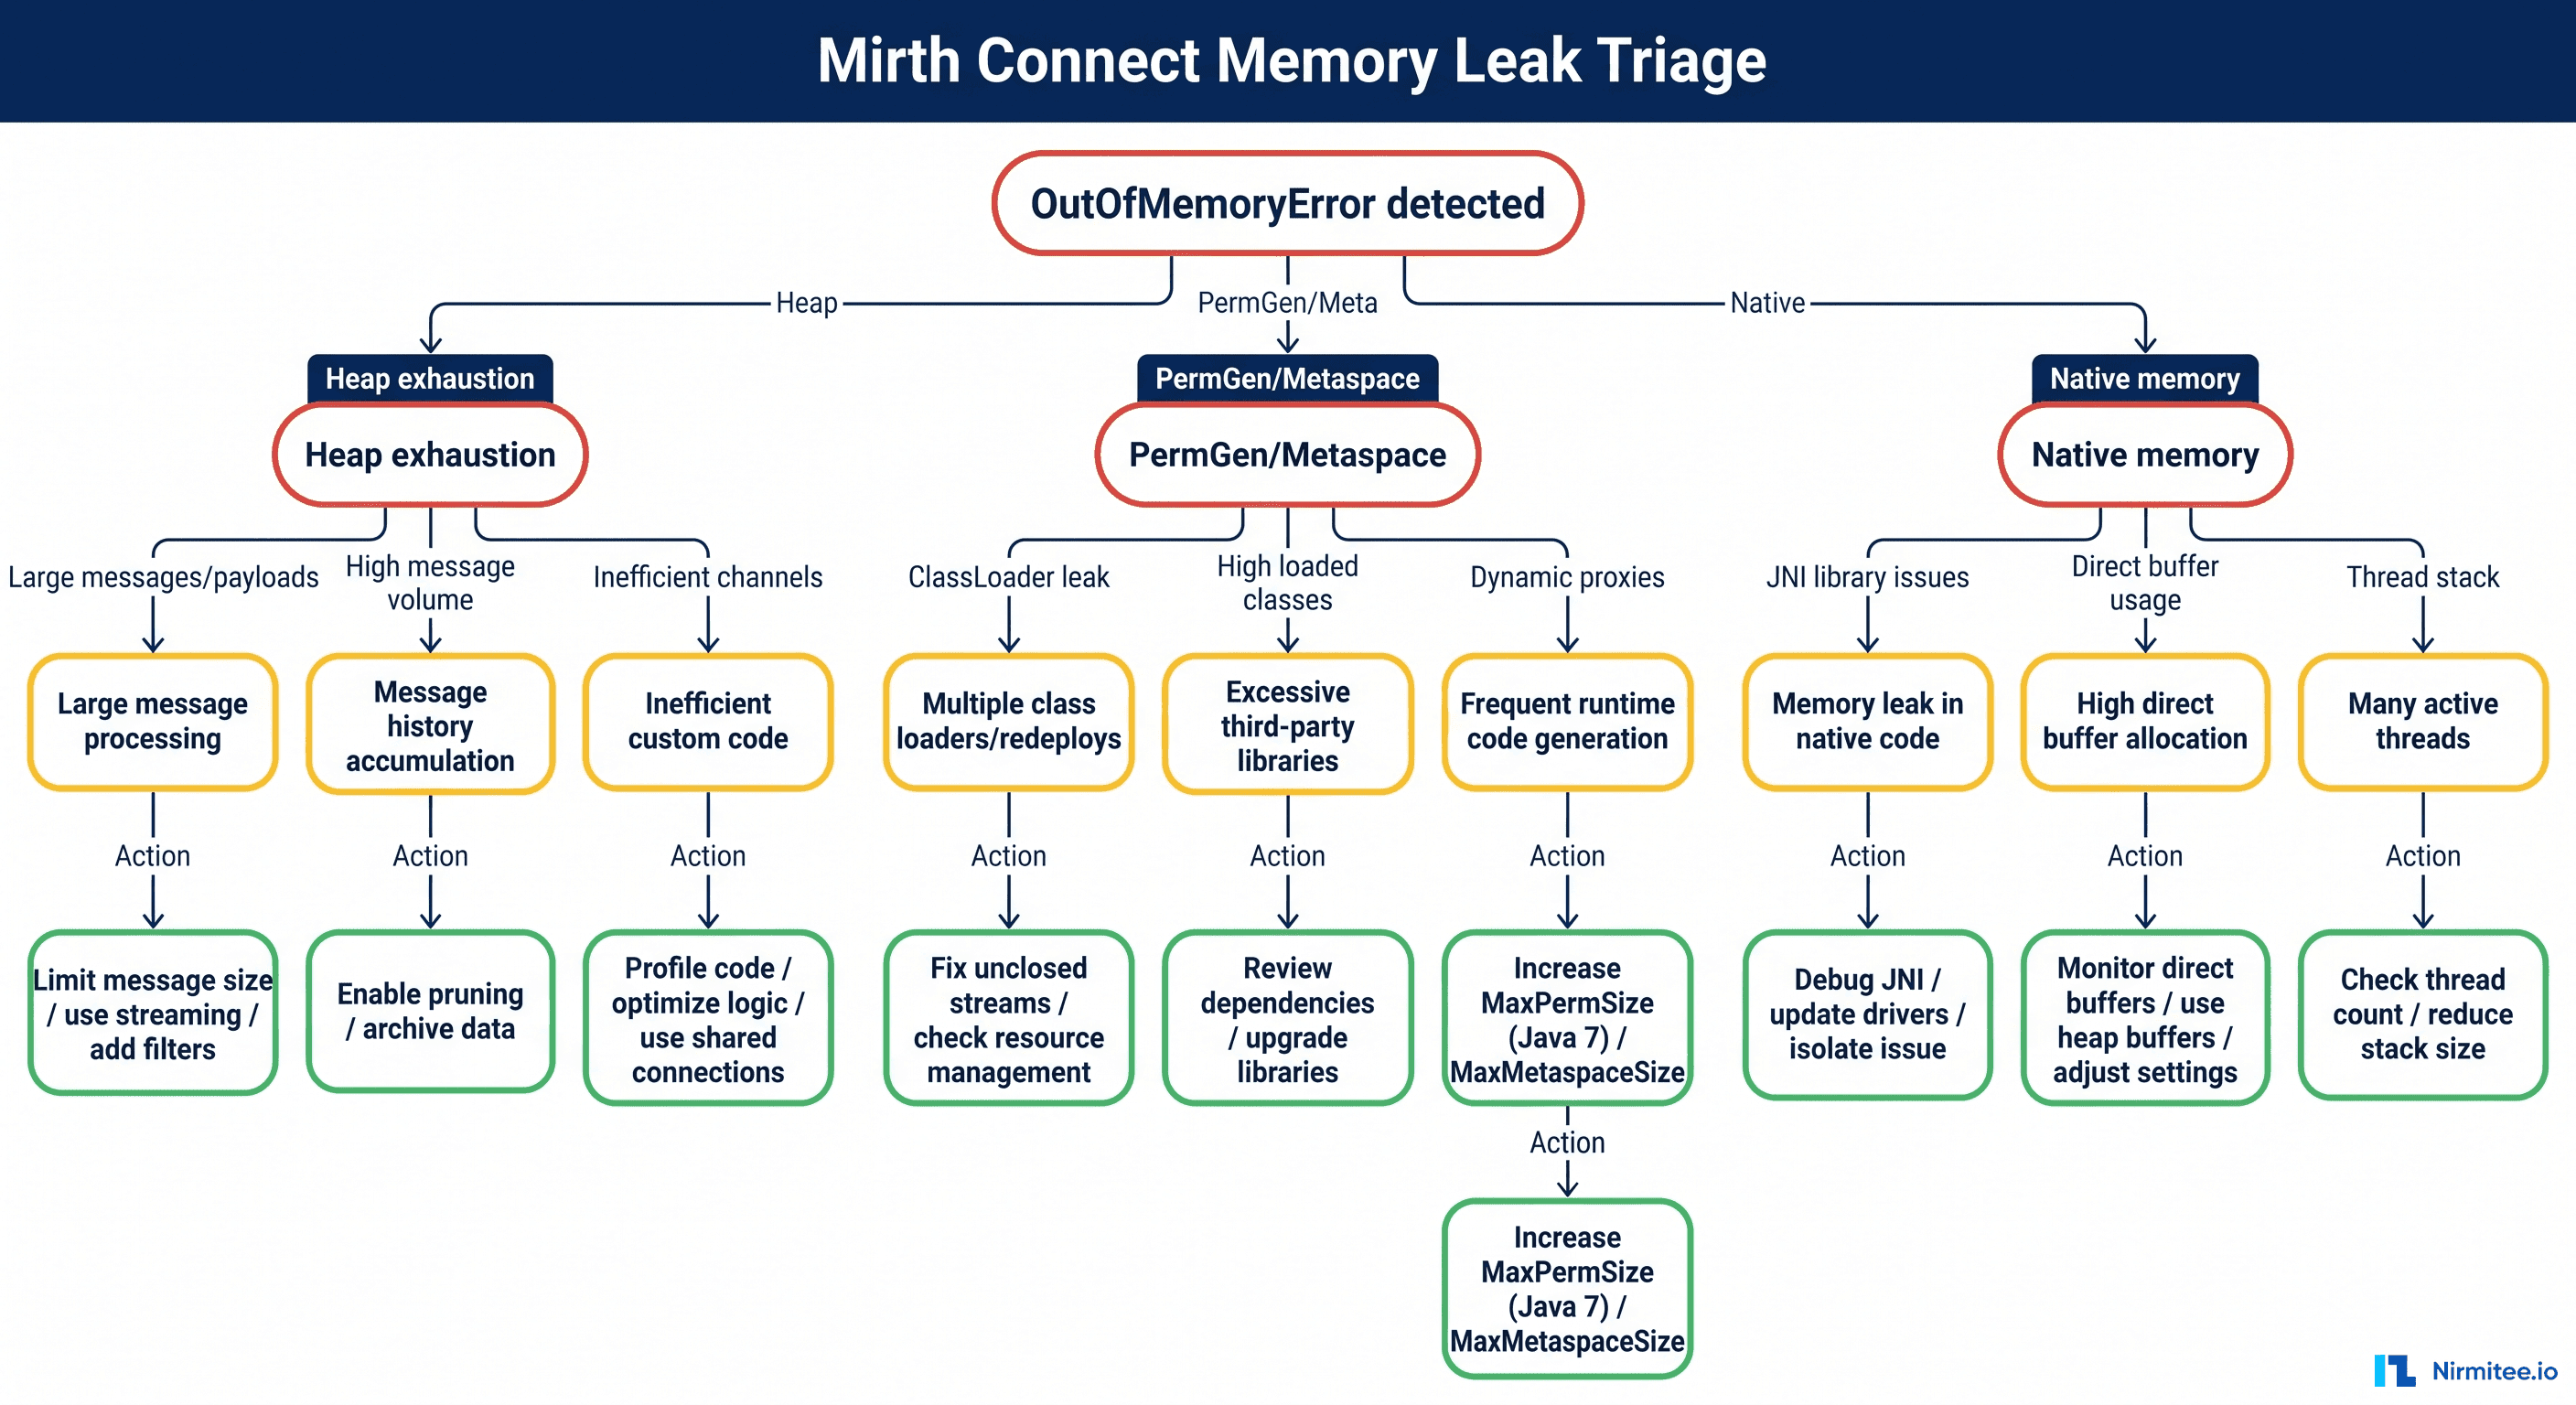
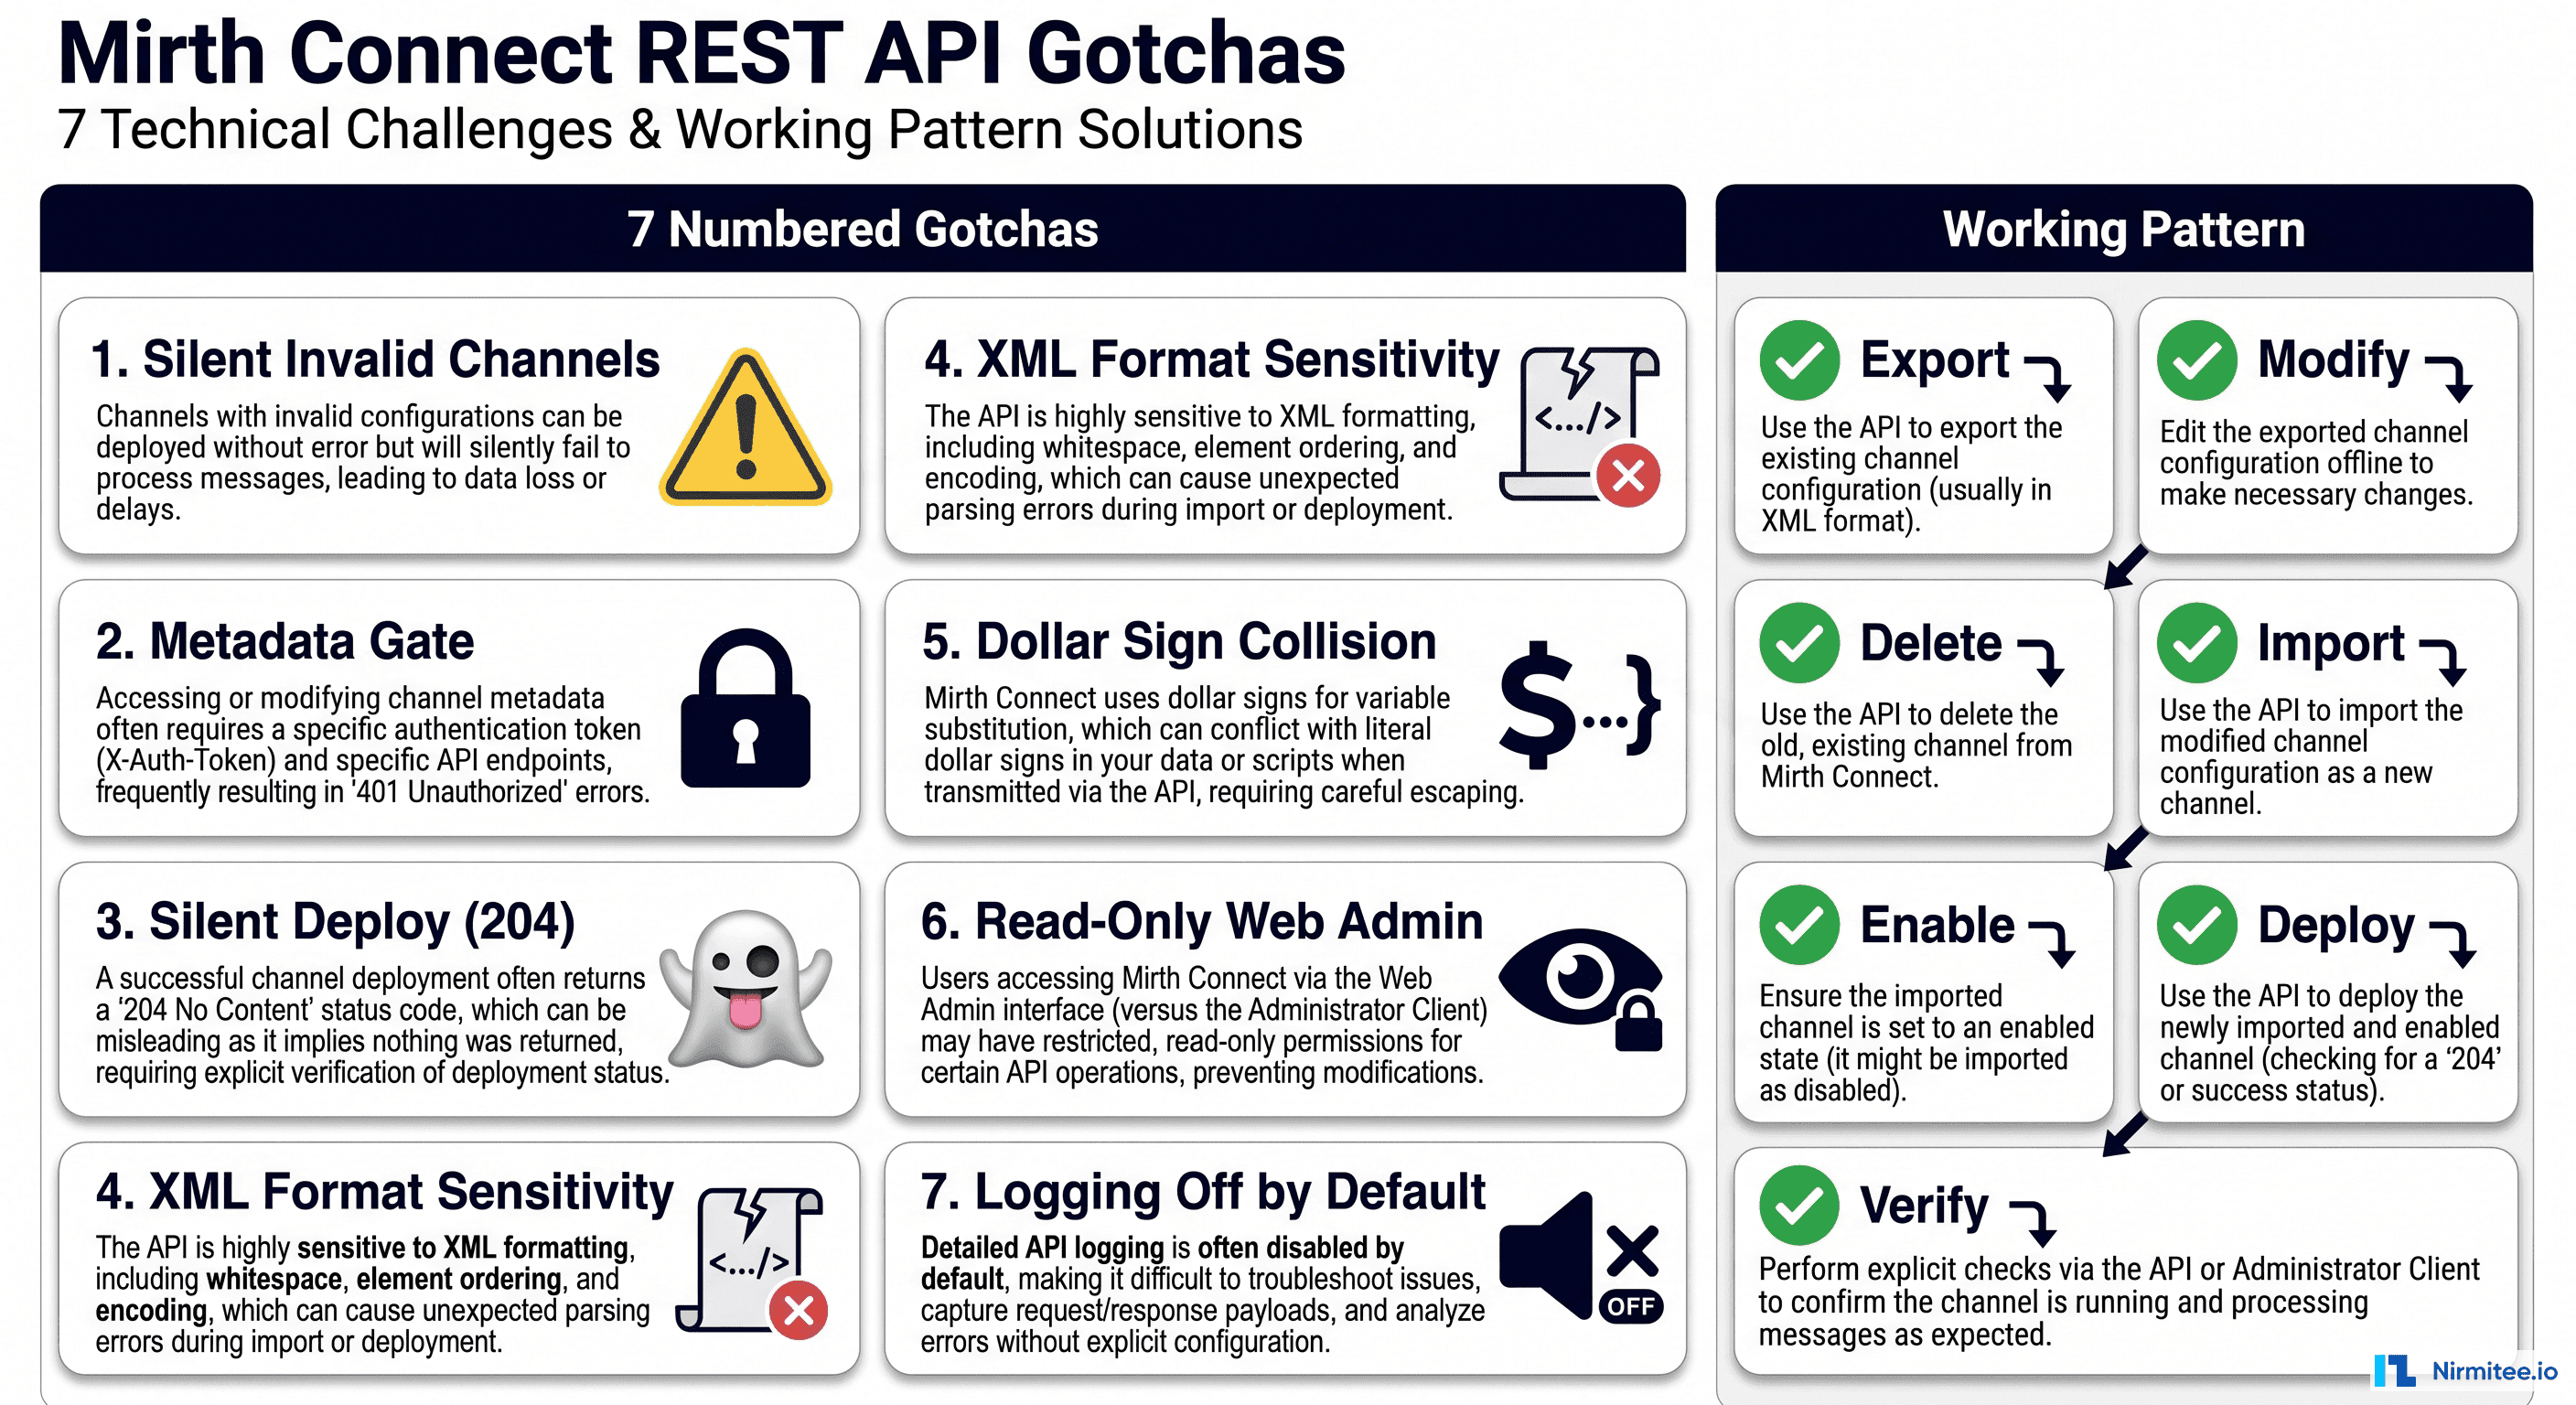
2. Custom Mirth Connect Channels with Zero Documentation
Mirth Connect (now NextGen Connect) is the most widely deployed open-source integration engine in healthcare. It is powerful, flexible, and — in the hands of a developer working under deadline pressure — capable of producing channels so complex that no one else can understand them.
A typical hospital Mirth instance contains 50-200 channels. The channels contain JavaScript transformers, custom database lookups, conditional routing logic, and error-handling workarounds accumulated over years of production issues. When the developer who built these channels leaves, the hospital inherits a black box. The channels work — until they don't. And when they fail, troubleshooting requires reverse-engineering JavaScript written by someone who is no longer available to explain it.
Annual cost: $100,000-$300,000 in specialized contractor fees for Mirth maintenance, plus unquantifiable risk of integration failures during staff transitions.
3. VB6 and Delphi Applications Still Processing Claims
Visual Basic 6, released in 1998 and officially unsupported by Microsoft since 2008, still runs critical healthcare workflows in a surprising number of organizations. VB6 applications in healthcare typically handle claims processing, eligibility verification, custom reporting, and departmental workflows that were built by in-house developers decades ago.
These applications lack modern encryption standards, cannot implement current authentication protocols, have no API capabilities, and run on Windows versions that themselves are approaching end-of-life. Finding developers who can maintain VB6 code is increasingly difficult and expensive — hourly rates for VB6 specialists are now $150-250/hour, compared to $100-175/hour for modern stack developers, purely due to scarcity.
Annual cost: $50,000-$200,000 per VB6 application in maintenance and Windows compatibility management, plus $500,000+ in security risk exposure per application handling PHI.
4. Single-Server Integration Engines with No High Availability
Many hospitals run their entire integration infrastructure on a single server — or worse, a single virtual machine on aging hardware. No clustering. No failover. No disaster recovery. If that server goes down, every interface in the hospital stops.
In a hospital where integration engines route lab results, admit-discharge-transfer (ADT) messages, pharmacy orders, and radiology reports, a single server failure can halt clinical workflows across the entire organization. The average cost of healthcare IT downtime is estimated at $7,900 per minute, meaning a 4-hour outage during peak operations costs over $1.9 million in direct impact alone.
Annual risk exposure: $500,000-$5,000,000 depending on outage frequency and duration.
5. Hard-Coded Credentials in Production Interfaces
Security audits of hospital integration environments routinely discover credentials embedded directly in interface configurations — database passwords in Mirth channel scripts, API keys in HL7 message headers, SFTP credentials in scheduled task configurations. These credentials are often shared across multiple interfaces, never rotated, and visible to anyone with access to the integration engine.
With the average healthcare data breach now costing $9.77 million (per IBM/Ponemon 2024), and hard-coded credentials being a primary attack vector, this form of technical debt carries the highest risk-to-awareness ratio. Organizations know it exists but deprioritize remediation because "it's been working fine."
Annual risk exposure: $2,000,000-$10,000,000 in potential breach costs, plus regulatory penalties under HIPAA Security Rule updates proposed for 2025-2026.
6. Manual CSV-Based Data Feeds on Scheduled Tasks
The last pattern is perhaps the most common and least visible: critical data flows that run on Windows Task Scheduler or cron jobs, processing CSV files dropped into shared network folders. Patient census data. Financial reconciliation. Quality measure reporting. Insurance eligibility batch files.
These workflows are fragile (a renamed column breaks everything), opaque (no monitoring or alerting), and often unknown to the IT department (built by departmental staff who have since left). When they fail silently, downstream systems receive stale or incorrect data — with patient safety implications that are difficult to detect.
Annual cost: $50,000-$150,000 per critical CSV workflow in staff time for manual monitoring and error correction, plus unquantifiable clinical risk from silent failures.
The Compounding Cost Model: Year 1 to Year 10
Technical debt does not stay static. It compounds. Understanding the compounding model is critical for making accurate long-term financial projections that justify modernization investment.
Year 1-3: Manageable but Growing
In the early years, technical debt feels manageable. The systems work. The team knows the quirks. Maintenance costs are predictable, averaging $400,000-$600,000 annually for integration infrastructure at a mid-sized hospital. The only visible signs are occasional weekend emergencies and a slowly growing backlog of interface modification requests.
Hidden costs in this phase:
- New interface builds take 2-3x longer than they should because developers must work around legacy constraints
- Vendor upgrade projects are delayed because custom interfaces need retesting
- Recruitment takes 30-50% longer because candidates see legacy stacks and decline
Year 4-6: Painful and Accelerating
The inflection point typically arrives in years 4-6. Key staff members leave — retirement, burnout, better offers. Vendor support contracts escalate as products approach end-of-life. Regulatory requirements (21st Century Cures Act, CMS-0057-F interoperability mandates, HIPAA Security Rule updates) demand capabilities that legacy architectures cannot provide.
Annual costs in this phase: $1.2M-$2.0M, driven by:
- Contractor dependency: $200-400/hour for specialists who understand both the legacy systems and the clinical workflows they support
- Compliance remediation: $300,000-$500,000 per major regulatory requirement that legacy systems cannot natively support
- Incident response: 3-5 critical integration failures per year, each requiring 40-80 hours of senior staff time
- Opportunity cost: 2-3 strategic projects per year that cannot proceed because integration resources are consumed by maintenance
Year 7-10: Existential
By year 7-10, the technical debt has become existential. The hospital is spending $3.0M-$4.5M annually on integration infrastructure that delivers the same (or degraded) functionality as a decade ago. Meanwhile:
- CMS mandates deadlines arrive: CMS-0057-F requires FHIR-based APIs to be operational by January 1, 2027. Legacy architectures that cannot support FHIR face compliance penalties.
- Cybersecurity insurance premiums spike: Insurers are increasingly requiring evidence of modern security architecture. Legacy systems with hard-coded credentials and unpatched vulnerabilities result in premium increases of 40-100%.
- Staff attrition accelerates: The remaining legacy experts are burned out, and new hires refuse to join. The organization faces a knowledge cliff where no one understands how critical systems work.
- Competitive disadvantage crystallizes: Neighboring health systems that modernized can onboard new clinical applications in weeks. Your organization takes months. Physician recruitment and patient satisfaction begin to suffer.
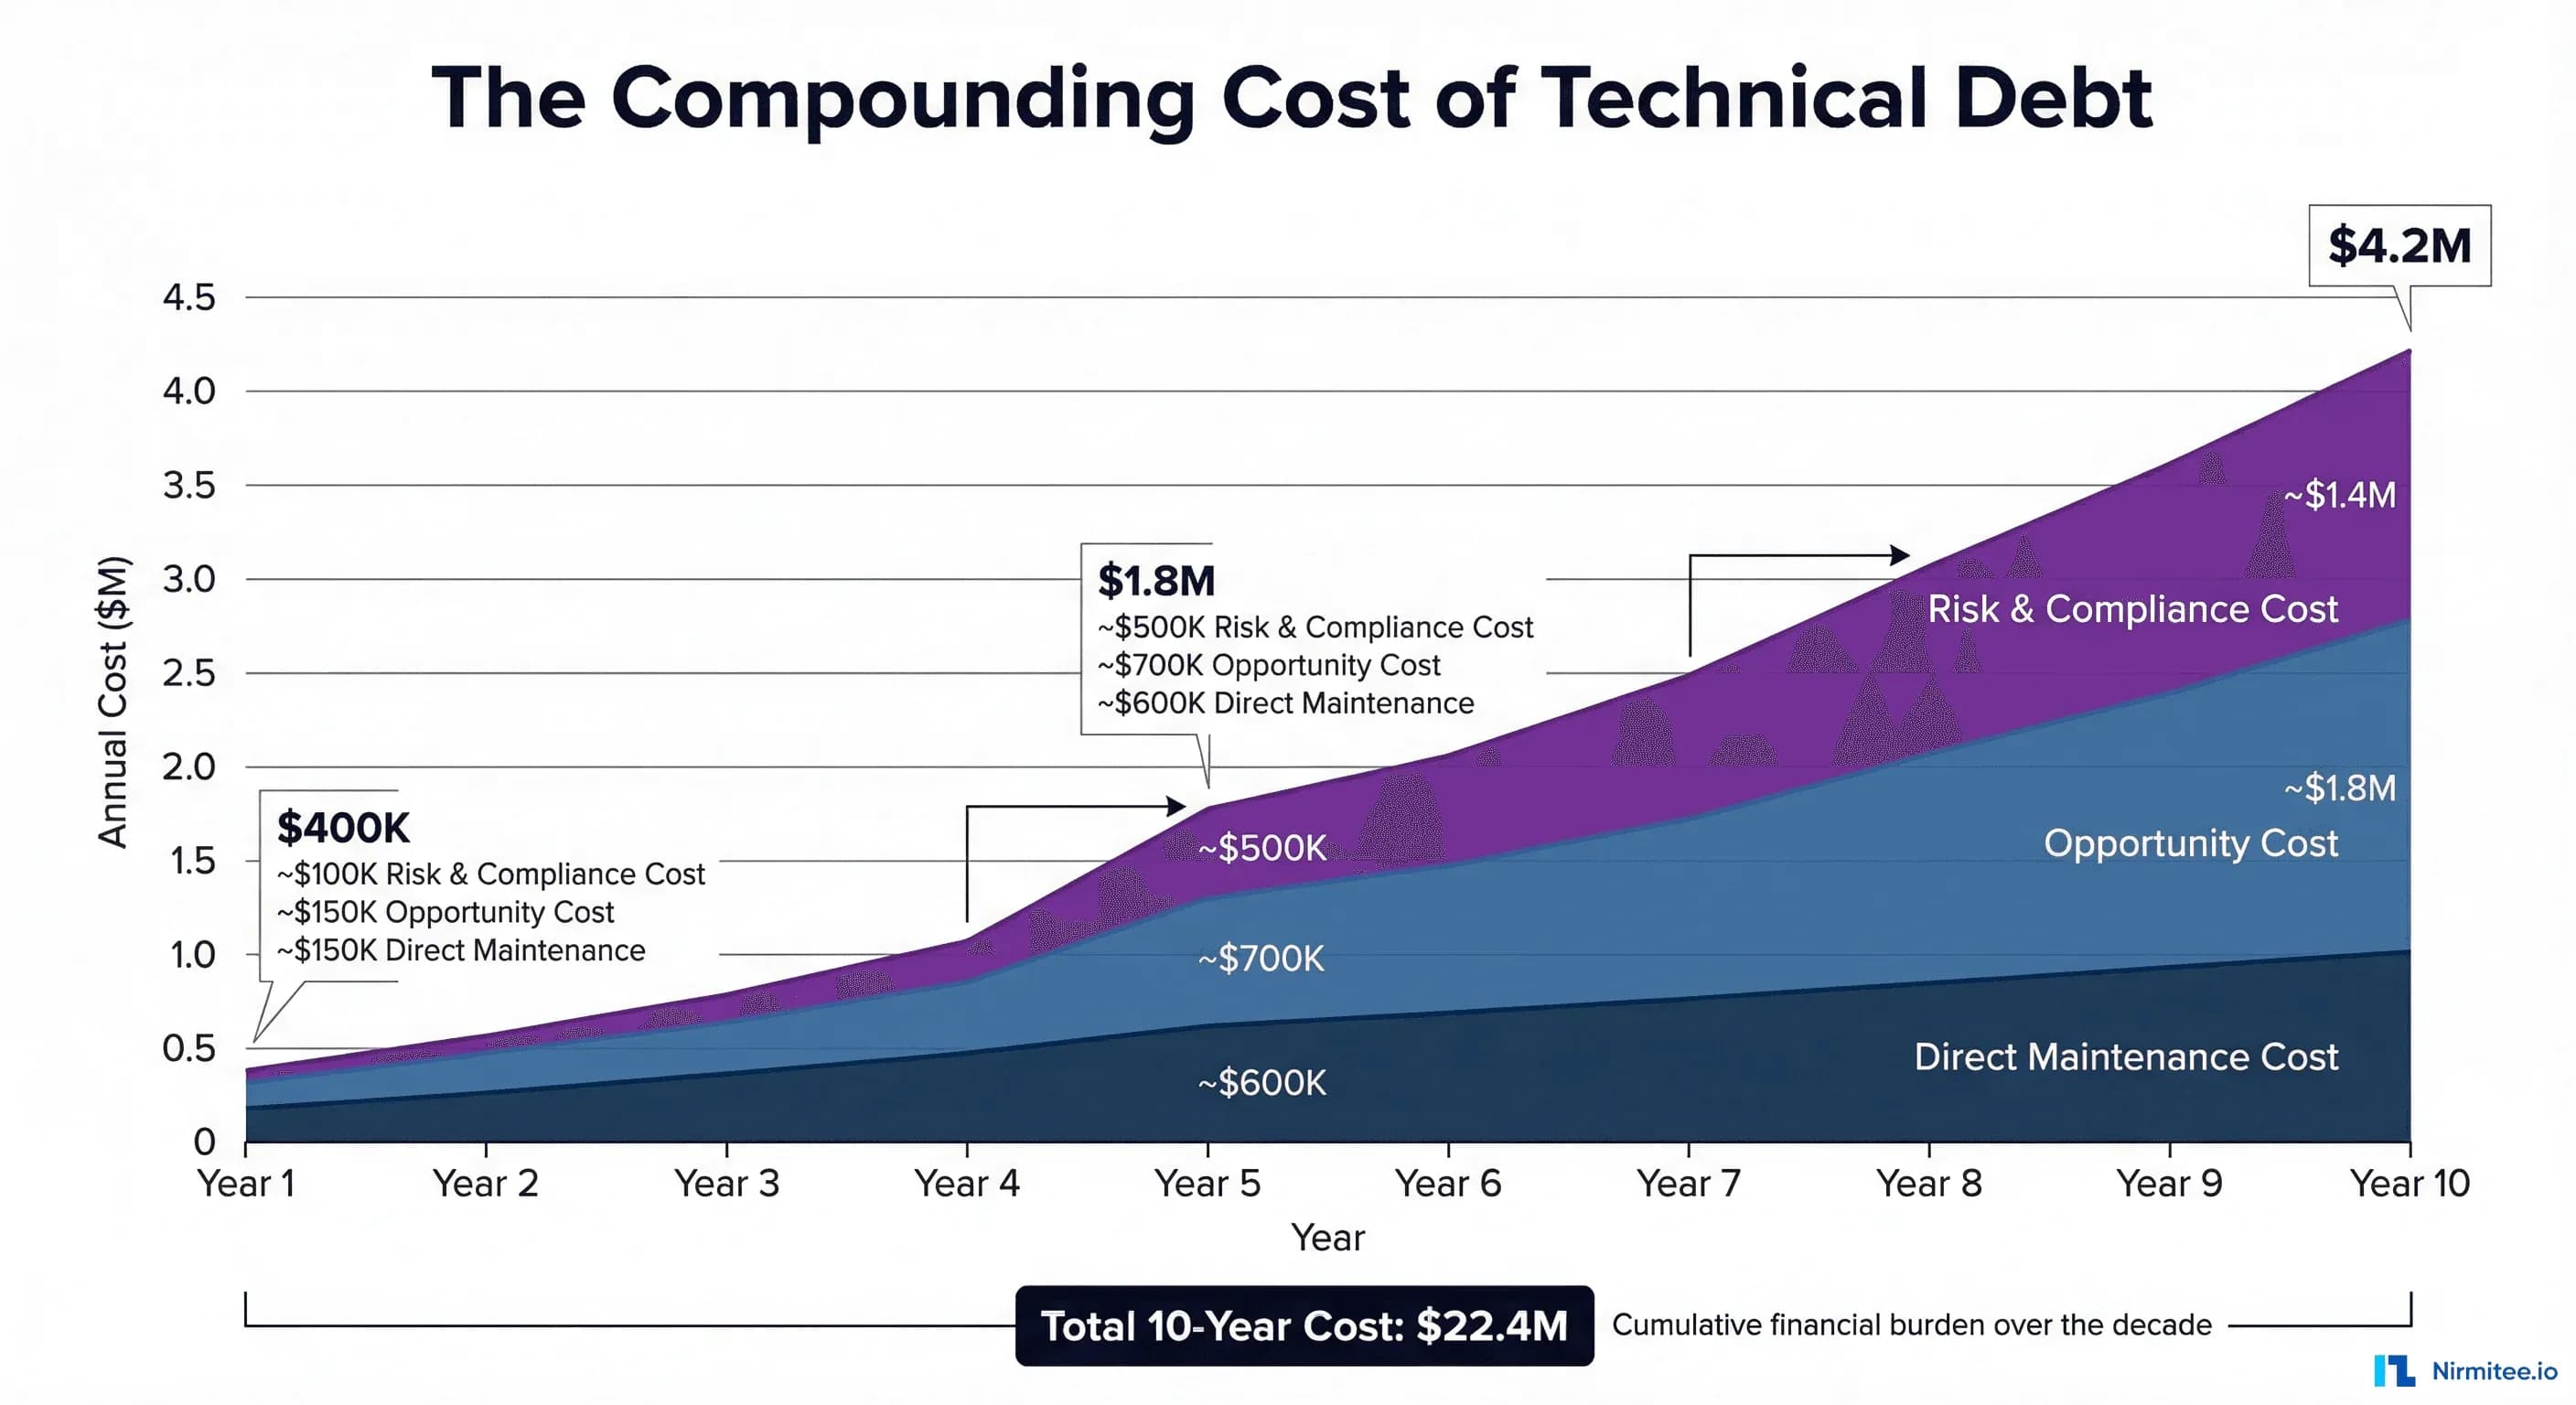
Total 10-year cost model for a mid-sized hospital (300 beds):
| Cost Category | Year 1 | Year 5 | Year 10 | 10-Year Total |
|---|---|---|---|---|
| Direct maintenance | $250K | $600K | $1.4M | $7.2M |
| Staff & contractors | $100K | $450K | $1.2M | $5.8M |
| Compliance remediation | $50K | $400K | $800K | $4.1M |
| Incident & downtime | $0 | $200K | $500K | $2.3M |
| Opportunity cost | $0 | $200K | $500K | $3.0M |
| Total | $400K | $1.85M | $4.4M | $22.4M |
That $22.4 million buys a lot of modernization. A full integration platform migration, cloud infrastructure, FHIR API implementation, and staff training can typically be accomplished for $2-5 million over 18-24 months — a fraction of the 10-year legacy cost.
What Breaks: Real Failure Scenarios from Hospital IT
The cost model above captures predictable, steady-state degradation. But technical debt also creates catastrophic failure scenarios — low-probability, high-impact events that can cost millions in a single incident. Here are the scenarios that hospital IT leaders lose sleep over.
Scenario 1: The Integration Engine Crash Nobody Can Fix
A hospital's primary Mirth Connect server crashes on a Friday evening. The server runs 180 channels processing ADT, lab results, pharmacy orders, and radiology reports. The Mirth administrator — the only person who understands the custom channels — left the organization six months ago. The current team can restart the service, but 23 channels fail to reinitialize due to database connection pool exhaustion caused by a configuration that the previous admin set manually and never documented.
Impact: 14 hours of degraded integration, manual result entry for 2,400 lab orders, and 3 delayed medication administrations flagged as safety events. Estimated cost: $890,000 in direct costs plus regulatory reporting requirements.
Scenario 2: The Knowledge Cliff
A 15-year veteran integration analyst retires. This person built 60% of the hospital's HL7v2 interfaces, managed the interface engine, maintained custom transformation scripts, and served as the single point of contact for all EHR vendor interface issues. No documentation exists beyond a shared folder of connection parameters.
The replacement hire takes 8 months to recruit (legacy skill requirements limit the candidate pool) and 12 months to achieve basic competency. During those 20 months, the interface modification requests backlog reached 6+ months, three vendor upgrade projects were delayed, and two critical interface failures required $400/hour emergency consulting.
Impact: 20-month capability gap. Estimated cost: $1.2 million in direct costs plus $800,000 in delayed project value.
Scenario 3: The Security Audit Nightmare
A post-breach forensic audit (or a proactive penetration test) discovers: hard-coded database credentials in 47 Mirth channels, PHI transmitted in plain text across 12 internal interfaces, an FTP server with anonymous access containing 3 years of patient eligibility files, and service accounts with domain admin privileges running integration scheduled tasks.
The remediation requires touching every integration in the environment — a 6-12 month project at the scope of a small modernization initiative, but without any of the modernization benefits. It is paying to fix the old system, so it is merely secure, not actually better.
Estimated cost: $600,000-$1.5 million in remediation. If the vulnerabilities are exploited before remediation, $9.77 million average breach cost per IBM/Ponemon 2024 data.
Scenario 4: The Regulatory Mandate the Architecture Cannot Meet
CMS-0057-F requires FHIR-based Patient Access APIs by January 2027. The hospital's integration architecture is built entirely on HL7v2 point-to-point interfaces through a legacy integration engine with no REST API capabilities, no FHIR support, and no OAuth 2.0 implementation.
Meeting the mandate requires: a FHIR server, an OAuth/OIDC authorization server, data transformation from legacy formats to FHIR resources, and a patient-facing API layer. None of these components can run on the existing integration engine. The hospital faces a choice: bolt on a parallel FHIR infrastructure (creating more technical debt) or use this as the catalyst for comprehensive modernization.
Estimated cost of bolt-on approach: $500,000-$1,000,000 with ongoing dual-maintenance burden. Estimated cost of modernization approach: $2,000,000-$4,000,000, but with compounding returns. Most hospitals choose the bolt-on, compounding the debt further.
Quantifying the Cost: A Framework for Your Organization
The 10-year model above uses industry averages. Your organization needs specific numbers. Here is the framework for calculating your technical debt cost.
Step 1: Inventory Legacy Assets
Create a comprehensive inventory of every system, interface, and workflow that qualifies as technical debt. For each asset, document:
- Age: When was it built? When was it last significantly updated?
- Technology: What stack does it run on? Is the stack still supported?
- Knowledge distribution: How many people understand it? (1 = critical risk, 2-3 = moderate, 4+ = manageable)
- Documentation quality: None / Outdated / Current
- Compliance status: Meets current requirements? Will it meet requirements in 2 years?
- Business criticality: What breaks if this system goes down?
Step 2: Calculate Direct Maintenance Cost
For each legacy asset, calculate:
Annual Direct Cost = (FTE hours × blended hourly rate) + vendor support contracts + infrastructure costs
Include: staff time for monitoring, troubleshooting, patching, testing, and modification requests. Include vendor maintenance fees, hosting costs, and any licensing fees for end-of-life products at premium rates.
Step 3: Calculate Opportunity Cost
Annual Opportunity Cost = (delayed projects × estimated project value) + (extended timelines × cost of delay)
This is harder to quantify, but often the largest component. For every project that is delayed, deferred, or descoped because legacy constraints consume available resources, estimate the value that the project would have delivered. A McKinsey study found that organizations actively managing technical debt deliver solutions 50% faster — meaning your delayed projects represent real, quantifiable lost value.
Step 4: Calculate Risk Cost
Annual Risk Cost = Σ (probability of event × cost of event)
Key risk events to model:
- Data breach via legacy vulnerability: probability 5-15% per year, cost $9.77M average
- Critical system failure with extended outage: probability 10-25% per year, cost $500K-$2M
- Key person departure (knowledge cliff): probability 15-30% per year, cost $500K-$1.5M
- Regulatory non-compliance finding: probability 20-40% per year, cost $100K-$1M
Step 5: Total Technical Debt Cost
Total Annual Technical Debt Cost = Direct Maintenance + Opportunity Cost + Risk Cost
For most mid-sized hospitals, this total ranges from $1.5M to $5M annually, compounding at 8-15% per year. Over 10 years, the present value of this cost stream is typically $15M-$40M.
The Modernization Decision Framework: Refactor, Rewrite, or Replace
Once you have quantified the cost, the next question is: what do you do about it? Not every legacy system warrants the same modernization approach. The decision depends on four factors: business criticality, code/architecture quality, team expertise, and time pressure.
Refactor: Update the Foundation, Keep the Structure
When to choose: The core business logic is sound, but the technology stack is outdated. The architecture can support modern requirements with targeted updates.
Examples in healthcare:
- Adding a FHIR API layer to an existing integration engine
- Upgrading a .NET Framework application to .NET 8
- Replacing hard-coded credentials with a secrets management solution
- Adding monitoring and alerting to existing interfaces
Cost: $$ (20-40% of replacement cost)
Risk: Low — incremental changes with rollback capability
Timeline: 3-6 months per major component
Best for: Systems less than 10 years old with documented, maintainable code
Rewrite: Build New from Scratch
When to choose: The architecture is fundamentally incompatible with current requirements. The existing code cannot be incrementally improved — it needs to be rebuilt.
Examples in healthcare:
- Replacing a VB6 claims processing application with a modern web application
- Rebuilding a custom patient portal from monolithic PHP to a React + API architecture
- Creating a new integration platform to replace a deeply customized, unsupported engine
Cost: $$$$ (100-200% of original build cost, adjusted for complexity)
Risk: High — greenfield development with potential for scope creep and requirement gaps
Timeline: 12-24 months for a full replacement
Best for: Systems with fundamentally broken architectures where no amount of refactoring will suffice
Replace: Buy a Commercial Solution
When to choose: A mature commercial product exists that addresses 80%+ of requirements. The custom-built system does not provide competitive differentiation — it was built because a commercial option did not exist at the time.
Examples in healthcare:
- Replacing a custom integration engine with a cloud-native iPaaS (Rhapsody, Azure Health Data Services, Google Cloud Healthcare API)
- Replacing custom scheduling software with a vendor solution
- Migrating custom reporting to a modern BI platform
Cost: $$$ (licensing + implementation + migration, typically 50-150% of annual legacy maintenance cost)
Risk: Medium — vendor dependency and data migration complexity
Timeline: 6-12 months for selection, implementation, and migration
Best for: Commodity functions where commercial solutions have matured significantly since the custom system was built
Decision Matrix
| Factor | Refactor | Rewrite | Replace |
|---|---|---|---|
| Code quality | Decent, needs updates | Poor, unmaintainable | Irrelevant (replacing) |
| Architecture fit | Good bones, surface issues | Fundamentally wrong | N/A |
| Team expertise | Team knows the codebase | The team has modern skills | Team can manage the vendor |
| Time pressure | Can iterate (3-6 mo) | Can invest (12-24 mo) | Need results (6-12 mo) |
| Competitive advantage | Yes — logic is valuable | Yes — need a custom solution | No — commodity function |
| Budget | Limited | Substantial | Moderate + ongoing license |
Migration Strategies: Proven Patterns for Healthcare Modernization
Once the decision is made, execution determines success. These four migration strategies have been proven in healthcare environments where downtime is unacceptable and data integrity is non-negotiable.
Strategy 1: The Strangler Fig Pattern
Named by Martin Fowler after the tropical strangler fig tree that grows around its host until the host is completely replaced, this pattern is the gold standard for healthcare system migration. It works by placing a facade (API gateway or routing layer) in front of the legacy system, then gradually routing requests to new services while the legacy system continues operating.
How it works in healthcare:
- Phase 1 (Months 1-3): Deploy an API gateway or FHIR facade in front of the legacy integration engine. All existing traffic continues flowing to legacy systems unchanged. New API consumers (patient apps, third-party systems) connect through the facade.
- Phase 2 (Months 4-12): Gradually migrate interfaces from legacy to modern services behind the facade. Start with the lowest-risk interfaces (reference data, non-clinical feeds) and progress to the higher-risk ones (lab results, medication orders). At each stage, run both old and new in parallel to validate data accuracy.
- Phase 3 (Months 12-18): Decommission legacy components as their traffic reaches zero. The facade becomes the permanent API layer.
Why it works for healthcare: Zero downtime migration. If a new service has issues, the facade routes traffic back to the legacy system instantly. Patient care is never disrupted. The parallel-run phase provides the data validation that clinical workflows demand.
Strategy 2: FHIR Facade over Legacy Backend
For organizations that need to meet CMS interoperability mandates without a full backend migration, a FHIR facade provides a modern API layer while preserving existing data storage and business logic. This is particularly relevant for the January 2027 CMS-0057-F deadline.
Architecture: A FHIR server sits between external consumers and the legacy database. It translates FHIR REST API requests into legacy database queries and transforms legacy data models into FHIR resources (Patient, Encounter, Observation, etc.) on the fly.
Benefits: Fastest path to FHIR compliance. Does not require migrating data or rewriting business logic. Can be implemented in 3-6 months. Risks: Creates another layer to maintain. Does not address the underlying technical debt in the backend. Performance depends on legacy database query efficiency.
Strategy 3: Integration Engine Consolidation
Many hospitals have accumulated multiple integration engines over the years — a Mirth instance for lab interfaces, an eGate installation for ADT, a BizTalk server for claims, and a collection of custom scripts for everything else. Consolidation onto a single modern platform eliminates redundant infrastructure, centralizes monitoring, and creates a single source of truth for all integration metadata. For a deeper analysis of integration platform options, see our guide on how to choose the right healthcare integration platform.
Approach: Select a modern integration platform (cloud-native iPaaS, open-source FHIR-native engine, or managed service). Migrate interfaces one engine at a time, starting with the engine that has the fewest interfaces or the highest maintenance cost. Validate each migrated interface in parallel before decommissioning the source engine.
Strategy 4: Database Modernization (On-Prem to Cloud)
Legacy integration databases — often on-premises SQL Server or Oracle instances running on aging hardware — create single points of failure, backup complexity, and scalability constraints. Migrating to cloud-managed databases (AWS RDS, Azure SQL, Google Cloud SQL) provides automatic backups, high availability, automatic patching, and elastic scaling without the capital expense of hardware replacement.
Key consideration for healthcare: Cloud databases must be configured for HIPAA compliance. This means encryption at rest and in transit, audit logging, access controls, and Business Associate Agreements (BAAs) with the cloud provider. All major cloud providers offer HIPAA-eligible database services, but configuration is the organization's responsibility.
ROI of Modernization: Before and After Metrics
Modernization is not a cost center — it is an investment with measurable returns. Here are documented metrics from healthcare organizations that have completed integration modernization projects, compiled from industry case studies and vendor-published data.
| Metric | Before (Legacy) | After (Modernized) | Improvement |
|---|---|---|---|
| New interface build time | 4-8 weeks | 1-2 weeks | 75% faster |
| Interface failure resolution | 4-24 hours | 15-60 minutes | 90% faster |
| Staff required for integration ops | 4-6 FTEs | 2-3 FTEs | 50% reduction |
| Annual maintenance cost | $1.8M | $600K | 67% reduction |
| Unplanned downtime (hours/year) | 40-80 hours | 2-8 hours | 90% reduction |
| Time to connect new vendor | 3-6 months | 2-4 weeks | 85% faster |
| Security audit findings | 15-30 critical | 0-3 critical | 90% reduction |
| FHIR API readiness | None | Full US Core support | CMS compliant |
Case study composite: A 450-bed hospital network spent $3.2 million over 24 months migrating from a legacy Mirth Connect/custom script environment to a cloud-native integration platform with FHIR-native capabilities. In the first year post-migration, they reduced integration operations staff from 5 FTEs to 2.5 FTEs ($375,000 annual savings), eliminated $480,000 in legacy vendor contracts, reduced unplanned downtime from 67 hours to 4 hours annually, and met CMS-0057-F FHIR requirements 14 months ahead of the deadline. Year 1 savings: $1.1 million. Projected 5-year ROI: 340%.
Understanding common pitfalls is equally important — see our analysis of common healthtech integration mistakes to avoid repeating them during modernization.
How to Sell Modernization to the CFO: A Business Case Template
The biggest barrier to modernization is not technology — it is the business case. CIOs and CTOs know the technical debt is unsustainable, but CFOs need to see numbers. Here is a template for making the case.
Frame 1: The Cost of Doing Nothing
This is the most powerful frame because it shifts the conversation from "how much will modernization cost?" to "how much is the current situation costing us?" Use your organization-specific numbers from the quantification framework above.
Template language: "We are currently spending $X per year to maintain our integration infrastructure, growing at Y% annually. Over the next 5 years, the cumulative cost of our current approach is $Z. This spending delivers zero new capabilities — it merely preserves the status quo."
Frame 2: Regulatory Compliance Risk
Template language: "CMS-0057-F requires FHIR-based APIs by January 2027. Our current architecture cannot support FHIR. The minimum compliance cost is $X using a bolt-on approach that does not reduce our overall technical debt. A modernization approach costs $Y but eliminates $Z in annual maintenance costs while achieving compliance."
Frame 3: The Security Liability
Template language: "Our last security assessment identified N critical findings in our integration infrastructure, including hard-coded credentials and unencrypted PHI transmission. The average healthcare breach costs $9.77 million. Our cyber insurance carrier has indicated that continued use of unsupported software may affect our coverage terms."
Frame 4: Competitive Position
Template language: "Connecting a new clinical application currently takes us X months. Industry benchmarks for modernized organizations are Y weeks. This directly impacts our ability to recruit physicians, implement clinical programs, and respond to market opportunities."
Frame 5: The Investment and Return
Template language: "The proposed modernization requires an investment of $X over Y months. Based on documented maintenance reduction, staff efficiency, and risk mitigation, the projected payback period is Z months with a 5-year ROI of W%."
Key CFO Concerns to Address Proactively
| CFO Concern | Your Response |
|---|---|
| "Can't we just keep maintaining?" | Show the compounding cost curve. Year 10 costs are 10x Year 1. |
| "What if modernization goes over budget?" | Use the strangler fig pattern — incremental investment with measurable milestones. If value is not demonstrated at each phase, the project can be paused. |
| "What about disruption to operations?" | Parallel-run migration ensures zero downtime. Legacy systems remain operational until replacements are validated. |
| "Why not wait for next fiscal year?" | Every year of delay adds $X to the total cost (show compounding model). CMS deadlines are not flexible. |
| "What are other hospitals doing?" | Over 60% of US hospitals are actively modernizing integration infrastructure (HIMSS 2024 data). Early movers report 50-70% maintenance cost reduction within 24 months. |
Building Your Modernization Roadmap
Modernization does not happen overnight. The most successful healthcare organizations approach it as a multi-year program with clear phases, measurable milestones, and governance structures that sustain momentum beyond the initial enthusiasm. For context on where the industry standard is heading, see our guide to migrating from HL7v2 to FHIR.
Quarter 1: Assessment and Quick Wins
- Complete the technical debt inventory using the framework above
- Quantify the cost using the direct + opportunity + risk model
- Identify 3-5 quick wins: credential rotation, monitoring implementation, and documentation of critical interfaces
- Present the business case to executive leadership
Quarter 2-3: Foundation
- Select the modernization strategy (refactor/rewrite/replace) for each major component
- Deploy the initial facade or API gateway layer
- Begin migrating the lowest-risk interfaces to the new platform
- Implement monitoring, alerting, and documentation standards
Quarter 4-6: Migration
- Migrate clinical interfaces in priority order (based on risk and business value)
- Implement FHIR APIs for CMS compliance requirements
- Decommission first legacy components
- Measure and report first ROI metrics
Quarter 7-8: Optimization
- Complete migration of remaining interfaces
- Decommission legacy integration engines
- Optimize cloud infrastructure costs
- Document final architecture and establish ongoing governance
Conclusion: The Cost of Waiting is the Highest Cost of All
Technical debt in healthcare is not a technology problem. It is a financial problem with technology symptoms. Every year that modernization is deferred, the cost compounds — maintenance fees increase, qualified staff become scarcer, regulatory requirements become harder to meet, and the gap between your organization and modernized competitors widens.
The organizations that will thrive in the next decade of healthcare IT are those that treat their integration infrastructure not as a cost center to be minimized, but as a strategic asset to be invested in. The $2-5 million spent on a comprehensive modernization program is not an expense — it is the elimination of a $15-40 million liability.
The best time to start modernizing was five years ago. The second-best time is now.