
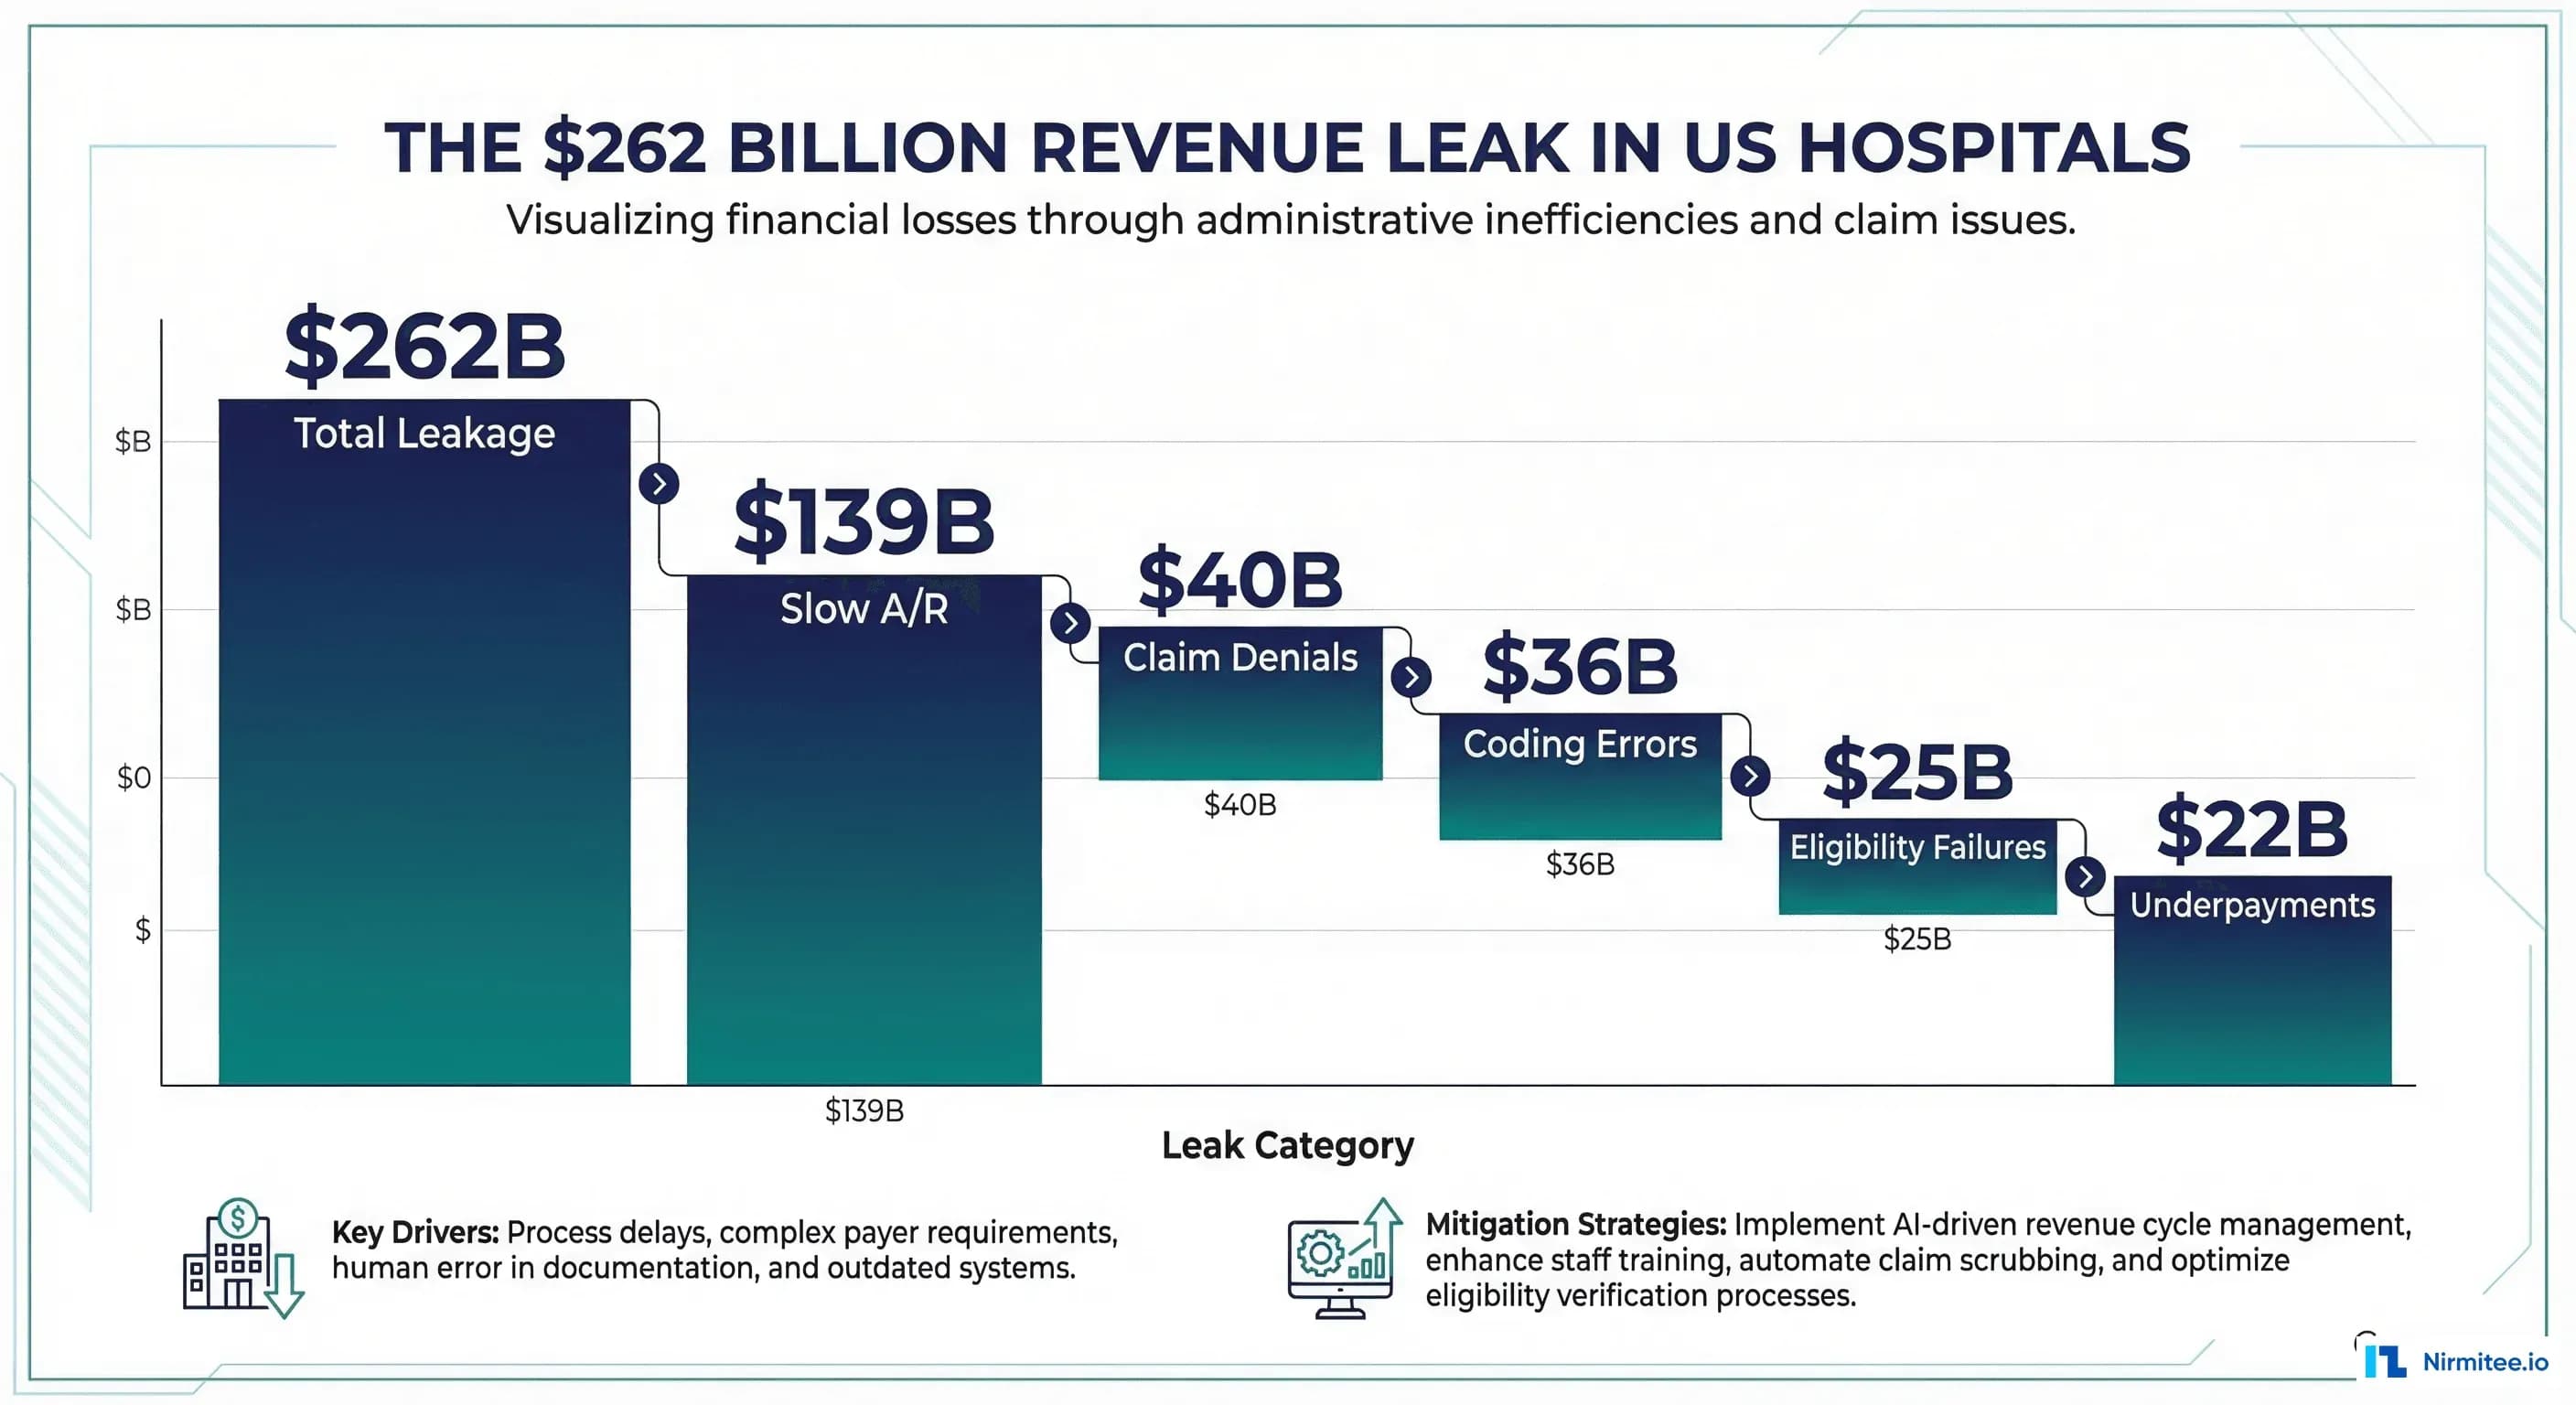
The US healthcare system processes roughly $4.3 trillion in annual spending. Buried within that number is a staggering inefficiency: an estimated $262 billion in revenue leakage — money that hospitals and health systems have earned but never collect, collect late, or lose to preventable errors. This is not fraud. This is not denied care. This is operational failure at the intersection of clinical documentation, billing systems, payer rules, and data integration.
According to a 2024 analysis by the Healthcare Financial Management Association (HFMA), the average US hospital operates on a 2-3% net margin. For a 300-bed hospital generating $500 million in gross revenue, even a 1% improvement in revenue capture translates to $5 million in additional operating income — often the difference between investing in new clinical programs and cutting staff. The revenue cycle is not back-office paperwork. It is the financial engine that determines whether a hospital can keep its doors open.
This article breaks down exactly where the $262 billion leaks, what data and integration gaps cause each leak, and what modern health systems are doing to close them. If you are a CFO, revenue cycle leader, or engineering team building healthcare financial technology, these are the numbers and architectures you need to understand.
Leak #1: Eligibility Verification Failures — $25 Billion
The revenue cycle starts before the patient ever sees a physician. At registration, the front desk needs to verify that the patient's insurance is active, the planned services are covered, and the correct plan and group numbers are on file. When this verification fails — or never happens — the downstream consequences cascade through the entire revenue cycle.
The Root Cause
The fundamental problem is data staleness. Patients change jobs, switch plans, lose coverage, and gain new benefits throughout the year. A patient who had Blue Cross PPO when they booked their appointment six weeks ago may have switched to an Aetna HMO by the time they arrive. The registration system still has the old information, and nobody checks until the claim comes back denied 30-45 days later.
According to the Medical Group Management Association (MGMA), 30% of all claim denials are directly attributable to eligibility and registration errors. The CAQH Index reports that manual eligibility verification costs $7.09 per transaction, compared to $0.32 for electronic verification — a 22x cost differential.
The Data Required
Real-time eligibility verification requires sending a 270 Eligibility Inquiry transaction to the payer and receiving a 271 Eligibility Response. This X12 EDI transaction contains the patient's coverage status, effective dates, copay amounts, deductible status, and benefit limitations. The 271 response is dense — often 200+ data elements — and must be parsed and presented to registration staff in a usable format within seconds.
The Integration Point
The gap is between the practice management system (PMS) or EHR scheduling module and the payer's eligibility service. Most EHRs have some eligibility checking built in, but it is often batch-based (running overnight) rather than real-time. The fix requires a real-time 270/271 integration that fires automatically when:
- A patient schedules an appointment (D-7 to D-1 check)
- A patient checks in (day-of verification)
- Insurance information changes in the system
- A high-dollar procedure is scheduled (triggered by CPT code value threshold)
The Automation Opportunity
Health systems that implement real-time eligibility verification with automated patient notification (text/email alerts when coverage issues are detected) report 40-60% reduction in eligibility-related denials and 12-15% improvement in point-of-service collections. The technology exists today — the barrier is integration. Most hospitals run 15-25 different clinical and financial systems that need to share patient insurance data in real time. For organizations looking to build this kind of connectivity, understanding how EHR integration enables interoperability is a prerequisite.
Leak #2: Coding Errors — $36 Billion
Medical coding translates clinical encounters into the ICD-10, CPT, and HCPCS codes that determine reimbursement. When coding is wrong — too specific, not specific enough, missing codes, wrong sequence — the financial impact is immediate and often invisible until audit.
The Root Cause
Coding errors stem from three sources: documentation gaps (the physician did not document with sufficient specificity), coder knowledge gaps (the coder misinterpreted the documentation or applied the wrong guideline), and system gaps (the EHR did not present the documentation in a way that supports accurate coding). The American Health Information Management Association (AHIMA) estimates that under-coding is 2-3 times more common than over-coding, meaning hospitals are leaving money on the table, not stealing it.
The Breakdown
| Error Type | % of Coding Errors | Annual Cost Impact | Root Cause |
|---|---|---|---|
| Under-coding (missed specificity) | 42% | $15.1B | Documentation does not support higher-specificity code |
| Wrong code selection | 28% | $10.1B | Coder selected incorrect code from similar options |
| Modifier errors | 18% | $6.5B | Missing or incorrect CPT modifiers (25, 59, 76) |
| Sequencing errors | 12% | $4.3B | Principal diagnosis incorrect for inpatient stays |
The Integration Point
Coding accuracy requires tight integration between clinical documentation and the coding workflow. The most effective architecture is concurrent coding with AI assistance — where the coding engine has real-time access to the clinical note as it is being written, can flag documentation gaps before discharge, and can suggest codes with confidence scoring. This requires EHR-to-coding-engine integration that goes beyond batch file transfers. For a deep dive into how AI is transforming this space, see our analysis of medical coding with AI and why NLP alone gets 70% of codes wrong.
The Automation Opportunity
AI-assisted coding with human-in-the-loop review is now achieving 93-96% accuracy in production environments, compared to 89-92% for fully manual coding. The productivity gain is equally significant: coders using AI suggestions process 35-45% more encounters per hour. At scale, this translates to $2.8-4.1 million in annual revenue capture improvement for a typical 100-bed hospital.
Leak #3: Claim Denials — $40 Billion
Claim denials are the most visible leak in the revenue cycle. When a payer rejects a claim, the hospital must investigate, correct, and resubmit — a process that costs $25-50 per denial in staff time alone, with an average resolution time of 30-60 days. The math is brutal: the average hospital has a 10-15% initial denial rate, with some specialties (behavioral health, oncology, orthopedics) running 20-25%.
The Root Cause
Denials have multiple causes, but they cluster into preventable categories:
- Missing or invalid authorization (24%): The procedure required prior authorization that was not obtained, or the authorization expired before the service was rendered
- Coding errors (22%): Overlaps with Leak #2 — wrong codes, missing modifiers, unbundling violations
- Medical necessity (18%): The payer determined that the service was not medically necessary based on the diagnosis codes submitted
- Timely filing (14%): The claim was submitted after the payer's filing deadline (typically 90-365 days depending on payer)
- Duplicate claims (12%): The same service was billed twice, often due to system integration issues between the hospital and professional billing
- Other (10%): Coordination of benefits, non-covered services, patient liability
The Data Required
Denial prevention requires cross-referencing multiple data sources before the claim is submitted:
- Payer rules engine: Each payer has specific rules about what requires authorization, what codes can be billed together, and what documentation is needed for medical necessity
- Authorization tracking: Real-time status of all prior authorizations, including expiration dates and approved units
- Claim history: Previous claims for this patient to detect potential duplicate submissions
- EDI validation: Pre-submission claim scrubbing against 837 transaction formatting rules
The Integration Point
The critical integration is between the EHR/PMS order entry system and the payer authorization and rules systems. When a physician orders a procedure, the system should automatically check: (1) Does this require prior auth? (2) if yes, has it been obtained? (3) Is the auth still valid? (4) Are the diagnosis codes sufficient for medical necessity? This requires real-time connectivity between clinical and financial systems — exactly the kind of integration that modern healthcare integration platforms are designed to provide.
The Automation Opportunity
Machine learning models trained on historical denial data can predict which claims are likely to be denied before submission, with accuracy rates of 85-92%. These predictive denial models analyze claims against payer-specific rules, historical denial patterns, and documentation completeness to flag high-risk claims for human review. Health systems using predictive denial management report 20-30% reduction in overall denial rates and 50-60% reduction in denial rework costs.
Leak #4: Underpayments — $22 Billion
Perhaps the most insidious leak is underpayment — when payers reimburse less than the contracted rate. Unlike denials, underpayments are quiet. The claim is paid, the payment is posted, and unless someone actively compares the payment to the expected amount under the contract, the shortfall goes unnoticed.
The Root Cause
Underpayments happen for several reasons:
- Incorrect fee schedule loading: The payer updated their fee schedule, but the hospital's contract management system was not updated to match
- Contract term misapplication: Complex contracts with carve-outs, escalators, and case rate thresholds are applied incorrectly by the payer's adjudication system
- Bundling/unbundling errors: The payer bundles separately billable services, reducing the total payment
- Coordination of benefits (COB) errors: When a patient has multiple insurance plans, the primary/secondary payment calculation is wrong
- Downcoding: The payer reduces the code level (e.g., paying 99214 as 99213) without proper documentation or notification
The Data Required
Detecting underpayments requires matching every payment received (from the 835 Electronic Remittance Advice) against the expected payment calculated from the payer contract terms. This means digitizing and modeling every payer contract — including all the amendments, fee schedule updates, and carve-out provisions — into a computable format. For a 300-bed hospital with 50+ payer contracts, this is a significant data modeling challenge.
The Integration Point
The integration is between the 835 remittance feed (from the clearinghouse or payer), the contract management system, and the payment posting system. When an 835 is received, the system should automatically: (1) parse the payment, adjustment, and remark codes, (2) calculate the expected payment for each line item based on the contract, (3) flag variances above a threshold (typically $25+), and (4) generate an appeal or inquiry for underpaid claims.
The Automation Opportunity
Automated payment variance detection and appeal generation can recover 1-3% of net revenue that would otherwise be lost to underpayment. For a $500 million hospital, that is $5-15 million annually. The key is automation of the 835 parsing and contract modeling — manual review of remittance advice at scale is simply not feasible, as a medium-sized hospital receives thousands of 835 transactions per week.
Leak #5: Slow Accounts Receivable — $139 Billion
The largest leak by dollar value is not money lost — it is money delayed. The $139 billion figure represents the excess cost of capital tied up in accounts receivable beyond industry benchmarks. When a hospital's days in A/R is 49 (the national average) instead of 35 (best-in-class), the working capital tied up in that 14-day gap has a real financial cost: interest on lines of credit, delayed capital investments, missed early-payment discounts from vendors.
The Root Cause
Slow A/R is the cumulative effect of all the other leaks. Eligibility errors cause rework. Coding errors cause denials. Denials require appeals. Underpayments require follow-up. Each touch point adds days to the revenue cycle. But there are also standalone drivers:
- Patient responsibility collections: With high-deductible health plans now covering 55% of employer-sponsored workers, patient out-of-pocket responsibility has grown to 30-35% of hospital revenue. Patient balances take 2-3x longer to collect than payer balances.
- Paper-based processes: Despite the rise of EDI, 15-20% of claims are still submitted on paper (CMS-1500 or UB-04), adding 7-14 days to the payment cycle.
- Secondary and tertiary billing: After the primary payer pays, the remaining balance must be billed to secondary insurance and then to the patient. Each billing cycle adds 30-45 days.
- Payer payment delays: Some payers systematically hold payments to the maximum allowed under the contract (typically 30-45 days for clean claims), earning float on the hospital's money.
The Integration Point
Reducing A/R days requires end-to-end revenue cycle visibility — a single data platform that connects scheduling, registration, clinical documentation, coding, charge capture, claim submission, remittance posting, denial management, and patient billing. The organizations with the best A/R performance have built or bought integrated data warehouses that track every claim from order entry to final payment, with automated alerts for claims that are aging beyond expected benchmarks.
The Automation Opportunity
Intelligent work queue prioritization — using ML models to determine which aging claims are most likely to be collectible and which require immediate attention — can reduce days in A/R by 5-10 days. Combined with automated patient payment plans, digital payment options, and real-time claim status tracking (276/277 transactions), best-in-class organizations are achieving 32-35 days in A/R, compared to the national average of 49.
The Integration Architecture That Closes These Leaks
Each of the five leak points requires different data, different integrations, and different automation. But they share a common architectural requirement: a real-time data integration layer that connects clinical, financial, and operational systems.
The Core Components
- Integration engine: Handles HL7 v2 messages from clinical systems, X12 EDI transactions from financial systems, and FHIR APIs from modern applications. Must support real-time streaming (not just batch). For teams evaluating options, our guide on healthcare integration architecture with Mirth and Kafka covers the technical patterns.
- Master data management: A single source of truth for patient identity, insurance coverage, provider credentials, and payer contracts. Without clean master data, every downstream automation produces garbage.
- Rules engine: Encodes payer-specific business rules for authorization, coding, billing, and payment. Must be updatable without code changes as payer rules change quarterly.
- Analytics platform: Real-time dashboards for key revenue cycle metrics (clean claim rate, denial rate, days in A/R, net collection rate) with drill-down to individual claims.
- Workflow automation: Robotic process automation (RPA) for repetitive tasks — claim status checking, payment posting, denial letter generation — combined with ML-powered prioritization for tasks that require human judgment.
The Data Standards
| Leak Point | Primary Standard | Transaction | Direction |
|---|---|---|---|
| Eligibility | X12 EDI | 270/271 | Hospital → Payer → Hospital |
| Coding | HL7/FHIR | Clinical docs + orders | EHR → Coding Engine |
| Claims | X12 EDI | 837P/837I | Hospital → Clearinghouse → Payer |
| Remittance | X12 EDI | 835 | Payer → Clearinghouse → Hospital |
| Claim Status | X12 EDI | 276/277 | Hospital → Payer → Hospital |
| Prior Auth | X12 EDI / FHIR | 278 / Da Vinci PAS | Hospital → Payer → Hospital |
Organizations building modern revenue cycle systems increasingly use FHIR alongside X12 EDI — particularly for prior authorization automation where the Da Vinci Prior Authorization Support (PAS) implementation guide provides a FHIR-native workflow. Understanding both HL7 and FHIR standards is essential for building a complete revenue cycle integration layer.
Measuring Progress: The KPIs That Matter
Revenue cycle leaders need to track specific metrics to know whether their integration and automation investments are working:
| KPI | National Average | Best-in-Class | Impact of 1% Improvement |
|---|---|---|---|
| Clean Claim Rate | 80-85% | 95%+ | $50K-$200K/year in reduced rework |
| Initial Denial Rate | 10-15% | 4-6% | $100K-$500K/year in recovered revenue |
| Days in A/R | 49 days | 32-35 days | $100K+ per day reduced (200-bed hospital) |
| Net Collection Rate | 95-96% | 98%+ | $500K-$5M/year depending on volume |
| Cost to Collect | 3.5-4.5% | 2.5-3.0% | $500K-$1M/year for a mid-size hospital |
From architecture to production, our Healthcare Software Product Development team builds healthcare platforms that perform at scale. We also offer specialized Agentic AI for Healthcare services.
Conclusion: Integration Is the Revenue Cycle Strategy
The $262 billion revenue leak is not a single problem — it is five interconnected problems that share a common root cause: fragmented data and disconnected systems. Clinical systems do not talk to financial systems. Financial systems do not talk to payer systems. Payer rules are not encoded in a computable format. And the patient — who sits at the center of all of this — is often the last to know about their financial responsibility.
The health systems that are closing these leaks are not doing it with one magic technology. They are building integrated data platforms that connect every touchpoint in the revenue cycle, applying automation where the ROI is clear, and maintaining human oversight where judgment is required. The technology exists. The standards exist. The question is whether your organization has the integration architecture to connect them.
If you are building revenue cycle automation or evaluating integration platforms for your health system, connect with our team. We help healthcare organizations architect and implement the integration layer that connects clinical, financial, and operational data — the foundation that every revenue cycle improvement depends on.