It is 2:47 AM. Your on-call phone is screaming. The hospital interface team has just discovered that lab results stopped flowing to the EHR three hours ago, and the Mirth Connect dashboard shows 47,328 messages stuck in the queued state. Every minute that passes, another 200 messages pile on. Clinicians are calling. A patient in the ED is waiting on a troponin result that was sent at 11:18 PM and never arrived.
SELECT channel_id, COUNT(*) FROM d_mm WHERE status='QUEUED' GROUP BY channel_id to scope it. Never restart the channel — halt the destination only, fix the root cause, then resume.This is the single most stressful failure mode in any HL7 interface engine. Unlike a hard crash, a queued-state pile-up is silent — the channel still appears green, the JVM is still running, ACKs are still being received on the inbound side. The pain is downstream, where the destination system is starving while your queue table balloons toward a wall you did not know existed.
We have walked into this fire dozens of times for hospital IT teams, HIE operators, and lab integrators. The pattern is always the same: panic, then guesswork, then random restarts that occasionally make things worse. This playbook replaces the panic with a 30-minute triage procedure, identifies the 12 root causes that account for over 95% of stuck-queue incidents, and gives you the exact SQL queries to run against the d_mm and d_mca tables to confirm each diagnosis before you touch a single channel.
Production down right now?
Skip the rest of this article. Call our Mirth incident response team — we will jump on a screen share, look at your channel XML, and have your queue draining within the hour. Free 30-minute diagnostic for any stuck-queue incident.
Why Mirth Queues Get Stuck (And Why Restart Is Usually the Wrong First Move)
Messages in Mirth's QUEUED state have been received, filtered, and transformed successfully — they just cannot reach the destination. The correct first move is not to restart the channel. Restart with a large queue risks duplicates, corrupts in-flight state, and triggers a retry storm. The correct first move is to halt the destination connector only, diagnose the root cause, and resume after fixing it.
Before we go through the 12 causes, you need to understand what "queued" actually means in Mirth Connect. The destination queue is a persistent, ordered buffer between your transformer output and your destination connector's send loop. Every message in QUEUED status has already been received, filtered, and transformed successfully — it just has not been handed off to the downstream system, or the hand-off failed, and the message is awaiting retry.
The queue itself is stored in the d_mm (message metadata) and d_mm_xxx content tables in your Mirth database. Connector-level state lives in d_mca (channel attachments and state). If you understand these two tables, you can diagnose 95% of stuck-message incidents in under five minutes — no log diving required.
The temptation when you see a stuck queue is to restart the channel. Resist it. Restarting a channel with 50,000 messages in the queue can do three bad things: (1) trigger a duplicate-send storm if the underlying issue resolves during restart, (2) corrupt the in-flight state of any messages currently being processed by the destination thread pool, and (3) hide the root cause so you face the same outage again in 12 hours. Always diagnose first, drain second, fix third, resume fourth. That is the entire playbook in one sentence.
The 12 Root Causes — A Field-Tested Diagnostic Guide
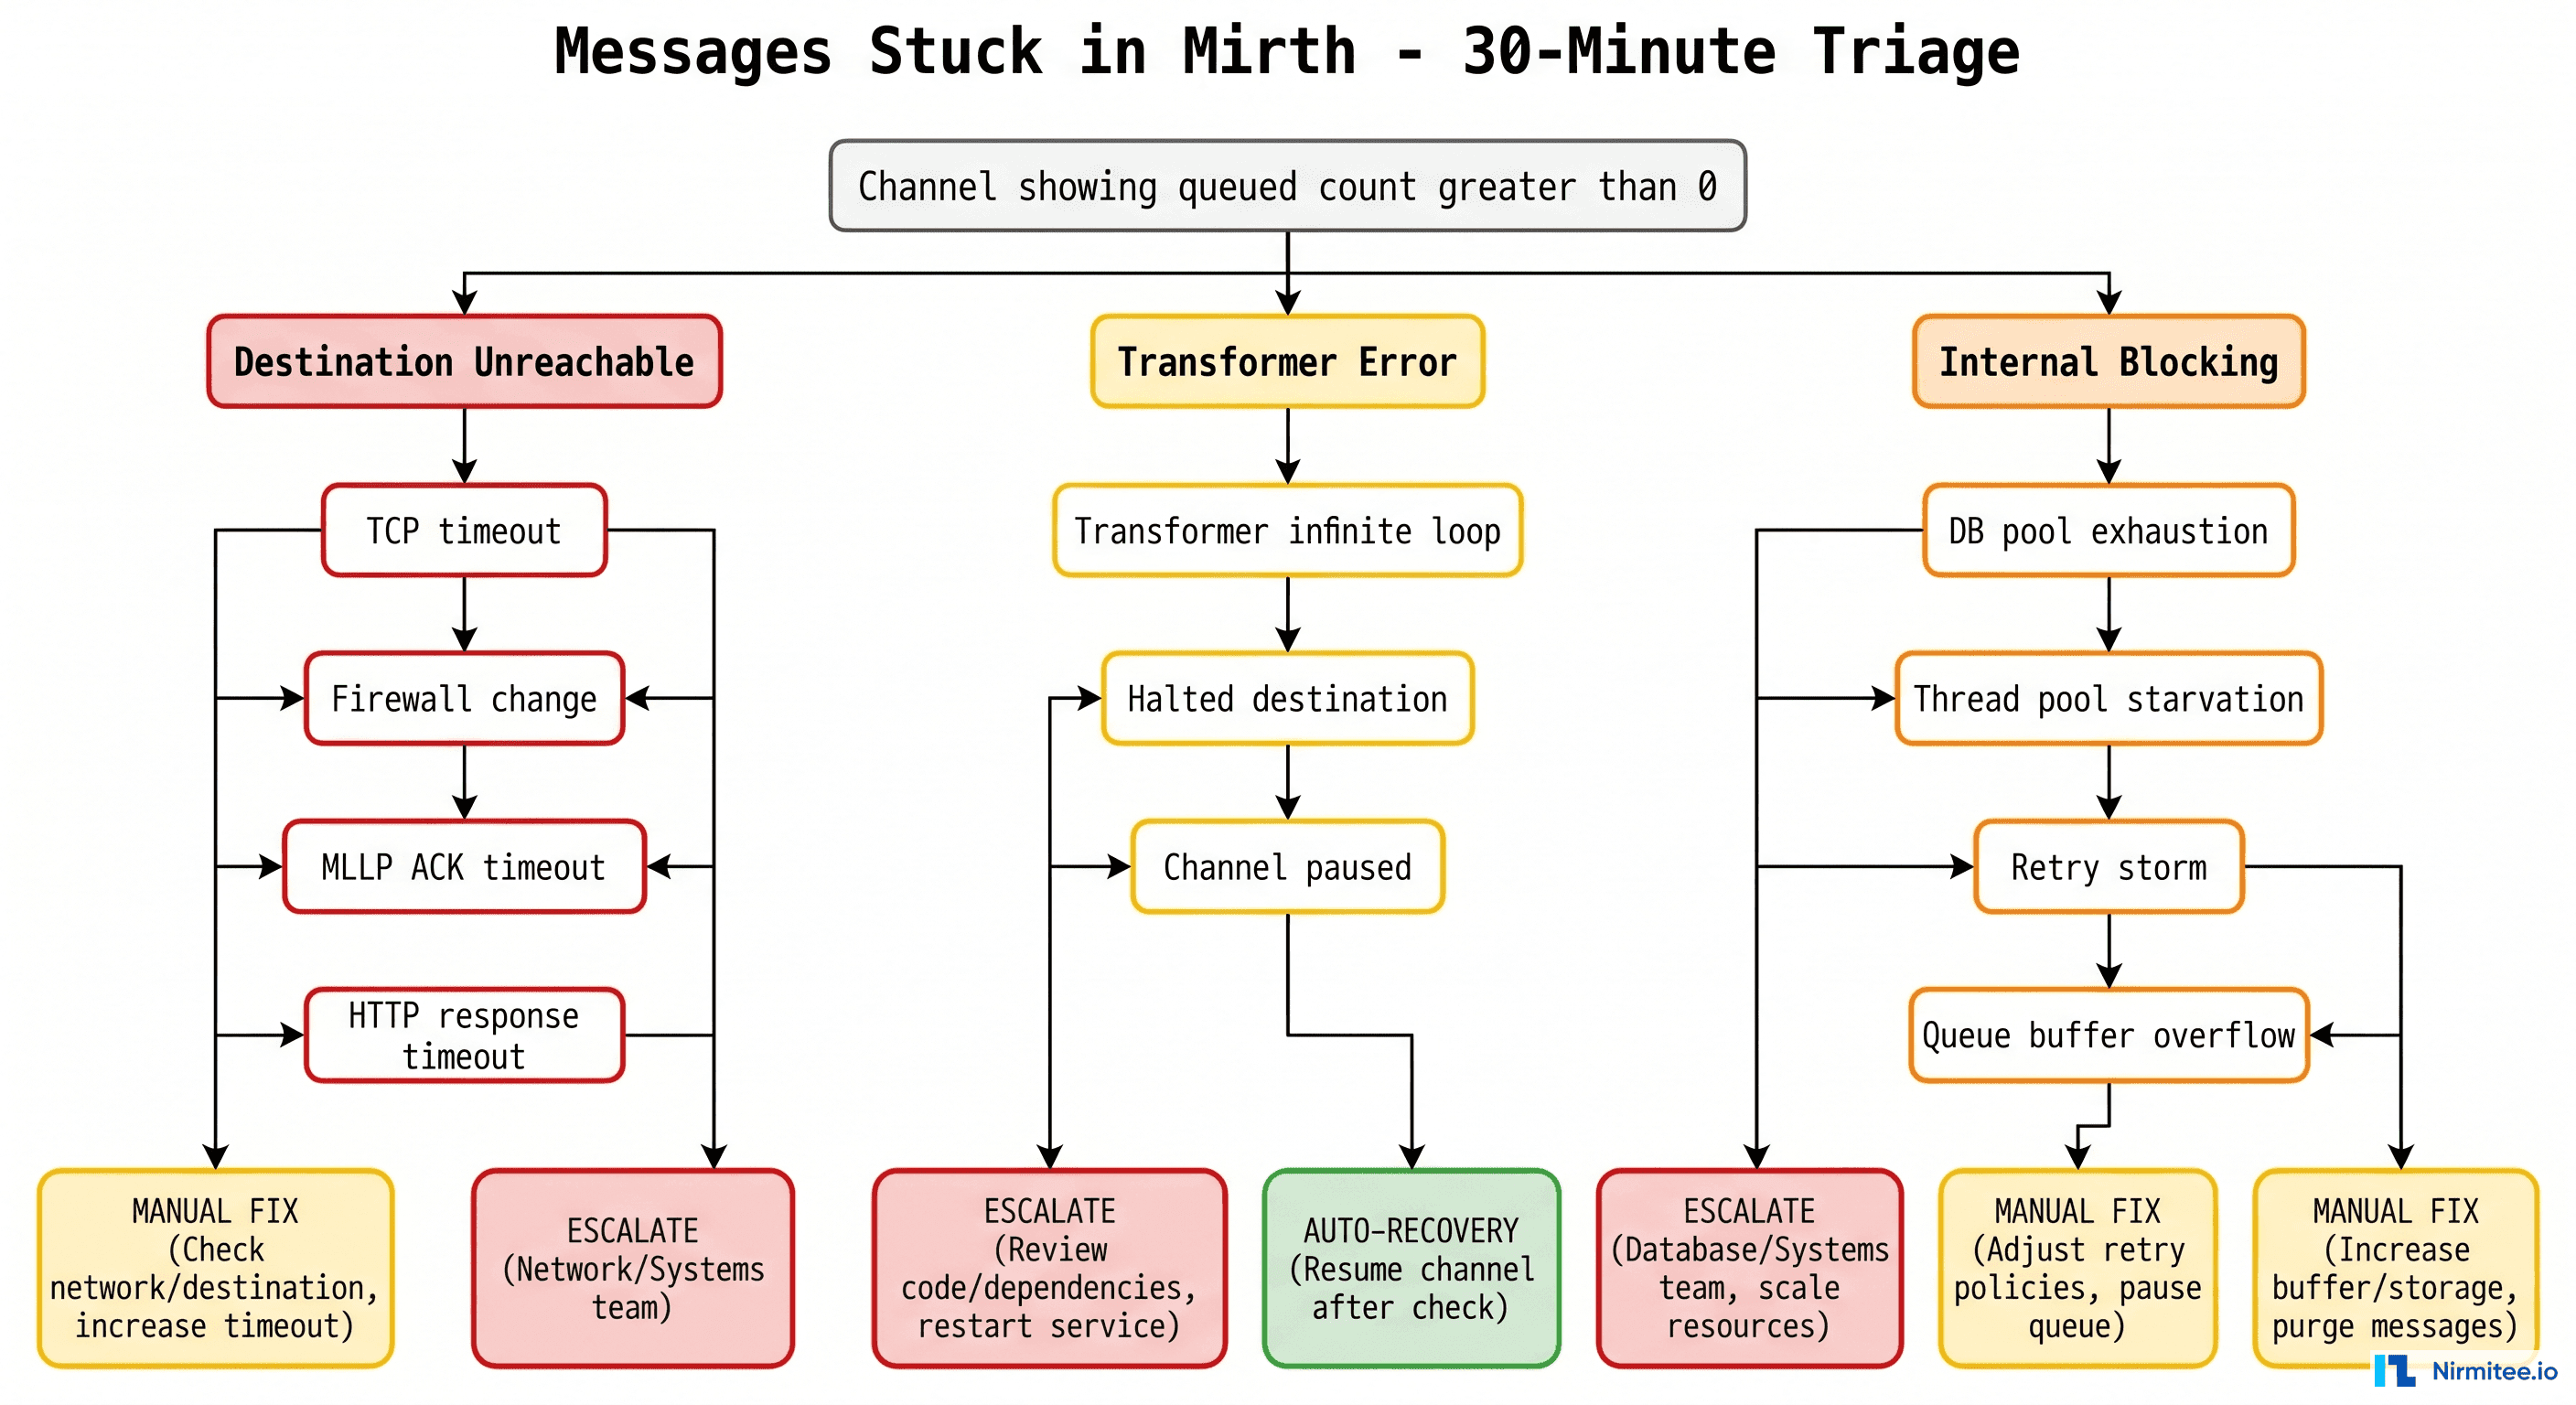
The 12 root causes of stuck Mirth queues fall into four categories: destination unreachable (TCP timeout, firewall block, SSL cert expired), connector state issues (halted manually, paused and forgotten, thread pool exhausted), database pressure (connection pool exhausted, disk full on mirthdb, slow query locking d_mm), and configuration errors (retry storm with no backoff, queue depth limit hit, wrong destination port/host). Each has a specific SQL or config diagnostic.
In ten years of running incident response on Mirth deployments — from 500-bed hospitals to national HIEs processing 4 million messages a day — we have catalogued the failure modes below. Each one has a distinct fingerprint in the dashboard and a verifiable SQL signature. Work through them in order; the most common causes appear first.
1. TCP Timeout on the Destination Endpoint
Symptoms: Queue count grows steadily by ~50-200 messages per minute. The destination connector still shows "Connected" or "Started" in green, but the "Sent" stat on the channel dashboard has been frozen for several minutes. No errors in the activity log because TCP timeouts only surface after the socket-level wait expires (often 60+ seconds).
SQL to confirm:
SELECT id, server_id, channel_id, send_attempts, error_code,
       (NOW() - received_date) AS age
FROM d_mm
WHERE channel_id = 'YOUR-CHANNEL-ID'
  AND status = 'QUEUED'
ORDER BY received_date ASC
LIMIT 20;
If send_attempts is climbing on the oldest messages but stuck at 1 or 2, and the age is measured in minutes not seconds, you are almost certainly looking at a destination timeout. Confirm at the network layer: telnet destination.hospital.org 6661 or nc -zv destination.hospital.org 6661. If the connection hangs, the destination is unreachable.
Recovery: Halt the destination connector (do not stop the channel). Once halted, fix the underlying network issue or contact the receiving team. Resume the destination — Mirth will replay the queue from the oldest message and resume normal operation.
2. Database Connection Pool Exhaustion
Symptoms: All channels slow down simultaneously. Queue counts grow across multiple unrelated destinations. The Mirth UI becomes sluggish. You may see "Could not obtain connection from pool" or "JDBCDataSourceUtil" errors intermittently in mirth.log.
SQL to confirm (run on the Mirth backing database):
SELECT count(*), state, wait_event
FROM pg_stat_activity
WHERE datname = 'mirthdb'
GROUP BY state, wait_event
ORDER BY count(*) DESC;
If you see dozens of connections in idle in transaction or ClientRead State, your pool is exhausted. The default Mirth pool size of 20 is wildly insufficient for any production workload above 500 msg/min.
Recovery: Increase the pool size in conf/mirth.properties — set database.max-connections=50 minimum, often 100+ for high-throughput environments. Restart Mirth (this is one of the rare cases where a JVM restart is necessary). For a deeper treatment, see our performance tuning guide for 10,000 messages per hour.
3. Destination Connector Blocked on a Single Slow Message
Symptoms: Only one channel's queue is growing, but the destination shows "Started" and "Connected". Other channels using the same destination type are fine. The connector appears alive but stats are frozen.
SQL to confirm:
SELECT m.id, m.received_date, m.send_attempts,
       c.state AS connector_state
FROM d_mm m
JOIN d_mca c ON c.channel_id = m.channel_id
WHERE m.status = 'QUEUED'
  AND m.channel_id = 'YOUR-CHANNEL-ID'
ORDER BY m.received_date ASC
LIMIT 5;
The smoking gun: the oldest queued message has been sitting for many minutes while the connector reports state = 'STARTED'. This usually means the destination thread is blocked inside a synchronous external call (HTTP, JDBC, SOAP) that has no timeout configured.
Recovery: Take a thread dump (kill -3 <mirth-pid> on Linux). Find the destination thread for this channel; you will see it parked in a socket read or JDBC call. The fix is configuration, not code: set an explicit response timeout on every HTTP Sender, JDBC Sender, and SOAP Sender connector. Never trust the platform defaults.
4. Transformer Infinite Loop or Runaway Script
Symptoms: CPU on the Mirth host spikes to one full core (or one core per problem channel). The queue grows because nothing is reaching the destination. Memory may climb if the script is allocating in a loop.
SQL to confirm:
SELECT channel_id, COUNT(*) AS queued
FROM d_mm
WHERE status = 'TRANSFORMED'
GROUP BY channel_id
ORDER BY queued DESC;
If messages are stacking up at status TRANSFORMED rather than QUEUED, the transformer itself is the bottleneck. Take a thread dump and look for the channel-XXX-Dispatcher thread — if you see your transformer JavaScript in the stack, you have a runaway script.
Recovery: Halt the channel. Open the transformer in the Administrator, look for a while, do-while, or recursive function that lacks a clean exit condition. Common culprits: parsing nested OBX repetitions with a non-terminating index, calling external APIs inside the transformer (always wrap with a hard timeout), or recursive XML traversal on a malformed message.
5. Halted Destination Connector (Often From a Prior Incident)
Symptoms: The connector icon shows the unmistakable yellow/orange "Halted" status. Messages accumulate in QUEUED status with no send attempts at all (send_attempts = 0).
SQL to confirm:
SELECT channel_id, server_id, metadata_id, state
FROM d_mca
WHERE state != 'STARTED';
Any row returned where state is 'HALTED', 'STOPPED', or 'PAUSED' is a halted connector still receiving messages from upstream. This commonly happens when an operator halts the destination to investigate an issue, gets distracted, and forgets to resume it.
Recovery: In the Administrator, right-click the destination and select Resume Connector. The queue will drain in the order messages were received. If the connector immediately re-halts, you have a deeper problem — proceed to causes 6 and 7.
6. IP, Hostname, or Firewall Change After a Deploy
Symptoms: The queue starts growing precisely after a network change, security review, or routine firewall rule push — even if nobody warned the integration team. You see "Connection refused" or "No route to host" in the logs.
SQL to confirm: This one is diagnosed at the OS layer, not the database:
netstat -an | grep ESTABLISHED | grep <destination-port>
tcpdump -i any host destination.hospital.org -c 10
If you see SYN packets going out but no SYN-ACK coming back, a firewall is silently dropping. If you see connection resets, a NAT or proxy has changed.
Recovery: Engage the network team. Confirm the destination IP/port is reachable from the Mirth host. Update the destination connector configuration if the endpoint truly moved. After fixing, halt and resume the destination — do not stop and start the channel, as that can cause message ordering issues in the queue.
7. HTTP Sender Response Timeout Too Aggressive (or Too Lax)
Symptoms: Intermittent stuck messages on HTTP-based destinations. The dashboard shows occasional ERROR messages with SocketTimeoutException. Queue oscillates — grows, shrinks, grows again — as retries succeed and fail.
SQL to confirm:
SELECT id, error_code, send_attempts,
       SUBSTRING(content_type FROM 1 FOR 40) AS err
FROM d_mm
WHERE channel_id = 'YOUR-CHANNEL-ID'
  AND status IN ('ERROR', 'QUEUED')
  AND error_code IS NOT NULL
ORDER BY received_date DESC
LIMIT 20;
If you see 504 Gateway Timeout or java.net.SocketTimeoutException patterns, your HTTP timeout is too short for the destination's actual latency. Conversely, if it is set to 5+ minutes with no retry cap, a single slow response can block thousands of messages.
Recovery: Tune Response Timeout and Socket Timeout on the HTTP Sender. A good starting point for FHIR submissions is 30 seconds; for slow on-prem destinations, 60-120 seconds with capped retries. Always pair a long timeout with a circuit breaker pattern in your channel logic — see our writeup on the top 10 Mirth integration failures.
8. MLLP ACK Timeout on the Receiver Side
Symptoms: Queue grows on a TCP/MLLP destination. The receiver claims they are processing messages fine. The Mirth logs show "ACK timeout" or "No response from destination" with the standard MLLP 30-second wait expiring.
SQL to confirm:
SELECT id, send_attempts, error_code
FROM d_mm
WHERE channel_id = 'YOUR-CHANNEL-ID'
  AND status = 'QUEUED'
  AND error_code LIKE '%ACK%'
LIMIT 10;
This one is subtle: the receiver may be writing the message to disk successfully but failing to send the AA (Application Accept) ACK back in time. Mirth, seeing no ACK within the configured window, marks the send as failed and retries — creating duplicates downstream.
Recovery: First, ask the receiving team to confirm their ACK timing. Increase the ACK timeout on the MLLP Sender to match their actual response time (typically 60s for safety). For high-volume channels, consider switching to Asynchronous ACK mode if the receiver supports it.
9. Channel Paused (Not Stopped)
Symptoms: An operator paused the channel during a maintenance window and forgot to resume it. Source still accepts and queues messages, but no destination processing happens. Looks like a stuck queue, is actually a paused channel.
SQL to confirm:
SELECT channel_id, server_id, state
FROM d_channel
WHERE state = 'PAUSED';
Recovery: Resume the channel from the Administrator. The queue will drain immediately. To prevent this in production, never use Pause — use Halt or Stop, and document the action in your change management system. Better yet, configure alerting on any channel that has been in a non-STARTED state for more than 5 minutes.
10. Retry Storm (Self-Inflicted DoS)
Symptoms: Queue counts oscillate wildly. send_attempts on individual messages climbs into the hundreds. The destination team complains about a thundering herd of identical messages every few minutes. CPU on the Mirth host is high.
SQL to confirm:
SELECT message_id, send_attempts, last_attempt
FROM d_mcm
WHERE send_attempts > 50
ORDER BY send_attempts DESC
LIMIT 20;
If you see send_attempts in the triple digits, your channel is in a retry death spiral. This usually combines with cause #1 or #7 — the destination is unreachable AND your retry configuration is unbounded.
Recovery: Halt the destination immediately to stop the retry storm. Edit the destination's Queue settings: cap "Retry Count" at a sane value (typically 5-10), enable exponential backoff if available, and consider routing repeatedly-failing messages to a dead-letter channel for manual review. Never run a destination with unlimited retries and zero backoff in production.
11. Queue Buffer Overflow (Memory Pressure)
Symptoms: JVM memory usage climbs steadily. You see OutOfMemoryError warnings in mirth.log. Eventually, the JVM either crashes or enters a GC death spiral where every operation takes seconds.
SQL to confirm: Check JVM metrics rather than SQL. From a shell:
jstat -gc <mirth-pid> 1000 5
# Look at OU (old gen used) approaching OC (old gen capacity)
If old generation is at 95%+ and full GCs are running every few seconds, you are out of heap. The queue itself does not live in the heap (it lives in the database), but the in-flight message representations do.
Recovery: Edit mcservice.vmoptions (Linux) or the equivalent Windows service config. Increase -Xmx from the default 1g to at least 4g, often 8g+ for high-volume deployments. Restart Mirth. Long-term, follow our high availability setup guide to keep heap usage under control.
12. Thread Pool Starvation
Symptoms: All channels slow down. The Mirth Administrator becomes unresponsive. CPU usage on the host is moderate, but throughput is near zero across the board.
SQL to confirm: Thread dump analysis, not SQL:
jstack <mirth-pid> > /tmp/mirth-threaddump.txt
grep "Mirth-Destination" /tmp/mirth-threaddump.txt | wc -l
grep "BLOCKED" /tmp/mirth-threaddump.txt | wc -l
If you have hundreds of BLOCKED threads, you have lock contention — most often on the database connection pool, sometimes on a shared resource inside a transformer.
Recovery: This is rarely a quick fix. Short-term: increase the destination thread pool size in the channel's Advanced settings, and increase the database connection pool size to match. Long-term: refactor any transformers that hold long-running locks, switch shared state to channel-level rather than global variables, and consider the architecture in our Mirth + Kafka guide for true horizontal scale.
The SQL Diagnostic Toolkit
The five SQL queries that diagnose 90% of Mirth queue incidents: (1) count queued messages by channel on d_mm, (2) find oldest stuck message timestamp, (3) check connector state on d_mca, (4) count retry attempts to identify retry storms, and (5) check database connection pool saturation on pg_stat_activity. Run these in order before touching any channel configuration.
If you remember nothing else from this playbook, remember the six queries below. They will diagnose 95% of stuck-queue incidents in under five minutes — no Administrator UI required, which matters when the Administrator itself is unresponsive due to JVM pressure.
Query 1 — Count queued messages by channel
SELECT channel_id, COUNT(*) AS queued_count,
       MIN(received_date) AS oldest_message,
       MAX(received_date) AS newest_message
FROM d_mm
WHERE status = 'QUEUED'
GROUP BY channel_id
ORDER BY queued_count DESC;
Query 2 — Find the oldest stuck messages
SELECT id, channel_id, received_date, send_attempts,
       (EXTRACT(EPOCH FROM (NOW() - received_date)) / 60)::int AS age_minutes
FROM d_mm
WHERE status = 'QUEUED'
ORDER BY received_date ASC
LIMIT 25;
Query 3 — Check every connector's current state
SELECT channel_id, server_id, metadata_id, state
FROM d_mca
WHERE state != 'STARTED'
ORDER BY channel_id;
Query 4 — Identify a retry storm
SELECT message_id, send_attempts, error_code
FROM d_mcm
WHERE send_attempts > 10
ORDER BY send_attempts DESC
LIMIT 20;
Query 5 — Database lock detection
SELECT pid, usename, state, wait_event_type, wait_event,
       query_start, LEFT(query, 80) AS query_snippet
FROM pg_stat_activity
WHERE datname = 'mirthdb' AND state != 'idle'
ORDER BY query_start ASC;
Query 6 — Find blocking transactions
SELECT blocked.pid AS blocked_pid,
       blocked_activity.usename AS blocked_user,
       blocking.pid AS blocking_pid,
       blocking_activity.usename AS blocking_user,
       blocked_activity.query AS blocked_query
FROM pg_catalog.pg_locks blocked
JOIN pg_catalog.pg_stat_activity blocked_activity
  ON blocked.pid = blocked_activity.pid
JOIN pg_catalog.pg_locks blocking
  ON blocking.locktype = blocked.locktype
  AND blocking.granted = true
JOIN pg_catalog.pg_stat_activity blocking_activity
  ON blocking.pid = blocking_activity.pid
WHERE blocked.granted = false;
Save these as scripts in your runbook directory. We keep ours in /opt/mirth-runbook/queries/ with one-line shell wrappers, so the on-call engineer can run them by name during an incident.
The 30-Minute Recovery Playbook
The 30-minute Mirth queue recovery runs in four phases: Phase 1 (0–5 min) — identify scope with SQL, capture oldest message timestamp, check connector state; Phase 2 (5–15 min) — halt affected destination connectors, back up mirthdb, halt upstream feeders if queue is growing; Phase 3 (15–25 min) — match symptoms to root cause table, apply fix, test on one channel; Phase 4 (25–30 min) — resume destination, watch drain rate, verify ACKs.
This is the exact procedure our incident response team runs every time. It is deliberately structured into four phases of roughly equal length, with explicit exit criteria for each phase. Skipping phases or jumping ahead is how you turn a 30-minute incident into a 4-hour incident.
Phase 1: Identify (0-5 minutes)
- Confirm the scope. Run Query 1. Is it one channel, or every channel? One channel means a localized cause (destination, transformer, configuration). Every channel means an infrastructure issue (database, JVM, network).
- Capture the timestamp of the first stuck message. Run Query 2. The age of the oldest message tells you exactly when the incident started — match this against your change log.
- Check connector state. Run Query 3. If anything is HALTED or PAUSED, your fix may be a 10-second resume.
- Note retry counts. Run Query 4. High retry counts mean an active retry storm — you need to halt before doing anything else.
Phase 2: Drain & Isolate (5-15 minutes)
- Halt the affected destination(s). Not Stop. Halt. This stops outbound attempts while preserving the queue.
- Halt upstream feeders if needed. If the source channels are continuing to pile messages onto the queue, halt them at the source — better to back-pressure the upstream system than to bury your queue table.
- Backup mirthdb. Before any database-level intervention, take a fresh dump:
pg_dump mirthdb > /tmp/mirth-incident-$(date +%s).sql. This is your rollback insurance. - Pull the relevant logs.
tail -10000 /opt/mirth/logs/mirth.logand grep for the affected channel ID and ERROR/WARN entries.
Phase 3: Fix Root Cause (15-25 minutes)
- Map symptoms to causes. Use the 12-cause table above. In 80% of incidents, the cause is one of: destination unreachable (cause 1 or 6), pool exhaustion (cause 2), or a retry storm (cause 10).
- Apply the fix. Configuration changes go through your normal change process even in an incident — but mark them as emergency changes. Never edit production channels without saving the prior version of the XML.
- Test the fix where possible. If you have a staging environment, deploy there first. If not, test on a single channel before rolling out to all affected channels.
- Optionally clear definitively dead messages. If you have confirmed that messages are bad data (wrong format, dropped patient, etc.), you can mark them as ERROR with a manual SQL update. But this is rare — most "stuck" messages are recoverable.
Phase 4: Resume & Verify (25-30 minutes)
- Resume the destination connector. Watch the dashboard for 60 seconds. Send rate should jump immediately.
- Monitor queue drain rate. Run Query 1 every minute. Queue count should drop steadily. If it does not, halt again and return to Phase 3.
- Verify ACKs at the receiver. Coordinate with the receiving team — they should see messages arriving in their inbox with correct content.
- Confirm no new stuck messages. After 5 minutes of drain, the queue count should be at or near zero. New incoming messages should flow through within seconds.
When to Call for Help
The 30-minute playbook works for the common cases. There are five situations where you should escalate immediately rather than continue troubleshooting:
- Patient safety is impacted. If clinicians cannot see results, and a delay translates directly to a clinical decision, escalate to your CIO and hospital command center. Do not stay heads-down on the technical fix.
- The queue is over 100,000 messages. At this scale, drain time becomes its own problem (often hours), and you need to consider parallel restart strategies, message replay tooling, or temporary destination scaling.
- The Mirth JVM is unresponsive. If you cannot even reach the Administrator and SQL queries on
mirthdbTime out, you are looking at a deeper infrastructure issue. - Multiple destinations are failing simultaneously. A coordinated failure across unrelated destinations is almost always a network, DNS, or certificate issue — not a Mirth problem.
- You have applied the obvious fix, and the queue is still growing. Two failed fixes are your signal to bring in a second pair of eyes. Stuck-queue incidents compound; the longer they run, the harder they are to clean up.
If you are in any of these situations right now, our incident response team has handled hundreds of healthcare interoperability production fires.
Preventing the Next Stuck-Queue Incident
The five configuration changes that prevent most stuck-queue incidents: cap retry count at 5–10 with exponential backoff (prevents retry storms), configure destination timeouts at 30 seconds max (prevents thread pile-up), set queue depth alerts at 1,000 messages (catches growth before it becomes an outage), add a dead-letter channel for exhausted messages (nothing silently dropped), and enable synthetic heartbeat monitoring every 5 minutes per channel.
Every stuck-queue incident is an opportunity to harden your environment. Three controls eliminate roughly 90% of future incidents:
1. Alert on queue depth, not just channel state. A channel can be green and still failing. Add a Prometheus alert (or whatever monitoring you use) on SELECT COUNT(*) FROM d_mm WHERE status='QUEUED' AND channel_id=X with thresholds at 100 (warn) and 1000 (page). See our guide on production Mirth monitoring for the full alerting setup.
2. Cap retries on every destination. The Mirth defaults are dangerous in production. Set explicit retry counts (5-10 typical), exponential backoff, and a dead-letter routing strategy for messages that exhaust retries.
3. Run a monthly resilience drill. Pick a non-production channel. Halt the destination. Watch the queue. Resume. Time the drain. This is the only way to know your runbook works before you need it at 2:47 AM.
For teams running mission-critical EHR integration on Mirth, we recommend pairing these controls with the architectural patterns in our robust HL7 interface engine guide. Resilience is a property of the system as a whole, not a single channel.
Free 30-Minute Channel Diagnostic
Send us your channel XML — we will tell you exactly why it is stuck.
Our Mirth incident response engineers have triaged hundreds of stuck-queue incidents at hospitals, HIEs, and lab networks. Send us:
Your channel XML export (sanitized of PHI)
The output of Query 1 and Query 2 from this article
A screenshot of your channel dashboard
In 30 minutes, we will diagnose the root cause and give you the exact configuration changes needed. No sales pitch. No commitment. Just a real engineer on a real call.
Need ongoing expert help with your Mirth deployment? Our Healthcare Interoperability Solutions team operates production Mirth Connect environments for hospital systems and HIEs across the US, the Middle East, and APAC.
We also offer Healthcare Software Product Development for organizations migrating away from Mirth to commercial or open-source alternatives. Talk to our team to get started.


