What Reliable Mirth Connect Monitoring Looks Like in Production

CTO & Co-Founder
CTO & Co-Founder at Nirmitee.io. Architects healthcare integrations across FHIR, SMART on FHIR, ABDM and NHCX, writing from production experience taking hospital software from sandbox to go-live.
Part of our complete guide to Mirth Connect - Complete Guide for Healthcare Leaders.
When a Mirth Connect channel goes silent, lab results stop flowing. ADT messages queue up. Medication orders stall. In healthcare integration, monitoring is not an operations concern — it is a patient safety concern. A missed critical lab result because an interface was down for 45 minutes can directly harm patients.
Yet most Mirth deployments rely on the built-in dashboard and email alerts — tools designed for development, not production. This guide covers what reliable Mirth monitoring looks like when clinical data flows depend on it: the metrics that matter, the tools that work, alerting rules that wake you up for real problems (and only real problems), and the on-call runbooks your team needs.
The Six Metrics That Matter
Mirth Connect exposes dozens of metrics, but only six directly correlate with interface reliability and clinical impact.
| Metric | What It Measures | Why It Matters | Healthy Range |
|---|---|---|---|
| Channel throughput (msgs/min) | Rate of successfully processed messages per channel | A drop in throughput means the source system stopped sending, or Mirth stopped processing | Within 20% of the 7-day average for the time of day |
| Error rate (%) | Percentage of messages that fail transformation or delivery | Failed messages mean missing clinical data in downstream systems | Below 0.1% sustained |
| Queue depth | Number of messages waiting to be processed | A growing queue means Mirth cannot keep up with the incoming volume | Below 50 messages (sustained) |
| End-to-end latency (P99) | Time from message receipt to successful delivery | High latency delays clinical data availability | Below 500ms for HL7v2, below 2s for FHIR transforms |
| Channel status | Whether each channel is started, stopped, or errored | A stopped channel means zero data flow for that interface | All production channels started |
| JVM memory utilization | Java heap usage as a percentage of allocated maximum | Memory pressure causes GC pauses that spike latency and can crash Mirth | Below 75% of the max heap |
Metric 1: Channel Throughput
Throughput is your primary indicator of system health. Each channel has a predictable throughput pattern based on clinical activity — ADT channels peak during morning admissions and evening discharges, lab channels spike mid-morning as overnight test results post, and pharmacy channels are steady throughout the day.
The alert should fire when throughput drops below 50% of the expected rate for the current time window. A flat zero throughput is obvious, but a gradual decline from 200 msgs/min to 80 msgs/min often indicates a source system performance issue that will become a full outage if not addressed.
Metric 2: Error Rate
Mirth categorizes errors into three types that require different responses:
- Transformer errors — The message was received, but the JavaScript transformer failed. Common causes: unexpected message format, null pointer on optional fields, and character encoding issues. Fix: update transformer with defensive null checks.
- Destination errors — The message was transformed, but delivery failed. Common causes: destination system down, authentication expired, network partition. Fix: check destination connectivity.
- Filter errors — The message was filtered out by channel rules. These are expected and should not count toward the error rate. Ensure your monitoring excludes filtered messages from error calculations.
Metric 3: Queue Depth
Mirth's internal queue stores messages between receipt and processing. A growing queue means processing cannot keep up with the incoming rate. For channels using Kafka destinations, the Kafka consumer lag is the equivalent metric.
Monitoring Stack: What to Deploy
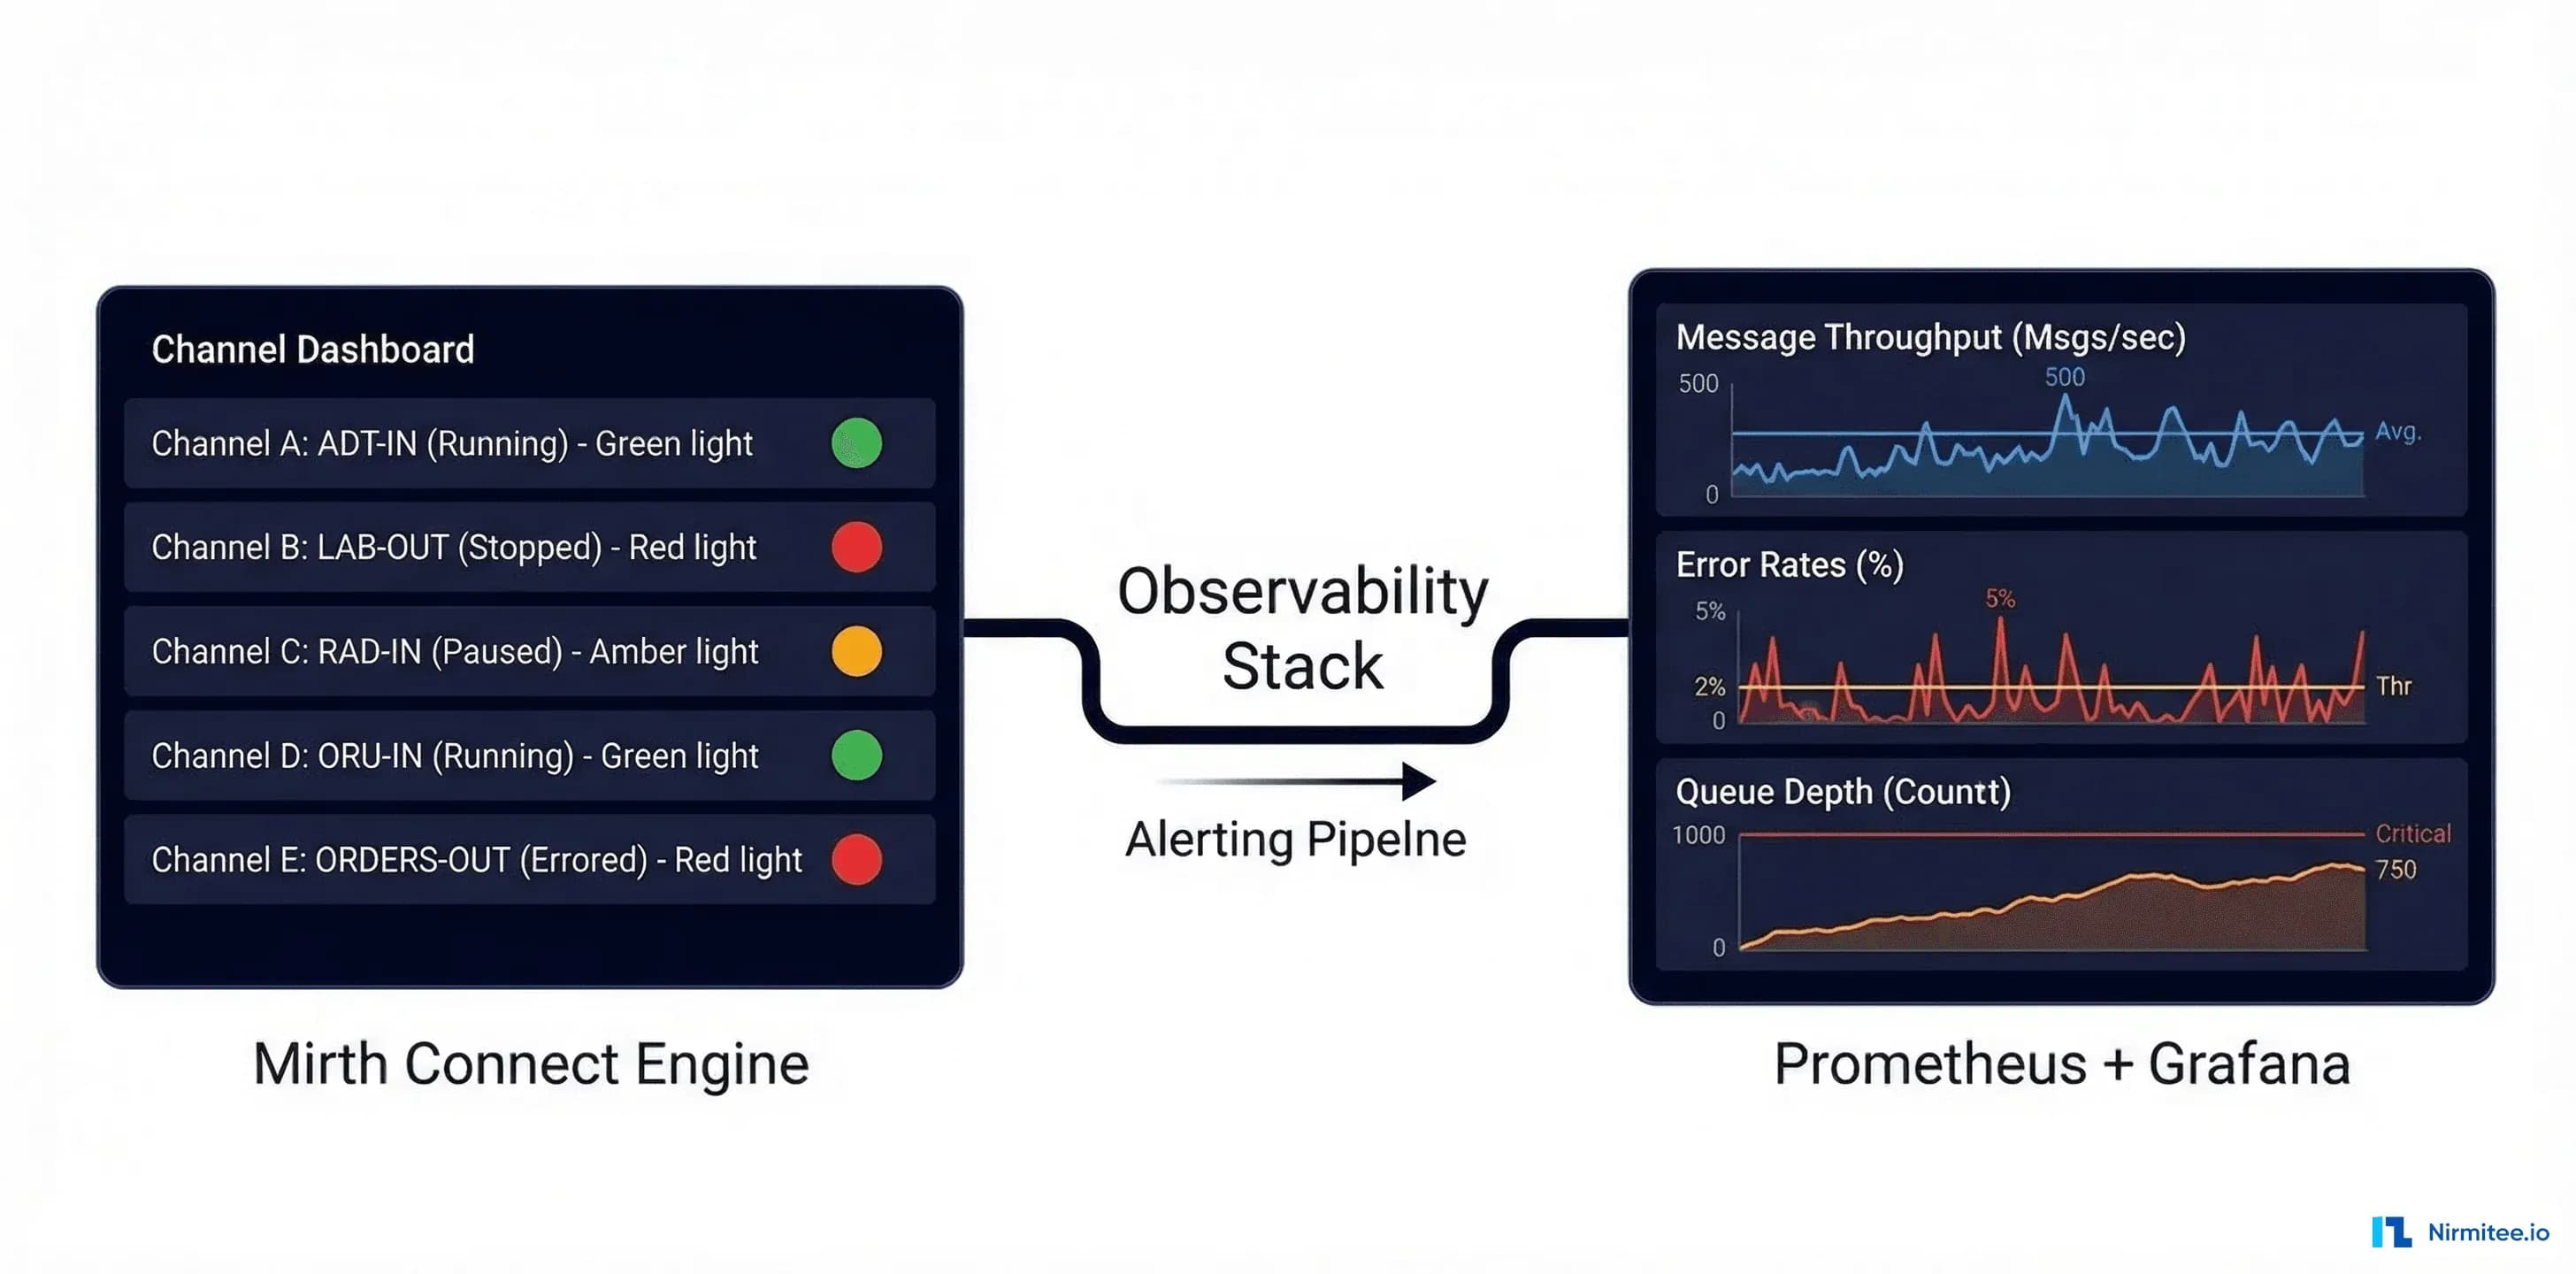
Option 1: Prometheus + Grafana (Recommended)
This is the standard open-source monitoring stack and the best choice for most healthcare integration deployments.
# prometheus.yml - Mirth Connect scrape configuration
global:
  scrape_interval: 15s
  evaluation_interval: 15s

scrape_configs:
  - job_name: "mirth-connect"
    metrics_path: "/api/metrics"
    scheme: https
    tls_config:
      insecure_skip_verify: true
    basic_auth:
      username: admin
      password_file: /etc/prometheus/mirth-password
    static_configs:
      - targets:
          - "mirth-node-1:8443"
          - "mirth-node-2:8443"
        labels:
          environment: production
          service: healthcare-integration

  - job_name: "mirth-jvm"
    metrics_path: "/actuator/prometheus"
    static_configs:
      - targets: ["mirth-node-1:9090", "mirth-node-2:9090"]
Mirth does not natively expose Prometheus metrics. You need the Mirth Prometheus Exporter — a custom plugin or sidecar that reads Mirth's JMX MBeans and translates them to Prometheus format.
// MirthMetricsExporter.java - Key JMX MBeans to expose
// Channel-level metrics
"com.mirth.connect:type=Channel,name={channelName}" -> {
    "mirth_channel_received_total"        // Counter: total messages received
    "mirth_channel_sent_total"            // Counter: total messages sent successfully
    "mirth_channel_error_total"           // Counter: total messages errored
    "mirth_channel_filtered_total"        // Counter: total messages filtered
    "mirth_channel_queued"                // Gauge: current queue depth
    "mirth_channel_status"                // Gauge: 1=started, 0=stopped
}

// Server-level metrics
"com.mirth.connect:type=Server" -> {
    "mirth_server_uptime_seconds"         // Counter: seconds since last restart
    "mirth_server_channels_deployed"      // Gauge: number of deployed channels
    "mirth_server_channels_started"       // Gauge: number of started channels
}

// JVM metrics (via JMX)
"java.lang:type=Memory" -> {
    "mirth_jvm_heap_used_bytes"           // Gauge: current heap usage
    "mirth_jvm_heap_max_bytes"            // Gauge: maximum heap size
    "mirth_jvm_gc_pause_seconds"          // Histogram: GC pause duration
}
Option 2: Datadog
For teams that prefer managed monitoring, Datadog offers a custom integration for Mirth via JMX. The setup is simpler but comes with per-host pricing ($15-$23/host/month for infrastructure monitoring plus $2/GB for log management).
Option 3: OpenTelemetry + Jaeger
For microservices architectures where Mirth is one component in a larger integration pipeline, OpenTelemetry provides distributed tracing that follows a message from source through Mirth to all downstream consumers. This is especially valuable when Mirth produces to Kafka and multiple consumers process the message.
Alerting Rules: Wake Up for the Right Reasons
Alert fatigue kills monitoring programs. If your team receives 50 alerts per day, they stop looking at them. Design alerts with three severity levels:
| Severity | Criteria | Notification | Response Time |
|---|---|---|---|
| P1 Critical | Channel down > 5 min, error rate > 5%, queue > 1000 | PagerDuty page (phone call) | Immediate (within 15 min) |
| P2 Warning | Throughput 50% below baseline, error rate > 0.5%, queue > 200 | Slack channel + PagerDuty notification | Within 1 hour |
| P3 Info | Error rate > 0.1%, queue > 50, JVM memory > 70% | Slack channel only | Next business day |
Prometheus Alerting Rules
# mirth-alerts.yml
groups:
  - name: mirth-critical
    rules:
      - alert: MirthChannelDown
        expr: mirth_channel_status == 0
        for: 5m
        labels:
          severity: critical
        annotations:
          summary: "Mirth channel {{ $labels.channel_name }} is down"
          description: "Channel has been stopped for 5+ minutes. Clinical data flow interrupted."
          runbook_url: "https://wiki.internal/runbooks/mirth-channel-down"

      - alert: MirthHighErrorRate
        expr: rate(mirth_channel_error_total[5m]) / rate(mirth_channel_received_total[5m]) > 0.05
        for: 3m
        labels:
          severity: critical
        annotations:
          summary: "Mirth channel {{ $labels.channel_name }} error rate > 5%"
          description: "{{ $value | humanizePercentage }} of messages are failing."

      - alert: MirthQueueBacklog
        expr: mirth_channel_queued > 1000
        for: 5m
        labels:
          severity: critical
        annotations:
          summary: "Mirth queue depth > 1000 on {{ $labels.channel_name }}"

  - name: mirth-warnings
    rules:
      - alert: MirthThroughputDrop
        expr: >
          mirth_channel_received_total
          < 0.5 * avg_over_time(mirth_channel_received_total[7d])
        for: 15m
        labels:
          severity: warning
        annotations:
          summary: "Throughput 50%+ below 7-day average on {{ $labels.channel_name }}"

      - alert: MirthJVMMemoryHigh
        expr: mirth_jvm_heap_used_bytes / mirth_jvm_heap_max_bytes > 0.85
        for: 10m
        labels:
          severity: warning
        annotations:
          summary: "Mirth JVM heap usage > 85%"
Grafana Dashboard: What to Display
A well-designed Mirth monitoring dashboard has four sections:
- System overview panel — Total throughput, aggregate error rate, system uptime, and active channel count. This gives the on-call engineer a 2-second health assessment.
- Per-channel detail table — Sortable table with every production channel: name, status, throughput, error count, queue depth, and last message timestamp. Sort by error count to surface problem channels.
- Time-series graphs — Throughput and latency over time for each channel. Include 7-day comparison overlays to spot anomalies against typical patterns.
- Infrastructure metrics — JVM heap, GC pauses, CPU utilization, database connection pool usage, and disk space. These catch infrastructure problems before they cascade to message processing.
On-Call Runbook: What to Do When the Alert Fires
Runbook 1: Channel Down
- Verify the alert — Check the Mirth Administrator dashboard. Confirm the channel is actually stopped (not a false positive from a metric scrape failure).
- Check the channel error log — Open the channel's message browser and filter by "Error" status. The most recent error message reveals why the channel stopped.
- Common causes and fixes:
- Destination unreachable — The downstream system is down, or a network route has changed. Verify with
telnet destination-host port. Restart the channel once connectivity is confirmed. - Out of memory — A large message exceeded the available heap. Check JVM heap usage. If needed, increase
-Xmxand restart Mirth. Review the channel's max batch size setting. - Database connection pool exhausted — Mirth's PostgreSQL connection pool is full. Check
pg_stat_activityfor long-running queries. Restart the channel and investigate the slow query. - TLS certificate expired — Check the certificate expiration on the destination. Update the Mirth keystore. Implement certificate expiration monitoring (alert 30 days before expiry).
Runbook 2: High Error Rate
- Sample recent errors — Pull 10 recent error messages from the channel. Categorize: are they all the same error type or different?
- Same error type — Likely a data format change from the source system. Check if the source system has had a recent upgrade. Update the transformer to handle the new format.
- Mixed error types — Likely an infrastructure issue. Check database connectivity, JVM memory, and network stability.
- Reprocess from error queue — After fixing the root cause, reprocess errored messages from Mirth's error queue. Verify each reprocessed message reaches the destination.
Runbook 3: Performance Degradation
- Check JVM heap — If usage is above 85%, a full GC is likely causing pauses. Increase the heap or investigate memory leaks.
- Check database performance — Run
EXPLAIN ANALYZEon slow Mirth queries. Common culprit: message table growing without pruning. Configure the Data Pruner to run nightly. - Check the thread pool — If all processing threads are busy, increase "Maximum Processing Threads" on bottleneck channels. Monitor CPU to ensure you are not oversubscribing.
- Check destination latency — If a destination system is responding slowly, messages back up. Contact the destination system team and consider implementing circuit-breaker patterns.
Database Monitoring: The Hidden Bottleneck
Mirth stores all message data in its PostgreSQL (or MySQL) database. As message volume grows, the database becomes the most common performance bottleneck. Key queries to monitor:
-- Check message table size (should be pruned regularly)
SELECT pg_size_pretty(pg_total_relation_size('d_m1'))
    AS message_table_size;

-- Check for long-running queries (potential locks)
SELECT pid, now() - pg_stat_activity.query_start AS duration,
       query, state
FROM pg_stat_activity
WHERE (now() - pg_stat_activity.query_start) > interval '5 minutes'
ORDER BY duration DESC;

-- Check connection pool usage
SELECT count(*) AS active_connections,
       max_conn AS max_connections,
       count(*) * 100.0 / max_conn AS utilization_pct
FROM pg_stat_activity,
     (SELECT setting::int AS max_conn FROM pg_settings WHERE name = 'max_connections') mc
GROUP BY max_conn;

-- Check index health (missing indexes cause slow channel queries)
SELECT schemaname, tablename, indexname, idx_scan
FROM pg_stat_user_indexes
WHERE idx_scan = 0 AND schemaname = 'public'
ORDER BY pg_relation_size(indexrelid) DESC;
Scaling Monitoring for Multi-Node Mirth Deployments
For high-availability Mirth deployments, monitoring must cover all nodes and the load balancer:
- Per-node metrics — Each Mirth node reports its own throughput, error rate, and JVM metrics. Aggregate across nodes for total system health.
- Load balancer health checks — Monitor the health check endpoint on each node. If a node fails health checks, the load balancer removes it from rotation — your monitoring should detect this.
- Database replication lag — In a primary-replica PostgreSQL setup, monitor replication lag. If the replica falls behind, reporting queries on the replica return stale data.
- Cross-node message correlation — Use unique message IDs to trace a message across nodes. OpenTelemetry distributed tracing makes this straightforward.
Build Reliable Mirth Monitoring with Nirmitee
At Nirmitee, we design and deploy production monitoring for healthcare integration platforms. From Mirth Connect deployments to Mirth + Kafka architectures, our team builds monitoring that catches issues before they impact clinical workflows.
Related guides
This article is part of our complete guide to Mirth Connect: Mirth Connect overview for health systems. Related deep-dives:
- Mirth Connect integration failures
- tuning Mirth Connect throughput
- alerting for FHIR, Mirth and EHR integrations
- Mirth Connect Security 2026 : Complete Guide
Need production-grade Mirth Connect help? See our Mirth Connect integration services.
Ready to scale?
Talk to our healthcare engineering team about building, integrating, and shipping faster.
Frequently Asked Questions
What metrics matter most when monitoring Mirth Connect?
What monitoring stack works best with Mirth Connect?
Why doesn’t Mirth’s built-in dashboard count as monitoring?
What alerts should wake up the on-call engineer?
How does monitoring change with multiple Mirth nodes?
How does Nirmitee.io approach healthcare software development?